. 2016 Jul 27;5:e15161. doi: 10.7554/eLife.15161

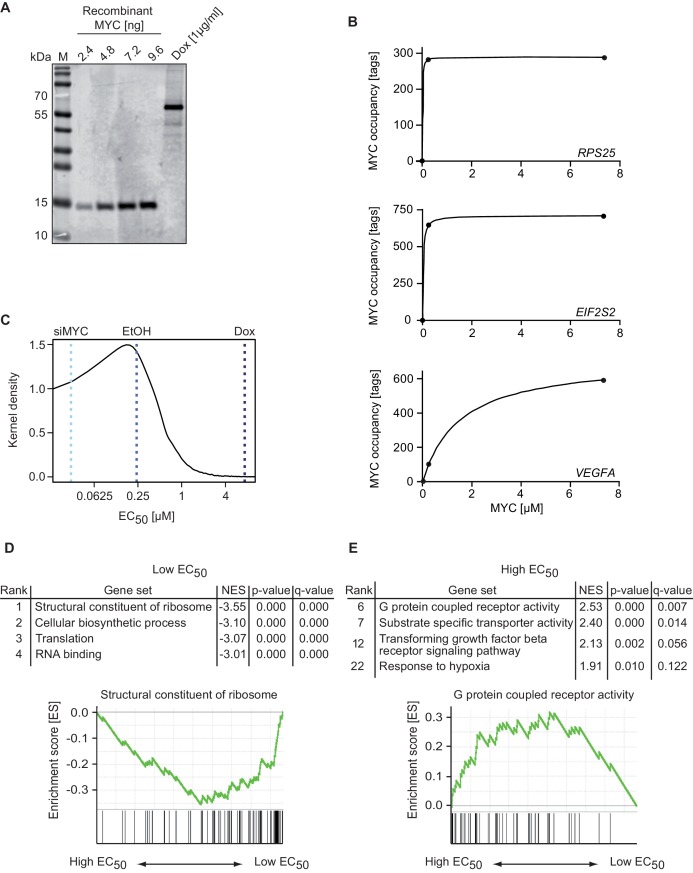
Figure 2. MYC binds with a wide range of affinity (EC50 values) to target genes.

(A) Immunoblot of MYC in U2OSTet-On cells treated with 1 µg/ml doxycycline and a recombinant MYC protein fragment, which was used for absolute quantification of cellular MYC levels (M: marker). Absolute quantification is based on biological triplicates shown in Figure 2—figure supplement 1D–F. (B) Diagram of MYC occupancy calculated in ChIP-sequencing experiments of EtOH- or doxycycline-treated U2OSTet-On cells (y-axis) versus the cellular MYC concentration (x-axis). The line was fitted using a Michaelis-Menten model and non-linear regression. (C) Density plot of the distribution of the EC50 values calculated for all MYC-bound genes. Dashed lines indicate the cellular MYC concentration in uninduced (EtOH, blue line), 1 µg/ml doxycycline treated (Dox, dark blue line), or MYC-depleted (siMYC, light blue) U2OSTet-On cells. (D, E) GSE analysis using the MSigDB C5 (GO gene sets) collection, of genes sorted according to EC50 values. Enrichment plots of two gene sets enriched in the GSE analysis are shown as examples. NES: normalized enrichment score. Both, gene sets with very low (D) and very high (E) EC50 values are shown.

DOI: http://dx.doi.org/10.7554/eLife.15161.005

Figure 2.

Figure 2—figure supplement 1. Quantification of MYC molecules per U2OS cell.

Figure 2—figure supplement 1.

(A) Coomassie staining of the recombinant MYC fragment used to quantify cellular MYC levels documenting the purity of the protein. (B) Coomassie staining of a polyacrylamide gel after the transfer of protein to a PVDF membrane (used for immunostainings in one of the panels D–F) documenting complete transfer. (C) Plot showing the quantification of signals by recombinant MYC protein in relation its protein amount (D–F). Fitting curves were used for estimating cellular MYC concentrations (see numbers in Supplementary file 1). (D–F) Immunoblots of recombinant MYC protein and MYC in U2OSTet-On cells treated with different doxycycline concentrations, EtOH and a siRNA against MYC. The 9E10 antibody was used to detect both; recombinant and cellular MYC. Immunoblots were analyzed by fluorescence-based quantitative immunoblotting. The absolute cellular MYC levels were calculated as described in Supplementary file 1 based on triplicate experiments (M: marker).
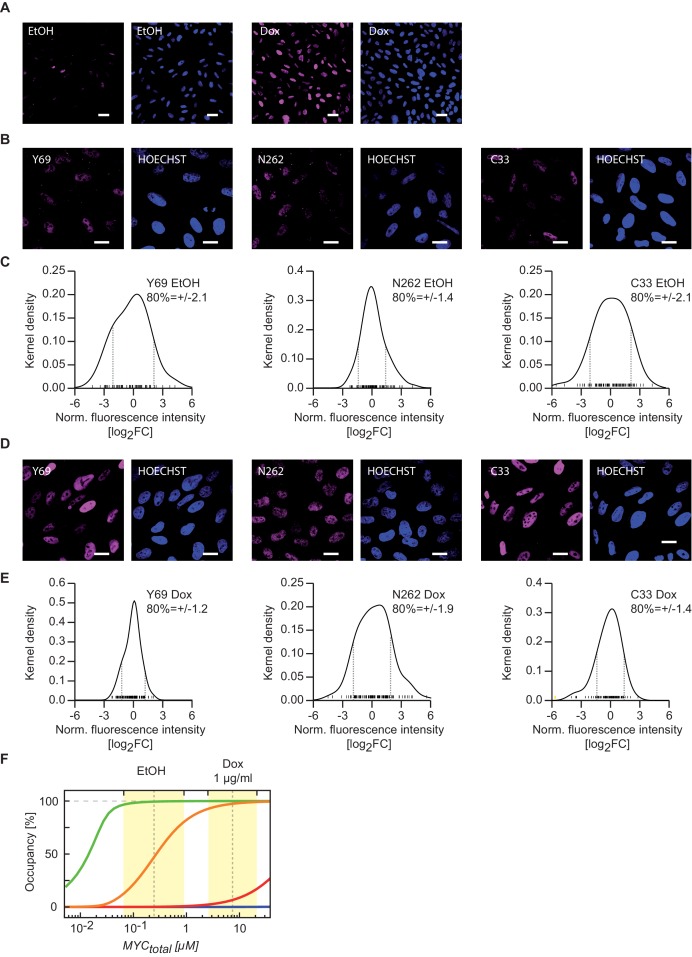
Figure 2—figure supplement 2. Variation of MYC levels within the cell population demonstrates validity of the model conclusions for the majority of cells.

Figure 2—figure supplement 2.

(A) Confocal fluorescence showing the variation of MYC expression in U2OSTet-On cells treated with 1 µg/ml doxycycline and ethanol control. Images were taken under the same imaging conditions. The scale bar represents 20 µm (blue: HOECHST, violet: Y69). (B, D) Confocal fluorescence images showing the variation of MYC expression in U2OSTet-On cells treated with 1 µg/ml doxycycline (D) and ethanol (B). The scale bar represents 10 µm. (C, E) Kernel density plots showing the quantification of MYC staining as shown in B and D. Grey dashed line: log2FC value defining a region containing 80% of all cells, yellow bar: outlier. (F) Simulations as in Figure 3G, but yellow areas here indicate the fold variation of MYC expression in the cell population as calculated from panels (C) and (E).