

Abstract
Simultaneous recordings were collected from between two and four buildup neurons from the left and right superior colliculi in rhesus monkeys in a simple two-choice brightness discrimination task. The monkeys were required to move their eyes to one of two response targets to indicate their decision. Neurons were identified whose receptive fields were centered on the response targets. The functional role of inhibition was examined by conditionalizing firing rate on a high versus low rate in target neurons 90 ms to 30 ms before the saccade and examining the firing rate in both contralateral and ipsilateral neurons. Two models with racing diffusion processes were fit to the behavioral data, and the same analysis was performed on simulated paths in the diffusion processes that have been found to represent firing rate. The results produce converging evidence for the lack of a functional role for inhibition between neural populations corresponding to the two decisions.
1 Introduction
In both psychology and neuroscience, theories of decision processes have been developed that assume that evidence is gradually accumulated over time (Boucher, Palmeri, Logan, & Schall, 2007; Churchland, Kiani, & Shadlen, 2008; Ditterich, 2006; Gold & Shadlen, 2001, 2007; Grinband, Hirsch, & Ferrera, 2006; Hanes & Schall, 1996; Mazurek, Roitman, Ditterich, & Shadlen, 2003; Platt & Glimcher, 1999; Purcell et al., 2010; Ratcliff, Cherian, & Segraves, 2003; Ratcliff, Hasegawa, Hasegawa, Smith, & Segraves, 2007; Roitman & Shadlen, 2002; Shadlen & Newsome, 2001; Smith & Ratcliff, 2004). In these studies, cells in the lateral intraparietal cortex (LIP), frontal eye field (FEF), and the superior colliculus (SC) exhibit behavior that corresponds to a gradual buildup in activity that matches the buildup in evidence in making simple perceptual decisions (see also Munoz & Wurtz, 1995; Basso & Wurtz, 1998; Horwitz & Newsome, 2001; Schall, 2003).
The neural populations that exhibit buildup behavior in LIP, FEF, and SC prior to a decision have been studied extensively. There is debate about where exactly the accumulation takes place, but it is clear that at least these three structures are part of a circuit that is involved in implementing the decision. For example, Hanes and Wurtz (2001) have shown that in spite of direct links between the FEF and oculomotor centers in the brain stem, it is the indirect, serial pathway from FEF to SC to brain stem oculomotor centers that is the most important for the control of eye movements. There are pathways that project back from the SC to the FEF, but Berman, Joiner, Cavanaugh, and Wurtz (2009) showed that although activity in the SC can modulate activity in the FEF, activity in the FEF prior to a saccade does not originate in the SC. LIP neurons project to both the FEF and SC, but Ferraina, Paré, and Wurtz (2001) found no neurons in LIP that were activated antidromically by both FEF and SC neurons, which means that they found few neurons that projected from LIP to both FEF and SC. These studies so far support the notion of a flow of information from LIP to FEF and then to SC prior to a decision. This suggests that if there is inhibition between populations of cells corresponding to the two decisions, then this inhibition should be seen where it occurs and then farther down the processing stream. For example, if there was inhibition between FEF neural populations, it would be seen in SC neural populations.
Although several studies have identified the types of neurons that make connections between LIP, FEF, and SC (Ferraina, Paré, & Wurtz, 2002; Paré & Wurtz, 1997a, 1997b; Segraves & Goldberg, 1987; Sommer & Wurtz, 2000), few have examined the synaptic effects of these projections (Helminski & Segraves, 2003). With the exception of long-range inhibitory projections from the substantia nigra to SC (Hikosaka & Wurtz, 1983; Liu & Basso, 2008), all of these long-range intracortical and subcortical projections are believed to be excitatory, with inhibition mediated by interneurons within the target structure.
We can speculate that buildup cells in the SC implement threshold crossing in this decision system because, barring the demonstration of activity related to decision making in the brain stem targets of the SC, they are the last place in the flow of information prior to a categorical choice in the oculomotor system. Chemical inactivation and microstimulation studies demonstrate that beyond its role in commanding the actual eye movement, the SC plays an essential role in selecting targets for both saccadic and smooth pursuit eye movements (Carello & Krauzlis, 2004; McPeek & Keller, 2004; Nummela & Krauzlis, 2010). In two-alternative forced-choice tasks, there is competitive activity in the buildup neurons in cells that correspond to the two decisions, with increased activity in neurons corresponding to the alternative not chosen as a function of difficulty. Although it has been shown that simultaneous activity in separate populations of burst neurons occurs when saccades follow one another in quick succession, for the single saccades generated in our task, the consensus is that when the population of buildup cells reaches criterion, categorical activity follows in burst cells in which only cells corresponding to the decision made are active (McPeek & Keller, 2002).
In models of the neurobiology of the decision process, a number apply to a range of different tasks. They all have the common theme that they assume evidence is accumulated to a decision criterion, or boundary, and that accumulated evidence corresponds to activity in populations of neurons corresponding to the decision alternatives. The models considered here have been explicitly proposed as models of oculomotor decision making in monkeys or argued to describe the evidence accumulation process in humans or monkeys. The models fall into several classes (Ratcliff & Smith, 2004; Smith & Ratcliff, 2004), including those that assume accumulation of a single evidence quantity taking on positive and negative values (Gold & Shadlen, 2000, 2001; Ratcliff, 1978; Ratcliff & McKoon, 2008; Ratcliff et al., 2003; Ratcliff, Van Zandt, & McKoon, 1999; Smith, 2000) and those that assume that evidence is accumulated in separate accumulators corresponding to separate decisions (Churchland et al., 2008; Ditterich, 2006; Mazurek et al., 2003; Ratcliff et al., 2007; Usher & McClelland, 2001). In this latter class of models, accumulation can be independent in separate accumulators, or it can be interactive, so that as evidence grows in one accumulator, it inhibits evidence accumulation in the other accumulator. The single accumulator model can be seen as implementing perfect inhibition because a positive increment toward one boundary is an increment away from the other boundary.
The models with separate accumulators have the advantage in that the two accumulators can be used to represent growth of activity in the populations of neurons corresponding to the two decisions. In the single diffusion process models, if the single process represented the aggregate activity in the two populations, then the growth of activity in the two populations would have to be perfectly negatively correlated. This is plausible if the resting activity level is relatively high in the neural populations (Roitman & Shadlen, 2002), but it is less plausible in populations in which the resting level is low (Hanes & Schall, 1996; Ratcliff et al., 2007). However, the two classes of models mimic each other at a behavioral level (Ratcliff, 2006; Ratcliff & Smith, 2004), and although the choice of models with racing diffusion processes is superior in application in oculomotor responses in monkeys, this does not rule out the viability of the single accumulator model for human behavioral and neural data (Philiastides, Ratcliff, & Sajda, 2006; Ratcliff, Philiastides, & Sajda, 2009).
In understanding the models that have separate accumulators corresponding to the separate decisions, it is important to distinguish between inhibition in evidence in the process and competition in inputs to the accumulators. Inhibition increases in one accumulator if the evidence in the other accumulator increases. It is written mathematically as a term that subtracts evidence from one accumulator as a function of the amount of evidence in the other accumulator. Usher and McClelland (2001) presented a model for perceptual decision making that assumes evidence is accumulated in separate accumulators—one for each decision. Each process is a diffusion model with leakage (an Ornstein-Uhlenbeck process) with inhibition between the accumulators. The model, and especially the notion of inhibition between the accumulation units corresponding to the separate decisions, has been widely used in modeling simple two-choice decisions (Bogacz, Brown, Moehlis, Holmes, & Cohen, 2006; Boucher et al., 2007; Machens, Romo, & Brody, 2005; Wong & Wang, 2006; Vorberg, Mattler, Heinecke, Schmidt, & Schwarzbach, 2003).
In contrast to inhibition, competition occurs in inputs to the accumulators from earlier stages. In some models, evidence (drift rates) to the two accumulators is assumed to sum to a constant. This means that when a stimulus represents strong evidence for one alternative, evidence for the other alternative is low. But when a stimulus provides relatively weak evidence for one alternative, evidence for the other alternative is much stronger. This means that support for one alternative is also evidence against the other alternative, as in the single-process diffusion process. Technically, having the inputs sum to a constant means the overall evidence entering the system is a constant. In other models, the inputs to units that implement the decision process are from earlier processing units. For example, in models for the motion discrimination paradigm (Ditterich, 2006; Mazurek et al., 2003; Niwa & Ditterich, 2008), area MT encodes sensory information, and it feeds information to LIP such that evidence from MT for one direction provides positive input to LIP for the choice corresponding to that direction, and it also provides negative evidence for inputs to other directions.
Ratcliff et al. (2007) applied a dual diffusion model with competition at input (drift rates summed to a constant) but no inhibition to a brightness discrimination task. The model fit the full complexity of the behavioral data, accuracy, and RT distributions for correct and error responses over a range of levels of difficulty. When the parameters from the fits to behavioral data were used, simulated paths of the process were generated, and these provided numerical predictions for the behavior of the firing rates in SC neurons that matched most, but not all, of the effects in the data. Specifically, Ratcliff et al. examined data from two rhesus monkeys for a task in which they decided whether patches of pixels were dark (more black pixels) or bright (more white pixels). The monkeys indicated their decisions by moving their eyes to one or the other of two response target dots of light, one to the right of a fixation point and the other to the left (see Figures 1A and 1B). There were six stimulus conditions as shown in Figure 1B: two easy and four more difficult.
Figure 1.

(A) Representative trials of the task for leftward/bright and rightward/dark responses. Each trial was initiated by fixation of a central spot for 500 to 1000 ms. Next, two peripheral targets appeared—one in each hemifield. After continued fixation of 800 ms, the brightness stimulus (a square) was presented at the fixation point. Beginning with the appearance of the stimulus, the monkey was required to make a saccade, within 500 ms, to one of the peripheral targets, based on a discrimination of the brightness stimulus. For bright stimuli, saccades to the leftward target were rewarded, and for dark stimuli, saccades to the rightward target were reinforced. (B) Left: Brightness stimuli. Task difficulty was manipulated by varying the percentage of white and black pixels. Numbers beneath the stimuli reflect the percentage of white pixels in the stimulus. Right: The pair of peripheral target locations was adjusted to place one target in a neurons response field (RF, shaded). The remaining target was positioned at a symmetric location in the opposite hemifield. (C) Dual-diffusion model for the two-choice task. The model shows two racing diffusion processes with decision criteria ca and cb, accumulation rates υa and υb (υa + υb = υsum), starting points xa and xb (uniformly distributed across trials and negatively correlated so that xa = sx − xb + xI, where xI is a baseline starting point), and decay rate (−β x). The equation for the update of evidence in accumulator i(Δxi ) at the bottom of the page has time steps of size h (=Δt), set to 1 ms in the fits of the model to the behavioral data. Variability in processing within a trial is normally distributed with standard deviation σ (where η is a random number drawn from a normal distribution with mean 0 and SD 1). Across trials, the nondecision components are uniformly distributed with mean Ter and range st. The leaky competing accumulator has variability in starting points that are uncorrelated, and the equation includes the inhibition term −κxj in which the increment to evidence is reduced as a function of activity in the other accumulator (xj ). (D) Sample paths for four examples of the accumulation of evidence for two racing diffusion process. The dashed line at the top of the figure is the decision criterion. The black line is for one process, the gray line for the other one.
As the monkeys performed the task, on a proportion of the sessions, activity was recorded from buildup cells in the left and the right SC simultaneously. The data reported here are the subset of the data with simultaneously recorded neurons from the experiment reported in Ratcliff, et al.; in that study, only single-cell recordings were considered. Here we examine the firing rate in one neuron of the pair conditioned on the firing rate from the other neuron of the pair just prior to the saccade. If single-cell firing rate is representative of a population and if there is inhibition between colliculi that depends on activity levels, then a high firing rate in one cell should correspond to a lower firing rate in the cell from the other colliculus. We sorted the data into halves based on the firing rate in one cell of the pair, high versus low, and then determined whether a high firing rate in one group corresponded to a low firing rate in the other group and vice versa.
In addition to recording from the two colliculi, on a number of trials, we were able to record from two neurons close together in the same colliculus from the single electrode in that colliculus. From these recordings, we were able to conduct another conditional analysis: if the trials are sorted into halves based on the firing rate of one cell, high versus low, then the firing rate on the other cell from the same electrode should be high versus low, respectively. This same-side analysis is important for the opposite-side analysis because although the population of cells might differ in overall firing rates from trial to trial, the behavior of a single cell might be too noisy to be predictive of the population activity. If the firing rates of two cells recorded simultaneously are positively correlated and it is possible to detect such correlations, this serves as a control on any null effects found on the opposite-side analysis. That is, if there were inhibition between colliculi reflected in a negative correlation, the method would have the power to detect it. We were also able to conduct a cross-correlation analysis on the data collected simultaneously from the two neurons recorded on the same electrode. The analysis allows us to determine whether if neuron 1 fired, it is more likely that neuron 2 fired within a short time, that is, more likely than if the two neurons were independent.
We examined predictions for the behavioral data from the two models (see Figure 1C); the leaky competing accumulator (LCA) model (Usher & McClelland, 2001), which assumes inhibition between the two accumulators, and the dual diffusion (DD) model (Ratcliff et al., 2007), which does not. Figure 1D shows simulated paths from the DD (similar to ones from the LCA model) demonstrating high variability in the paths. The assumption linking the models to neural firing rate data is that position in the decision process represents the population firing rate (Ratcliff et al., 2007). This means that variability in the paths in the models represents variability in the population firing rate.
Both models assume that the two accumulators compete for evidence. If the rate of evidence accumulation (drift rate) in one accumulator is υa, then the rate for the other is a constant minus that value: υsum −υa (i.e., the sum below the horizontal line in Figure 1C). The constant is the same across conditions of a task that vary in difficulty. This means that as the drift rate for one accumulator decreases from easier to more difficult stimuli, the drift rate for the other increases, leading to more competition between inputs. In contrast, inhibition would operate on the values of evidence in the models (firing rate in neural data), xi, in Figures 1C and 1D.
We present experimental data and model analyses that suggest that inhibition has little or no functional role in the competition between units representing the two alternatives in simple two-choice perceptual decision making. Below we present a summary of the experimental methods that are more fully described in Ratcliff et al. (2007).
2 Method
2.1 Animals and Surgery
Two female adult rhesus monkeys (Macaca mulatta) were used for these experiments. Northwestern University’s Institutional Animal Care and Use Committee approved all procedures for training, surgery, and experiments performed. Each monkey received pre-operative training followed by an aseptic surgery to implant a subconjunctival wire search coil, a plastic cilux recording cylinder aimed at the superior colliculus, and a titanium receptacle to allow the head to be held stationary during behavioral and neuronal recordings. All of these methods have been described in detail elsewhere (Dias & Segraves, 1999; Helminski & Segraves, 2003). Surgical anesthesia was induced with the short-acting barbiturate thiopental (5–7 mg/kg IV), and maintained using isoflurane (1.0–2.5%) inhaled through an endotracheal tube.
2.2 Behavioral Task
We used the REX system (Hays, Richmond, & Optican, 1982) based on a PC computer running QNX (QNX Software Systems, Ottawa, Ontario), a real-time UNIX operating system, for behavioral control and eye position monitoring. Visual stimuli were generated by a second PC controlled by the REX machine and rear-projected onto a tangent screen in front of the monkey by a CRT video projector (Sony VPH-D50, 75 Hz noninterlaced vertical scan rate, 1024 pixels by 768 pixels resolution).
Each monkey was trained to make a left or right saccade based on a brightness discrimination (see Figure 1A). After the monkey had fixated a small central spot (yellow spot; 0.25 degrees diameter) for 500 ms to 1000 ms, two peripheral response targets appeared and remained on for the duration of the trial. The targets were located opposite one another, with one in the left hemifield and the other in the right hemifield. After an additional 800 ms of fixation, a brightness stimulus was presented at the central fixation point. The brightness stimulus consisted of a 2 × 2 degrees square of white and black pixels. The ratio of black and white pixels was adjusted to create three levels of difficulty for both bright and dark stimuli (easy, middle, and hard, e.g., 98%, 65%, 55% white or black pixels for six conditions) (see Figure 1B, left). The gray-colored background luminance was set to be the same as would be achieved with a 50% white pixels stimulus. These conditions were run in a pseudorandom fashion, using a shuffling algorithm to ensure a nearly equal number of trials for each condition. The monkey was free to make a saccade to one of the targets as soon as the stimulus appeared and was allowed up to 500 ms after stimulus appearance to complete the saccade. A saccade to the target in the left hemifield was linked to discrimination of a bright stimulus, and a saccade to the target in the right hemifield was linked to discrimination of a dark stimulus. A correct response was rewarded with a drop of water. Trials with saccades made to either response target light were scored as valid and included in the data used for this report, regardless of whether the saccade was rewarded. Trials on which the monkey failed to make a saccade, made a saccade that did not terminate at either response target, or made a saccade in less than 120 ms were rejected. During training, we presented nine pairs of target locations that were in three orientations (45 degree spacing) at three eccentricities (5, 10, and 15 degrees away from the fixation point) in separate blocks (see Figure 1B, right). Additional details regarding the training regimen for this task are in Ratcliff et al. (2007).
A gap saccade task was used to aid in the classification of neurons. The gap task began with a variable period of fixation. After the disappearance of the fixation light, a gap period of 400 ms was inserted before the appearance of the peripheral target light. When the peripheral target appeared, the monkey was required to make a saccade to it within 500 ms and was rewarded after the completion of the correct movement. The gap task was also used to map the response field (RF) within which the maximal response was obtained. The neurons included in this study were all located in the saccade-related region of the superior colliculus and were chosen in part based on their lack of responsiveness to a central visual stimulus. After the RF was defined by checking the online histograms in the REX system, we switched the task to the brightness discrimination task in which we presented one target in the RF (preferred location) and the other at a nonpreferred location set to the same amplitude and rotated 180 degrees from the preferred location (see Figure 1C). Every difficulty condition for both bright and dark stimuli was tested more than 30 times per session.
2.3 Recording
The location of the SC was confirmed by stereotaxic coordinates, the response properties of isolated neurons, and the characteristics of its topographically organized visual-motor map. We recorded from neurons in the deep layers of the SC. We define deep layers as all collicular layers located below the superficial layers (superficial gray and stratum opticum), including the intermediate and deep gray layers. Assurance that the neurons included in this study were confined to the deep layers of the SC is based on the fit of our electrode penetrations to the highly reproducible map of the SC, the ability to evoke saccades from our recording sites with current intensities of less than 50 μA, and the match of recorded activity to established cell activity types in these layers. To match the primarily left-right symmetry of the brightness task (see Figure 1B, right), we selected recording sites close to the SC’s horizontal meridian representation and avoided sites where the representation included a strong vertical component. The recording of single and multiunit activity was done with tungsten microelectrodes (A-M Systems) introduced through stainless steel guide tubes that pierced the dura, using a Crist grid system. A 16-channel Plexon system was dedicated to online spike discrimination and the generation of pulses marking action potentials, which were stored by the REX system. The Plexon system could isolate two neuron waveforms from each electrode. We normally used one or two electrodes for recording from a maximum of four neurons. When two electrodes were used, each was positioned independently by a separate hydraulic microdrive (Narishige). The base for the microdrives was modified so that it would support both microdrives for introduction of electrodes into the same SC cylinder.
When two neurons were isolated from the signal recorded from a single electrode, our spike discrimination system was unable to identify spikes from those neurons when they occurred simultaneously. When the waveforms of both spikes are superimposed, none of the contributing individual waveforms are recognized. This is a common problem with template-matching spike sorters and limits somewhat the analysis of simultaneous recording from cells in the same receptive field. Specifically, if the firing rates are high for both cells and two cells fire in the same millisecond, one or both of the spikes will be missed, leading to an underestimation of firing rates and a reduced cross-correlation. At the firing rates in this study, the effect is very small for the analyses we present. At a firing rate of 150 spikes per second, there is only a .152 = .023 probability of two spikes being coincident in the same millisecond. In conditional analyses presented later, we add spikes back into the data based on the statistics of the firing rate functions and presented data both with and without this correction. For a cross-correlation analysis between two spike trains recorded on the same electrode, the cross-correlation will be zero when the two spike trains are temporally exactly aligned. However, there is no loss of spikes when two different electrodes are used to record from neurons corresponding to the two different targets in the two colliculi.
Our analyses are based on data from the two rhesus monkeys performing the simple brightness discrimination task (see Figure 1A; Ratcliff et al., 2007). We identified buildup neurons in one SC and determined their receptive field (see Figure 1B, right). We then attempted to find a buildup neuron in the contralateral SC whose receptive field center was of equal amplitude but 180 degrees from the first. We were able to record simultaneously from neurons in both colliculi for 10 sessions (because multiple neurons were recorded in a session, there were 26 neuron pair combinations in this analysis) and from pairs of neurons in the same colliculus for 24 sessions, with most sessions taking between 60 and 90 minutes. Response targets were placed in the two receptive fields of the neurons corresponding to the two response targets and firing rates (in spike per second) were recorded as the monkeys performed the task (Munoz & Wurtz, 1995). In this study, we were concerned only with examining the behavior of buildup cells in the SC. Buildup activity was monitored during the final 200 ms of the gap period, before the appearance of the target light, in the gap saccade task, and compared for significant increases (Wilcoxon sign-rank test, p < 0.05) above fixation period activity measured during the final 200 ms before the disappearance of the fixation light and beginning of the gap period. When another kind of cell was isolated, it was discarded, and the electrode was moved to attempt to find a buildup cell. This means we have no distributional information about the population of cell types in the areas of the SC we examined.
3 Results
We performed four analyses on the data from simultaneous recording of neuron pairs and two model-based analyses. We first asked whether a high firing rate predicted a low firing rate in the other neuron recorded simultaneously. One analysis was performed for pairs of neurons recorded in opposite colliculi, and another analysis was performed for pairs of neurons recorded on the same electrode. Model analyses were then performed for simulated data for the population behavior for the opposite-side analyses from the DD and LCA models using parameter values from fits to the behavioral data. Following this, cross-correlation analyses between the neuron pairs were performed.
3.1 Behavioral Fits
We fit the LCA and DD models as in Ratcliff et al. (2007). Figure 2 shows the fits of the model to the behavioral data. The fits are not perfect but match those in Ratcliff et al. (2007).
Figure 2.

Quantile probability plots for each monkey in the experiment for the conditions with simultaneously recorded neurons. The x’s are the data, and the o’s and lines joining them are the model’s best predictions. When there were very few observation for error responses, an M is shown, which is the median RT. The five x’s in each column represent the .1 (a), .3 (b), .5 (c, the median), .7 (d), and .9 (e) quantile response times for a particular condition.
3.2 Firing Rate Analyses
For the firing rate analyses, when the firing rates in both neurons of a pair are relatively high, there is a significant probability of both neurons spiking in the same millisecond, with the result that both of the spikes will be missed. To address this, we performed an analysis in which we added spikes back in based on the probabilities of the spikes occurring at each millisecond time step. For example, if neuron 1 is firing at 100 spikes per second and neuron 2 at 80 spikes per second, there is a .1 × .08 probability of simultaneous spikes: 0.8% of the trials will have simultaneous spikes. When the firing rate is high for the same-side analysis, the average firing rate 30 ms before the saccade is 120 spikes per second, which gives a probability of 1.4% of simultaneous spikes. For some neurons, the spike rate is much higher, with probabilities around 4% or 5%. We simply added spikes into both sides based on these probabilities (we stepped through the spike trains and added a spike into the other side with the probability derived from the spike rates). We present the analysis for same-side neurons with and without the correction.
3.3 Opposite-Side Neuron Pairs
To determine whether there is inhibition between neurons in opposite colliculi in performing the brightness discrimination task, we examined the firing rate in cells corresponding to the correct response (target neurons) and cells corresponding to the incorrect response (contralateral neurons). We pooled data for each of the conditions and then selected a window before the peak activity in which the firing rate for the target neurons was rising between 90 ms and 30 ms prior to the saccade. Then we sorted the trials for correct responses for each stimulus condition within each session into halves depending on whether there was a high number or low number of spikes in the window. If there is inhibition, then for the trials in which there was a high firing rate in the target neurons, there should be a low firing rate in the contralateral neurons.
Six sessions for monkey 11 and four sessions for monkey 12 were used. Because multiple neurons were recorded in a session, there were 60 neuron pair combinations in the analysis (and three levels of difficulty, leading to 180 neuron-session-stimulus condition combinations in the analysis). For example, if two neurons were recorded in each colliculus, there would be four neuron pair combinations for that one session. The total number of neuron-pair trials in the analysis was 9498.
The firing rate functions for this analysis are presented in Figure 3A for the trials with the high and low number of spikes in the target neurons and for the same trials for the contralateral neurons. These are averaged over trials, cells, and monkeys. The main result is that there was no evidence for inhibition. The firing rates for the contralateral neurons were the same whether the activity in the target neurons was high or low. Paired t-tests support this conclusion. For the contralateral cells, the number of spikes in the window for the high half of the data, 2.51 (41.8 spikes/s), was not significantly different from that for the low half, 2.56 (42.5 spikes/s) (t(197) = −0.98, p > .05). This suggests that there is no measurable inhibition from one neural population coding one decision to the other population coding the other decision. Figure 4A shows the spike rates for the 180 neuron session pairs for the data conditionalized on a high versus low firing rate on the other member of the pair.
Figure 3.

Firing rate data for the higher firing rates to the target in the 90 ms to 30 ms prior to the saccade (solid black line) and for the lower firing rates (dashed black line). (A) The solid gray line is the firing rate in the contralateral neurons when the target neuron firing rate is high, and the dashed gray line is the firing rate in the contralateral neurons when the target neuron firing rate is low. (B) The solid gray line is the firing rate in the second neuron of a pair recorded on the same electrode when the target neuron firing rate is high, and the dashed gray line is the firing rate in the second neuron of the pair when the target neuron firing rate is low. The gray rectangles represent the range of times prior to the saccade that are used to divide the firing rates into high and low values.
Figure 4.

Plots of the firing rates for each neuron pair. (A) Opposite-side analysis. (B) Same-side analysis. The y-axis has the firing rate when the other neuron of the pair had a high firing rate in the 90 ms to 30 ms range prior to the saccade, and the x-axis has the firing rate when the other neuron of the pair had a low firing rate in the 90 ms to 30 ms range prior to the saccade.
For this opposite-side analysis, the correction for simultaneous spikes is not needed because spikes were not missed when recording was on different electrodes. When two neurons were recorded on one electrode, and one of these was used as a contralateral neuron, the spike rate was low, on average 42 spikes per second, which gives a 0.17% chance of simultaneous spikes.
3.4 Same-Side Neuron Pairs
We pooled data from each of the conditions in the experiment. We then selected a window 90 ms and 30 ms prior to the saccade (before peak activity) in which the firing rate for the target neurons was rising. As for the opposite-side analysis, we sorted the trials for correct responses for each stimulus condition within each session for one of the neurons of the pair into halves depending on whether there was a high number or low number of spikes in the window. If the firing rate for one neuron predicts the firing rate of the other neuron of the pair, sorting the trials based on a high versus low firing rate in one neuron should produce a high versus low firing rate, respectively, in the other neuron of the pair.
Twelve sessions for monkey 11 and 12 sessions for monkey 12 were used. The total number of neuron-pair trials in the analysis was 3748 (there were 72 neuron-session-stimulus condition pairs). The firing rate functions for this analysis are presented in Figure 3B for the trials with the high and low number of spikes in one neuron of the pair (chosen randomly) and for the same trials for the other neuron of the pair. These are averaged over trials, cells, and monkeys. When there was a high firing rate in one neuron of the pair (the solid black line), there was a higher firing rate on average for the other neuron of the pair (the solid gray line).
Figure 5 provides a sample of the activity for three neurons recorded during one of these sessions where two adjacent neurons were isolated by a single electrode in the left superior colliculus, while at the same time, a third neuron was isolated by a second electrode in the right superior colliculus. The top panel shows activity in the gap task, and the bottom panel shows activity in the brightness discrimination task.
Figure 5.

Example of activity for three SC neurons recorded simultaneously. Units 1 and 2 were isolated from the same electrode positioned in the left SC. Unit 3 was isolated from a second electrode positioned in the right SC. (Top) Activity recorded during performance of a gap saccade task. Light gray shading in the right column of rasters marks activity for trials where the target was located within the response field for units 1 and 2 at 15 degrees, 0 degrees. Dark gray shading in the left column of rasters marks activity for trials where the target was located within the response field for unit 3 at 15 degrees, 180 degrees. On the left side of each pair of rasters, 0 ms marks the beginning of the 400 ms gap period (no fixation or target present) occurring after a period of fixation of variable length, and 400 ms marks the time when the target was turned on at one of two possible locations. Large black dots in raster lines mark the beginning of a saccade to the target. On the right side of each pair of rasters, 0 ms marks the beginning of a saccade to the target, and large black dots mark the appearance of the target at the end of the gap period. (Bottom) Activity recorded during the medium difficulty condition of the brightness discrimination task. Left: For the lighter stimulus condition, saccades to the leftward target in the preferred direction for unit 3 were rewarded. Right: In the darker stimulus condition, saccades to the rightward target in the preferred direction for units 1 and 2 were rewarded. On the left side of each pair of rasters, 0 ms marks the appearance of the brightness stimulus (cue). Large black dots mark the beginning of a saccade to the correct target choice. On the right side of each pair of rasters, 0 ms marks the beginning of a saccade to the correct target, and large black dots mark the appearance of the brightness stimulus. The spike density histogram below each raster was generated by first convolving single-trial neuronal activity using a gaussian kernel with a sigma of 10 ms (Richmond, Optican, Podell, & Spitzer, 1987), then averaging the spike density profile across trials.
For the number of spikes for the second neuron of the pair conditioned on a high versus low number of spikes for the first neuron of the pair, the difference in number of spikes was significant: the number of spikes for the high half of the data, 5.23 (87.1 spikes/s) was higher than the number of spikes for the low half of the data, 4.63 (77.2 spikes/s), paired t(71) = 4.23, p < 6.80 × 10⁻⁵. For the analysis without spikes added back in statistically, the number of spikes for the high half of the data, 4.77 (79.5 spikes/s), was higher than the number of spikes for the low half of the data, 4.34 (72.3 spikes/s), paired t(71) = 3.10, p < .003. Figure 4B shows the spike rates for the 72 neuron session pairs for the data conditionalized on a high versus low firing rate on the other member of the pair. This analysis shows that the firing rates of pairs of neurons recorded on the same electrode are associated: if one is firing at a higher rate than the mean, the other is also firing at a higher rate than the mean. This also provides a control for the opposite-side analysis. It is evidence that firing rates for single neurons in a population are representative of the activity in other members of the population and that our methods can detect this.
To examine the power of these analyses, we generated simulated spike trains (1 ms steps) with average spike rates of 42 spikes per second with SD 10. This was done independently for two units. If there was a spike in one unit, we added a spike in the other unit with probability 0.05, 0.033, or 0.025. This led to an increase in the spike rate of 2.1, 1.4, or 1.1, respectively. The number of trials and number of pairs were the same as for the opposite-side analysis. If this simulation is repeated, about half the comparisons produce a significant difference between the two sides for the 0.025 probability, whereas for the 0.05 probability, all the comparisons are significant. For the 0.033 probability, about 19 of 20 comparisons were significant. This means that the number of neuron pairs and trials we collected provides enough power to reliably detect a difference in spike rate of just over 1 spike per second.
As a further analysis of the difference between same- and opposite-side firing rates, for each neuron pair for each experimental condition for each session, we computed a correlation between the number of spikes between the pairs of neurons. This resulted in 180 and 72 correlations for opposite-side and same-side neurons, respectively. A t-test with Welch’s correction gave a significant difference between the two sets of correlations, t = 2.02, df = 106.8, p < .05. This shows there was a greater positive correlation between firing rates in the range of 90 ms to 30 ms before the saccade for same-side neuron pairs than different-side neuron pairs.
3.5 Model Analyses
We fit the DD model and the LCA model to the behavioral data (not the neuronal firing rate data) for each monkey using the reaction time and accuracy data for the same sessions used in the opposite-side firing rate analysis just described. As reported previously by Ratcliff et al. (2007), both models provided good fits to the data. Then, for each model and in a manner similar to that of Ratcliff et al., we used the best-fitting parameter values (see Table 1) to generate simulated paths for both accumulators up to the point at which the process hits the decision criterion (e.g., see Figure 1D) for the target accumulator. We assumed that the average firing rates of the target and contralateral neurons are represented by the amounts of evidence in the accumulators, so that as the amount of evidence increases, the firing rate increases. These analyses were based on 40 sessions of simulated data, with 4000 trials per session. We then performed the same analyses for these simulated paths as for the firing rate data, dividing the trials into those with the higher amount of evidence in the target accumulator just prior to that process hitting the decision criterion and those with the lower amount of evidence. In the models, because some processes do not start until just before 50 ms prior to the decision, we used a smaller range, 50 ms to 30 ms prior to the decision than in the analysis of the data. In the models, the distributions of starting times of the decision process prior to the saccade are shaped like a reversed RT distribution (see Figure 8 in Ratcliff et al., 2007). For monkey 11, 90% of model-based processes start between 40 ms and 90 ms prior to the saccade, and for monkey 12, 90% of the model-based processes start between 50 ms and 170 ms prior to the saccade. As with the firing rate data, we combined the simulated data in the same way as for the data from the 2 monkeys.
Table 1.
Mean Parameters for the Dual Diffusion Model.
| Monkey | Model | ca | cb | sc | β | κ | Ter (ms) | st(ms) | υsum |
|
|
|
|
|
|
||||||
|---|---|---|---|---|---|---|---|---|---|---|---|---|---|---|---|---|---|---|---|---|---|
| 11 same | DD | 0.420 | 0.564 | 0.192 | 3.69 | 161 | 30 | 10.00 | .998 | .941 | .781 | .473 | .248 | .011 | |||||||
| 11 opposite | DD | 0.451 | 0.552 | 0.215 | 3.66 | 162 | 32 | 10.60 | 1.00 | .991 | .733 | .489 | .312 | .009 | |||||||
| 12 same | DD | 0.506 | 0.519 | 0.130 | 3.35 | 152 | 53 | 6.04 | .937 | .926 | .692 | .451 | .230 | .011 | |||||||
| 12 opposite | DD | 0.503 | 0.483 | 0.205 | 3.44 | 159 | 51 | 5.86 | .991 | .925 | .659 | .468 | .232 | .010 | |||||||
| 11 same | LCA | 0.576 | 0.766 | 0.396 | 1.78 | 1.66 | 155 | 23 | 13.08 | .977 | .834 | .714 | .499 | .324 | .086 | ||||||
| 11 opposite | LCA | 0.577 | 0.740 | 0.400 | 1.49 | 1.69 | 156 | 18 | 12.70 | 1.00 | .875 | .696 | .524 | .339 | .083 | ||||||
| 12 same | LCA | 0.696 | 0.717 | 0.397 | 1.71 | 1.70 | 148 | 44 | 9.19 | .788 | .777 | .622 | .471 | .343 | .133 | ||||||
| 12 opposite | LCA | 0.718 | 0.701 | 0.390 | 1.71 | 1.50 | 145 | 45 | 9.23 | .785 | .723 | .591 | .510 | .389 | .128 | ||||||
| 11 all | DD | 0.444 | 0.542 | 0.202 | 3.92 | 161 | 30 | 9.91 | .998 | .921 | .730 | .454 | .242 | .011 | |||||||
| 12 all | DD | 0.503 | 0.521 | 0.106 | 3.47 | 154 | 53 | 5.78 | .917 | .840 | .675 | .476 | .234 | .010 | |||||||
| 11 all | LCA | 0.580 | 0.743 | 0.300 | 1.79 | 0.92 | 149 | 31 | 12.33 | .992 | .846 | .683 | .490 | .354 | .083 | ||||||
| 12 all | LCA | 0.705 | 0.754 | 0.399 | 1.76 | 1.60 | 149 | 45 | 8.97 | .774 | .725 | .611 | .523 | .363 | .130 |
Notes: The model parameters are: decision criteria ca and cb, υ1 through υ6 are the accumulation rates (if one accumulator rate is υi, the other is υsum − υi ). Nondecision component mean is Ter and range is st. sc is the range of starting points. For the dual diffusion model, one starting point is a uniformly distributed random number with range sc, and the other is sc minus this random number. For the LCA model, the two starting points are independent and are selected from a uniform distribution with range sc. β is decay, and κ is inhibition for the LCA model.
The simulated paths for the target and nontarget accumulators for correct responses were divided into halves based on the firing rate and shown in Figures 6A and 6B. Just like the neuronal data, they show no inhibition for the nontarget accumulators. For the DD model, there is no difference between average paths for the two firing rate functions for the competitor accumulator, t(39) = −0.58, p > .05. This is expected because the model does not have an inhibition process. There is also no difference for the LCA model, t(39) = −0.053, p > .05.
Figure 6.
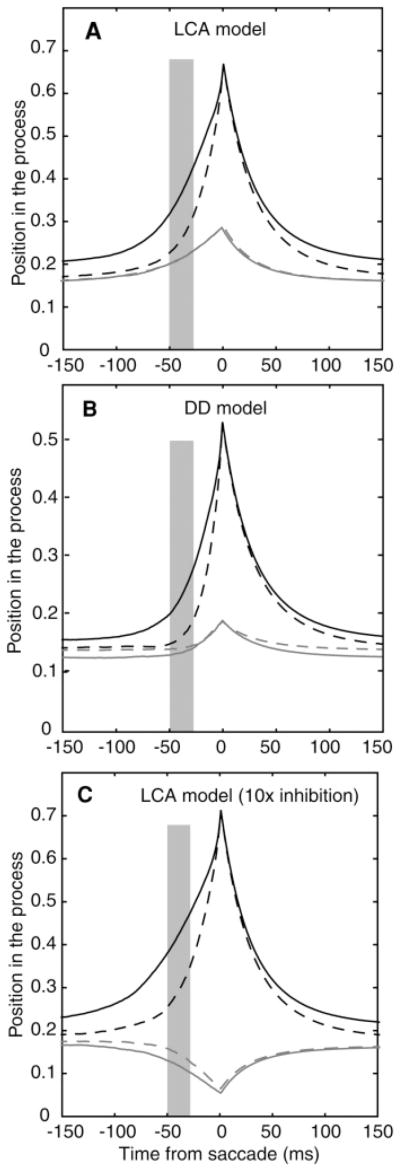
(A) The same plot as in Figure 3A for simulated paths in the leaky competing accumulator model. (B) The same plot for simulated paths in the dual diffusion model. (C) The same plot for simulated paths in the leaky competing accumulator model with inhibition 10 times larger than the value from the fits to the behavioral data. The gray rectangles represent the range of times prior to the decision that are used to divide the simulated paths into high and low values.
The expected size of the effect of inhibition can be examined for the LCA model. The equation for the increment to evidence at every time step is shown in Figure 1C. Table 1 shows values of the parameters for the two monkeys and if we take typical values of the parameters, for example, criteria c = 0.6, h = .001 (1 ms steps), decay β = 3.0, inhibition κ = 0.9 (the larger of the values for the two monkeys), drift rate υ = 8.0, and σ = 1.0, then the update equation is: dxi = (0.008 − 0.003xi − 0.0009xj + N(0,0.032).
These parameter values in the equation show why inhibition has no significant effect: if both processes are three-quarters of the way to criterion (xi = xj = 0.45), then inhibition is small relative to both the drift rate and gaussian variability. Drift rate is close to 20 times the size of inhibition, and 1 standard deviation in variability is about 80 times larger than inhibition.
To demonstrate that the LCA model can produce measurable inhibition between accumulators, we increased the size of inhibition by a factor of 10 from the value obtained from fits to the behavioral data. The large value of inhibition appreciably worsened the fit to the behavioral data. Figure 6C shows the result: inhibition in activity of the competing accumulator as a function of activity in the target accumulator (dividing the simulated paths as in the other model analyses, t(39) = −6.29, p < .05). However, the simulated activity is unlike the neuronal data because in the experimental data, firing rates in the contralateral neurons rise above baseline prior to the decision, but in these simulated data, the firing rate function falls below baseline.
The simulated paths for the nontarget accumulators in the DD and LCA models deviated from the experimental firing rate data in one major way. In the experimental data, the firing rates rise and then, around the time of the saccade, fall and rise again (see Figure 3A). This is consistent with global inhibition just prior to the saccade in which a threshold amount of population activity is required to turn on the inhibition (Munoz & Istvan, 1998; Ratcliff et al., 2007). However, this is not competitive inhibition as implemented in the LCA model. The models miss this dip, but other than this, they produce competing activity with a size that is plausible. There are also misses in the width of the activity function at the peak; the model predictions could be made more like the data by assuming some plausible variability in the time of peak activity around the saccade. Another miss is that the heights of the two target firing rate functions are different, while the heights for the models are the same. This miss is likely the result of trial-to-trial variability in the firing rates of individual neurons relative to the population because it is the population activity that is assumed to reach the same criterion, not that of each individual neuron.
3.6 Cross Correlation Analyses
We can also examine cross-correlations in activity for neurons on the same and different sides. The problem with conducting the analyses on the data in Figures 3A and 3B is that the firing rates are nonstationary (increasing left to right as a function of time), and so significant cross-correlations might be introduced because of this nonstationarity even if pairs of spike trains were completely independent. However, there is a period after response target presentation and before stimulus onset that provides stationary activity (Bair, Zohary, & Newsome, 2001) over a range of 500 ms before stimulus presentation (see the schematic in Figure 1A). This period provides a moderate amount of activity in the neurons (about 19 spikes per second) because the targets are centered in the receptive field of the neurons corresponding to the two choices.
We might expect a positive correlation between neurons on the same side recorded on the same electrode. Pairs of neurons recorded on the same side have a good chance of receiving similar inputs. But it is unlikely that pairs of neurons recorded on opposite sides will show any significant degree of cross-correlation. The expressions for the cross-correlogram are shown in the appendix and follow Bair et al. (2001).
Figure 7 shows plots of the cross-correlogram for pairs of neurons recorded on the same side (see Figure 7A) and for pairs of neurons recorded on opposite sides (see Figure 7B). The cross-correlations were done in the range −500 ms to stimulus presentation in five windows of 100 ms. These five sets of cross-correlations were averaged and then averaged over cells. The results show an elevated cross-correlation in firing rate for pairs of neurons recorded on the same side. There is a dip for coincidence for when the two sequences are aligned because the recording apparatus cannot differentiate spikes that occur simultaneously on a single electrode. The results show a weak correlation in firing rates of neurons corresponding to the same response target in the range of lags from −20 to 20 ms. In contrast, as expected, Figure 7B shows no elevation or dip in the cross-correlation between neurons corresponding to different response targets in opposite colliculi. This is expected because of the lack of inhibition obtained in the earlier analyses. The same-side results match those of Bair et al. (2001; see also Mazurek & Shadlen, 2002), but our results show smaller effects. This may represent inherent differences in connectivity patterns within MT versus SC. These results show that a common input to neurons close to each other produces small but significant increases in the probability of spiking. But these effects do not extend to neurons recorded on different electrodes in different colliculi.
Figure 7.

(A) Cross-correlation for same-side neurons in the 500 ms prior to stimulus onset. (B) Cross-correlation for opposite-side neurons in the 500 ms prior to stimulus onset. The dashed lines are three standard error bars. (C) Average firing rate across neurons and averaged over five 100 ms windows between 500 ms prior to stimulus onset and stimulus onset.
Figure 7C shows the average firing rate across the 100 ms windows used in the cross-correlation analysis. This shows that the firing rate was stable across the range.
4 Discussion
Our results show no measurable inhibition in firing rates between neurons in opposite colliculi corresponding to the two choices in our two-choice brightness discrimination task. Simultaneous recordings were collected from neurons corresponding to the two response targets, and trials were divided into those with high and low firing rates in the range of 90 ms to 30 ms prior to the saccade in neurons corresponding to target responses. Firing rates in the neurons corresponding to nontarget responses showed no inhibition; that is, the firing rate in contralateral neurons was the same whether there was a high or low firing rate in target neurons. As a control, the same analysis conducted on pairs of neurons recorded on the same electrode showed a positive relationship in the same analysis. There was a higher firing rate for a neuron when the paired neuron had a higher-than-mean firing rate compared with the case in which the paired neuron had a lower-than-mean firing rate.
To examine the role of inhibition within and between colliculi, Munoz and Istvan (1998) performed a study in which the buildup and fixation zones of the intermediate layers in the monkey SC were activated by microstimulation. The effects of the microstimulation were measured in both the ipsilateral and contralateral populations of neurons in the fixation and saccade zones of the two colliculi. They found that stimulation of the saccade zone had strong inhibitory effects on both the ipsilateral and contralateral saccade zones. For the ipsilateral zone, the measurements were made relatively far apart (usually two mm), far enough to correspond to nonoverlapping receptive fields, which means there was no evidence for either facilitation or inhibition within the same population corresponding to a single eye movement decision. Although there was evidence for inhibition between saccade neurons in the contralateral zones, only one buildup neuron was tested with the saccade zone stimulation manipulation.
The timing of inhibition in Munoz and Istvan (1998) led them to suggest that the inhibitory connections were not strong enough to provide evidence for direct connections among the neurons both long range in the same SC and between colliculi. They also suggested that it was unlikely that the inhibition was due to activation of neurons outside the SC (e.g., substantia nigra), which then have inhibitory connections back to the SC. Their preferred explanation was that the SC neurons activated by the microstimulation excited short-range inhibitory interneurons, which were sufficient to inhibit movement cells in both colliculi.
A number of other studies have examined inhibitory effects in the SC. Li, Kim, and Basso (2006) found evidence for inhibitory interactions unilaterally, with the amount of inhibition decreasing with distance in monkey SC. Takahashi, Sugiuchi, and Shinoda (2007) found that inhibitory effects between colliculi in cats were restricted to sites representing upward versus downward saccades. In contrast, Lee and Hall (2006) found no evidence for long-range inhibitory effects in the rat SC and argued that the long-range activity found in other studies could arise from connections outside the SC or from multisynaptic (not direct) pathways between the two colliculi. There appear to be differences in the SC circuitry for rats, cats, and monkeys, but identical studies have not been done in all three species, so it is difficult to make explicit comparisons. The physiology of the cat SC and rat SC is not the same as the monkey SC, so the results do not apply directly to processing in the monkey SC. We do not know what the results of a similar experiment in monkeys would be. Since we confined our recordings to locations close to the horizontal meridian representation, avoiding sites representing saccades with a strong vertical component, our recordings appear to have excluded sites where Takahashi and colleagues (2007) found inhibitory connections in cats. Although the presence of inhibitory circuitry in the SC is long established and inhibitory interactions are often an important component of collicular models (e.g., Van Opstal & Van Gisbergen, 1989), here we were able to directly test for functional inhibitory interactions between populations of neurons mediating two-choice discriminations.
We suggest that the inhibition measured in the microstimulation experiments represents inhibition that is sent out by a population of neurons about to make a decision to suppress other populations that might also want to make a decision. If inhibition does not affect the inputs driving the neurons, then the inhibition should be relatively short-lived and might not permanently drive down activity in neurons corresponding to competing decisions. When the inhibition is turned off (when a saccade is initiated), activity in the contralateral cells corresponding to the other response target would recover because the inputs driving the process were still active. This is what is found (Ratcliff et al., 2007). As Ratcliff and colleagues note, the size of this inhibition would have to be very large—about 50 times larger than the size of inhibition obtained from fits of the LCA model to behavioral data.
In the theoretical analysis, we first fit the models to the behavioral data. Then we generated simulated paths that represent the activity in the evidence accumulation process (Ratcliff et al., 2003, 2007). The nearer the process to the decision criterion, the higher the firing rate. It is surprising that there is no measurable inhibition in the simulated paths from the LCA model given how much discussion there has been about the need for inhibition (Bogacz et al., 2006; Usher & McClelland, 2001). The size of inhibition in the LCA model obtained using the parameter values for fits to behavioral data was found to be small relative to the size of both noise and the drift rate driving the process. Thus, the predicted size of the inhibition is small, and this explains the lack of inhibition in the simulated paths. If the size of the inhibition parameter in the LCA model is increased by a factor of 10, then inhibition is obtained, but the activity in the nontarget accumulator falls instead of rising, and this is accompanied by a decrease in goodness of fit to behavioral data. There is no measured inhibition in the prediction from the dual diffusion model because the model does not have inhibition. Along with the predictions for the behavioral data and the simulated paths in Ratcliff et al. (2007), these results provide additional support for this model.
The cross-correlation between neurons on opposite sides in data collected in the period between presentation of the two response target lights and the stimulus also found no evidence for any change in the probability of a neuron firing in one colliculus as a function of a neuron in the other colliculus firing. We might expect such an effect only if there was a large same-side effect with large cross-correlations between neurons on the same side. However, for the same-side analyses, there was only a very modest increase in the cross-correlation for neurons recorded on the same electrode.
The overall results show that in the SC, there is little evidence from a theoretical or empirical perspective for a functional role of inhibition in simple two-choice decision making. The experimental and theoretical results produce converging evidence for the lack of a functional role of inhibition in this part of the processing system, that is, the SC in simple two-choice decision-making tasks. The result also supports models of the class that do not assume inhibition between accumulators (Churchland et al., 2008; Ditterich, 2006; Niwa & Ditterich, 2008; Mazurek et al., 2003; Ratcliff et al., 2007), but it calls for further examination of models that do assume inhibition between accumulators (Bogacz et al., 2006; Boucher et al., 2007; Machens et al., 2005; Wong & Wang, 2006; Vorberg et al., 2003).
Acknowledgments
Support for this research was provided by National Institutes of Health grants R01-MH- 59893, R37-MH-44640, R01-EY-08212. We thank Jeff Schall, Gail McKoon, Gordon Logan, and Anne Churchland for comments on the manuscript.
Appendix A: Cross-Correlation Analyses
We followed the analysis presented in Bair et al. (2001). The cross-correlation is computed from the spike trains for each trial as in equation A.1,
| (A.1) |
and then the cross-correlogram is computed from the cross-correlation (Cjk, equation A.2)
| (A.2) |
minus the shift predictor (Sjk) divided by the square root of the two firing rates (λ) and the normalizing triangular function (Θ, equation A.3):
| (A.3) |
The baseline shift predictor (Sij (τ)) is obtained from the poststimulus time histograms (for us, 200 ms after the onset of the two targets), which is the normalized sum of the spikes at each time step (see equations A.4 and A.5):
| (A.4) |
| (A.5) |
The cross-correlograms for each neuron pair were then averaged over neuron pairs, and these are presented in Figure 7.
For the cross-correlogram plots, data in the range 200 to 800 ms after “response targets on” and before “stimulus on” were used. Neurons that were relatively inactive, with fewer than four total trials with four or more spikes in the 600 ms interval, were discarded from the cross-correlogram analysis. This resulted in 12 neuron pair sessions for the same-side analysis and 26 neuron pair combinations for the opposite-side analysis.
Contributor Information
Roger Ratcliff, Email: ratcliff.22@osu.edu, Department of Psychology, Ohio State University, Columbus, OH 43210, U.S.A.
Yukako T. Hasegawa, Email: yt-hasegawa@aist.go.jp, Neuroscience Research Institute, AIST, Tsukuba, Ibaraki 305-8568, Japan
Ryohei P. Hasegawa, Email: r-hasegawa@aist.go.jp, Neuroscience Research Institute, AIST, Tsukuba, Ibaraki 305-8568, Japan
Russ Childers, Email: russ@eccles.psy.ohio-state.edu, Department of Psychology, Ohio State University, Columbus, OH 43210, U.S.A.
Philip L. Smith, Email: philipls@unimelb.edu.au, Psychological Sciences, University of Melbourne, Victoria 3010, Australia
Mark A. Segraves, Email: m-segraves@northwestern.edu, Department of Neurobiology and Physiology, Northwestern University, Evanston, IL 60208, U.S.A
References
- Bair W, Zohary E, Newsome WT. Correlated firing in macaque visual area MT: Time scales and relationship to behavior. Journal of Neuroscience. 2001;21:1676–1697. doi: 10.1523/JNEUROSCI.21-05-01676.2001. [DOI] [PMC free article] [PubMed] [Google Scholar]
- Basso MA, Wurtz RH. Modulation of neuronal activity in superior colliculus by changes in target probability. Journal of Neuroscience. 1998;18:7519–7534. doi: 10.1523/JNEUROSCI.18-18-07519.1998. [DOI] [PMC free article] [PubMed] [Google Scholar]
- Berman RA, Joiner WM, Cavanaugh J, Wurtz RH. Modulation of presaccadic activity in the frontal eye field by the superior colliculus. Journal of Neurophysiology. 2009;101:2934–2942. doi: 10.1152/jn.00053.2009. [DOI] [PMC free article] [PubMed] [Google Scholar]
- Bogacz R, Brown E, Moehlis J, Holmes P, Cohen JD. The physics of optimal decision making: A formal analysis of models of performance in two-alternative forced choice tasks. Psychological Review. 2006;113:700–765. doi: 10.1037/0033-295X.113.4.700. [DOI] [PubMed] [Google Scholar]
- Boucher L, Palmeri TJ, Logan GD, Schall JD. Inhibitory control in mind and brain. Psychological Review. 2007;114:376–397. doi: 10.1037/0033-295X.114.2.376. [DOI] [PubMed] [Google Scholar]
- Carello CD, Krauzlis RJ. Manipulating intent: Evidence for a causal role of the superior colliculus in target selection. Neuron. 2004;43:575–583. doi: 10.1016/j.neuron.2004.07.026. [DOI] [PubMed] [Google Scholar]
- Churchland AK, Kiani R, Shadlen MN. Decision-making with multiple alternatives. Nature Neuroscience. 2008;11:693–702. doi: 10.1038/nn.2123. [DOI] [PMC free article] [PubMed] [Google Scholar]
- Dias EC, Segraves MA. Muscimol-induced inactivation of monkey frontal eye field: Effects on visually and memory-guided saccades. Journal of Neurophysiology. 1999;81:2191–2214. doi: 10.1152/jn.1999.81.5.2191. [DOI] [PubMed] [Google Scholar]
- Ditterich J. Stochastic models of decisions about motion direction: Behavior and physiology. Neural Networks. 2006;19:981–1012. doi: 10.1016/j.neunet.2006.05.042. [DOI] [PubMed] [Google Scholar]
- Ferraina S, Paré M, Wurtz RH. Signal transformations from cerebral cortex to superior colliculus for the generation of saccades. Vision Research. 2001;41:3399–3412. doi: 10.1016/s0042-6989(01)00066-9. [DOI] [PubMed] [Google Scholar]
- Ferraina S, Paré M, Wurtz RH. Comparison of cortico-cortical and cortico-collicular signals for the generation of saccadic eye movements. Journal of Neurophysiology. 2002;87:845–858. doi: 10.1152/jn.00317.2001. [DOI] [PubMed] [Google Scholar]
- Gold JI, Shadlen MH. Representation of a perceptual decision in developing oculomotor commands. Nature. 2000;404:390–394. doi: 10.1038/35006062. [DOI] [PubMed] [Google Scholar]
- Gold JI, Shadlen MH. Neural computations that underlie decisions about sensory stimuli. Trends in Cognitive Science. 2001;5:10–16. doi: 10.1016/s1364-6613(00)01567-9. [DOI] [PubMed] [Google Scholar]
- Gold JI, Shadlen MN. The neural basis of decision making. Annual Review of Neuroscience. 2007;30:535–574. doi: 10.1146/annurev.neuro.29.051605.113038. [DOI] [PubMed] [Google Scholar]
- Grinband J, Hirsch J, Ferrera VP. A neural representation of categorization uncertainty in the human brain. Neuron. 2006;49:757–763. doi: 10.1016/j.neuron.2006.01.032. [DOI] [PubMed] [Google Scholar]
- Hanes DP, Schall JD. Neural control of voluntary movement initiation. Science. 1996;274:427–430. doi: 10.1126/science.274.5286.427. [DOI] [PubMed] [Google Scholar]
- Hanes DP, Wurtz RH. Interaction of the frontal eye field and superior colliculus for saccade generation. Journal of Neurophysiology. 2001;87:804–858. doi: 10.1152/jn.2001.85.2.804. [DOI] [PubMed] [Google Scholar]
- Hays AV, Richmond BJ, Optican LM. WESCON Conference Proceedings. Vol. 2. El Segundo, CA: Electron Conventions; 1982. A UNIX-based multiple process system for real-time data acquisition and control; pp. 1–10. [Google Scholar]
- Helminski JO, Segraves MA. Macaque frontal eye field input to saccade related neurons in the superior colliculus. Journal of Neurophysiology. 2003;90:1046–1062. doi: 10.1152/jn.00072.2003. [DOI] [PubMed] [Google Scholar]
- Hikosaka O, Wurtz RH. Visual and oculomotor functions of monkey substantia nigra pars reticulata. IV. Relation of substantia nigra to superior colliculus. Journal of Neurophysiology. 1983;49:1285–1301. doi: 10.1152/jn.1983.49.5.1285. [DOI] [PubMed] [Google Scholar]
- Horwitz GD, Newsome WT. Target selection for saccadic eye movements: Prelude activity in the superior colliculus during a direction-discrimination task. Journal of Neurophysiology. 2001;86:2543–2558. doi: 10.1152/jn.2001.86.5.2543. [DOI] [PubMed] [Google Scholar]
- Lee P, Hall WC. An in vitro study of the horizontal connections in the intermediate layer of the superior colliculus. Journal of Neuroscience. 2006;26:4763–4768. doi: 10.1523/JNEUROSCI.0724-06.2006. [DOI] [PMC free article] [PubMed] [Google Scholar]
- Li X, Kim B, Basso MA. Transient pauses in delay-period activity of superior colliculus neurons. Journal of Neurophysiology. 2006;95:2252–2264. doi: 10.1152/jn.01000.2005. [DOI] [PubMed] [Google Scholar]
- Liu P, Basso MA. Substantia nigra stimulation influences monkey superior colliculus neuronal activity bilaterally. Journal of Neurophysiology. 2008;100:1098–1112. doi: 10.1152/jn.01043.2007. [DOI] [PMC free article] [PubMed] [Google Scholar]
- Machens CK, Romo R, Brody CD. Flexible control of mutual inhibition: A neural model of two-interval discrimination. Science. 2005;307:1121–1124. doi: 10.1126/science.1104171. [DOI] [PubMed] [Google Scholar]
- Mazurek ME, Roitman JD, Ditterich J, Shadlen MN. A role for neural integrators in perceptual decision-making. Cerebral Cortex. 2003;13:1257–1269. doi: 10.1093/cercor/bhg097. [DOI] [PubMed] [Google Scholar]
- Mazurek ME, Shadlen MN. Limits to the temporal fidelity of cortical spike rate signals. Nature Neuroscience. 2002;5:463–471. doi: 10.1038/nn836. [DOI] [PubMed] [Google Scholar]
- McPeek RM, Keller EL. Superior colliculus activity related to concurrent processing of saccade goals in a visual search task. J Neurophysiology. 2002;87:1805–1815. doi: 10.1152/jn.00501.2001. [DOI] [PubMed] [Google Scholar]
- McPeek RM, Keller EL. Deficits in saccade target selection after inactivation of superior colliculus. Nature Neuroscience. 2004;7:757–763. doi: 10.1038/nn1269. [DOI] [PubMed] [Google Scholar]
- Munoz DP, Istvan PJ. Lateral inhibitory interactions in the intermediate layers of the monkey superior colliculus. Journal of Neurophysiology. 1998;79:1193–1209. doi: 10.1152/jn.1998.79.3.1193. [DOI] [PubMed] [Google Scholar]
- Munoz DP, Wurtz RH. Saccade-related activity in monkey superior colliculus. I. Characteristics of burst and buildup cells. Journal of Neurophysiology. 1995;73:2313–2333. doi: 10.1152/jn.1995.73.6.2313. [DOI] [PubMed] [Google Scholar]
- Niwa M, Ditterich J. Perceptual decisions between multiple directions of visual motion. Journal of Neuroscience. 2008;28:4435–4445. doi: 10.1523/JNEUROSCI.5564-07.2008. [DOI] [PMC free article] [PubMed] [Google Scholar]
- Nummela SU, Krauzlis RJ. Inactivation of primate superior colliculus biases target choice for smooth pursuit, saccades, and button press responses. Journal of Neurophysiology. 2010;104:1538–1548. doi: 10.1152/jn.00406.2010. [DOI] [PMC free article] [PubMed] [Google Scholar]
- Paré M, Wurtz RH. Monkey posterior parietal cortex neurons antidromically activated from superior colliculus. Journal of Neurophysiology. 1997a;78:3493–3497. doi: 10.1152/jn.1997.78.6.3493. [DOI] [PubMed] [Google Scholar]
- Paré M, Wurtz RH. Progression in neuronal processing for saccadic eye movements from parietal cortex area LIP to superior colliculus. Journal of Neurophysiology. 1997b;82:2545–2562. doi: 10.1152/jn.2001.85.6.2545. [DOI] [PubMed] [Google Scholar]
- Philiastides MG, Ratcliff R, Sajda P. Neural representation of task difficulty and decision-making during perceptual categorization: A timing diagram. Journal of Neuroscience. 2006;26:8965–8975. doi: 10.1523/JNEUROSCI.1655-06.2006. [DOI] [PMC free article] [PubMed] [Google Scholar]
- Platt M, Glimcher PW. Neural correlates of decision variables in parietal cortex. Nature. 1999;400:233–238. doi: 10.1038/22268. [DOI] [PubMed] [Google Scholar]
- Purcell BA, Heitz RP, Cohen JY, Schall JD, Logan GD, Palmeri TJ. Neurocognitive model of perceptual decision making. Psychological Review. 2010;117:1113–1143. doi: 10.1037/a0020311. [DOI] [PMC free article] [PubMed] [Google Scholar]
- Ratcliff R. A theory of memory retrieval. Psychological Review. 1978;85:59–108. [Google Scholar]
- Ratcliff R. Modeling response signal and response time data. Cognitive Psychology. 2006;53:195–237. doi: 10.1016/j.cogpsych.2005.10.002. [DOI] [PMC free article] [PubMed] [Google Scholar]
- Ratcliff R, Cherian A, Segraves M. A comparison of macaque behavior and superior colliculus neuronal activity to predictions from models of simple two-choice decisions. Journal of Neurophysiology. 2003;90:1392–1407. doi: 10.1152/jn.01049.2002. [DOI] [PubMed] [Google Scholar]
- Ratcliff R, Hasegawa YT, Hasegawa YP, Smith PL, Segraves MA. Dual diffusion model for single-cell recording data from the superior colliculus in a brightness-discrimination task. Journal of Neurophysiology. 2007;97:1756–1774. doi: 10.1152/jn.00393.2006. [DOI] [PMC free article] [PubMed] [Google Scholar]
- Ratcliff R, McKoon G. The diffusion decision model: Theory and data for two-choice decision tasks. Neural Computation. 2008;20:873–922. doi: 10.1162/neco.2008.12-06-420. [DOI] [PMC free article] [PubMed] [Google Scholar]
- Ratcliff R, Philiastides MG, Sajda P. Quality of evidence for perceptual decision making is indexed by trial-to-trial variability of the EEG. Proceedings of the National Academy of Sciences. 2009;106:6539–6544. doi: 10.1073/pnas.0812589106. [DOI] [PMC free article] [PubMed] [Google Scholar]
- Ratcliff R, Smith PL. A comparison of sequential sampling models for two-choice reaction time. Psychological Review. 2004;111:333–367. doi: 10.1037/0033-295X.111.2.333. [DOI] [PMC free article] [PubMed] [Google Scholar]
- Ratcliff R, Van Zandt T, McKoon G. Connectionist and diffusion models of reaction time. Psychological Review. 1999;106:261–300. doi: 10.1037/0033-295x.106.2.261. [DOI] [PubMed] [Google Scholar]
- Richmond BJ, Optican LM, Podell M, Spitzer H. Temporal encoding of two-dimensional patterns by single units in primate inferior temporal cortex: I. Response characteristics. Journal of Neurophysiology. 1987;57:132–146. doi: 10.1152/jn.1987.57.1.132. [DOI] [PubMed] [Google Scholar]
- Roitman JD, Shadlen MN. Response of neurons in the lateral interparietal area during a combined visual discrimination reaction time task. Journal of Neuroscience. 2002;22:9475–9489. doi: 10.1523/JNEUROSCI.22-21-09475.2002. [DOI] [PMC free article] [PubMed] [Google Scholar]
- Schall JD. Neural correlates of decision processes: Neural and mental chronometry. Current Opinion in Neurobiology. 2003;13:182–186. doi: 10.1016/s0959-4388(03)00039-4. [DOI] [PubMed] [Google Scholar]
- Segraves MA, Goldberg ME. Functional properties of corticotectal neurons in the monkey’s frontal eye field. Journal of Neurophysiology. 1987;58:1387–1419. doi: 10.1152/jn.1987.58.6.1387. [DOI] [PubMed] [Google Scholar]
- Shadlen MN, Newsome WT. Neural basis of a perceptual decision in the parietal cortex (area LIP) of the rhesus monkey. Journal of Neurophysiology. 2001;86:1916–1935. doi: 10.1152/jn.2001.86.4.1916. [DOI] [PubMed] [Google Scholar]
- Smith PL. Stochastic dynamic models of response time and accuracy: A foundational primer. Journal of Mathematical Psychology. 2000;44:408–463. doi: 10.1006/jmps.1999.1260. [DOI] [PubMed] [Google Scholar]
- Smith PL, Ratcliff R. The psychology and neurobiology of simple decisions. Trends Neuroscience. 2004;27:161–168. doi: 10.1016/j.tins.2004.01.006. [DOI] [PubMed] [Google Scholar]
- Sommer MA, Wurtz RH. Composition and topographic organization of signals sent from the frontal eye field to the superior colliculus. Journal of Neurophysiology. 2000;83:1979–2001. doi: 10.1152/jn.2000.83.4.1979. [DOI] [PubMed] [Google Scholar]
- Takahashi M, Sugiuchi Y, Shinoda Y. Commissural mirror-symmetric excitation and reciprocal inhibition between the two superior colliculi and their roles in vertical and horizontal eye movements. Journal of Neurophysiology. 2007;98:2664–2682. doi: 10.1152/jn.00696.2007. [DOI] [PubMed] [Google Scholar]
- Usher M, McClelland JL. The time course of perceptual choice: The leaky, competing accumulator model. Psychological Review. 2001;108:550–592. doi: 10.1037/0033-295x.108.3.550. [DOI] [PubMed] [Google Scholar]
- Van Opstal AJ, Van Gisbergen JAM. A nonlinear model for collicular spatial interactions underlying the metrical properties of electrically elicited saccades. Biological Cybernetics. 1989;60:171–183. doi: 10.1007/BF00207285. [DOI] [PubMed] [Google Scholar]
- Vorberg D, Mattler U, Heinecke A, Schmidt T, Schwarzbach J. Different time courses for visual perception and action priming. Proceedings of the National Academy of Sciences. 2003;100:6275–6280. doi: 10.1073/pnas.0931489100. [DOI] [PMC free article] [PubMed] [Google Scholar]
- Wong KF, Wang XJ. A recurrent network mechanism for time integration in perceptual decisions. Journal of Neuroscience. 2006;26:1314–1328. doi: 10.1523/JNEUROSCI.3733-05.2006. [DOI] [PMC free article] [PubMed] [Google Scholar]