

Summary
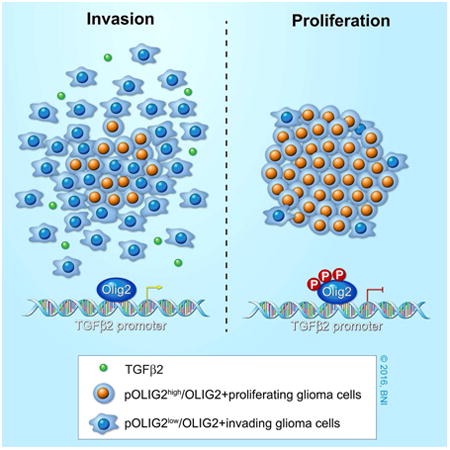
In glioblastoma, invasion and proliferation are presumed to be mutually exclusive events; however, the molecular mechanisms that mediate this switch at the cellular level remain elusive. Previously, we have shown that phospho-OLIG2, a Central Nervous System-specific transcription factor, is essential for tumor growth and proliferation. Here, we show that modulation of OLIG2 phosphorylation can trigger a switch between proliferation and invasion. Glioma cells with unphosphorylated OLIG2S10, S13, S14 are highly migratory and invasive both in vitro and in vivo. Mechanistically, unphosphorylated OLIG2 induces TGFβ2 expression and promotes invasive mesenchymal properties in glioma cells. Inhibition of TGFβ2 pathway blocks this OLIG2-dependent invasion. Furthermore, ectopic expression of phosphomimetic Olig2 is sufficient to block TGFβ2 mediated invasion and reduce expression of invasion genes (ZEB1 and CD44). Our results not only provide a mechanistic insight into how cells switch from proliferation to invasion, but also offer therapeutic opportunities for inhibiting dissemination of gliomas.
Graphical abstract
Introduction
Glioblastoma (GBM) is the most aggressive, infiltrative, and lethal brain tumor in adults, with a median survival of 9-14 months after diagnosis (Furnari et al., 2007, Maher et al., 2001, Ostrom et al., 2015). Although relatively rare, these tumors are associated with high mortality rates, mainly due to their invasive nature and resistance to radiotherapy and chemotherapy. The tumors almost always recur, and there is no standard-of-care treatment for recurrent GBM (Hess et al., 1999, Wong et al., 1999, Weller et al., 2013). One reason for tumor recurrence is the presence of highly tumorigenic and invasive cells that infiltrate the normal brain parenchyma and evade surgical resection (Giese et al., 2003). Hence, development of effective therapies for GBM requires an understanding of the mechanisms that trigger invasive phenotypes in GBM tumors.
The GBM peritumoral zone is composed of invasive cells with distinct molecular phenotypes that are highly migratory and infiltrate the healthy brain (Giese et al., 1996, Glas et al., 2010, Silver et al., 2013). Several studies have shown that cell proliferation and migration/invasion are mutually exclusive events, with proliferating cells being less motile and with rapidly moving cells proliferating slowly (Giese, 2003, Giese et al., 1996, Cayre et al., 2009). Genes involved in cell migration have been shown to be upregulated in invading cells at the tumor rim, whereas proliferation genes are downregulated (Dhruv et al., 2013, Loftus et al., 2012). This difference in gene expression suggests a possible role for transcription factors (TFs) in modulating cellular phenotype from proliferation to invasion. Several TFs (e.g., ZEB1, STAT3, C/EBPβ, and TAZ) have been shown to play a critical role in the induction of invasive mesenchymal phenotypes in GBM cells (Carro et al., 2010, Siebzehnrubl et al., 2013). Herein, we demonstrate how a central nervous system (CNS)–specific TF, OLIG2, can promote either invasion or proliferation based on its phosphorylation state.
Olig2 is a basic helix-loop-helix (bHLH) TF expressed in the multipotent neural progenitor cells in the developing brain and is required for the generation of oligodendrocytes and certain subtypes of motor neurons (Meijer et al., 2012). During CNS development, Olig2 performs two contrasting functions: early on, Olig2 sustains the replication competence of progenitor cells, whereas later, when a sufficient number of progenitor cells is reached, Olig2 is required for cell-type specification of oligodendrocytes and motor neurons (Meijer et al., 2012). In the adult brain, Olig2 is not only expressed in mature oligodendrocytes, but is also expressed in the two proliferating population of cells, namely the transit-amplifying type C cells and the NG2-positive glia (Meijer et al., 2012). A pathological correlate of this proliferative function of Olig2 is observed in high-grade gliomas. OLIG2 has been shown to be universally expressed in almost all diffuse gliomas (Ligon et al., 2004, Lu et al., 2001). Apart from marking glioma cells, Olig2 expression is required for glioma growth, which has been demonstrated both in a genetically relevant murine model and in orthotopic patient-derived xenograft models (Ligon et al., 2007, Mehta et al., 2011). Recently, OLIG2 was shown to be a key TF required to reprogram differentiated glioma cells into highly tumorigenic glioma stem-like cells (GSCs) (Suva et al., 2014).
Olig2 is phosphorylated at the triple serine motif (S10, S13, and S14) near the amino terminus (pOlig2) (Sun et al., 2011). The phosphorylation at these sites is developmentally regulated and present in cycling neural progenitor cells, but not in mature oligodendrocytes (Sun et al., 2011). Most GSCs express pOLIG2 at levels similar to those of cycling progenitor cells. Expression of a triple phosphomimetic (TPM) mutant of Olig2 leads to faster tumor growth than expression of a triple phosphonull (TPN) mutant in a genetically relevant murine glioma model. TPN-expressing cells were able to form tumors, albeit with longer latency (Sun et al., 2011).
Recent studies have shown that Olig2 might play a role in promoting migration/invasion in normal oligodendrocyte precursor cells (OPCs) as well as in GSCs (Hornig et al., 2013, Nevo et al., 2014). In addition, recent findings suggest that both contrast-enhancing GBM tumor core, as well as non-enhancing tumor margins, express high levels of Olig2 (Venere et al., 2015). An important question that then arises is how a single TF such as OLIG2 regulate these distinct transcriptional programs of proliferation and invasion. In this study, we demonstrate how the N-terminal phosphorylation of OLIG2 can regulate cell invasion through its transcriptional regulation of the TGFβ2 pathway. We show that cells expressing unphosphorylated Olig2S10, 13, 14 or low levels of pOLIG2 (pOLIG2low) are highly invasive. Furthermore, we find that inhibition of the TGFβ2 pathway suppresses OLIG2-mediated invasion.
Results
Olig2 Is Required for Migration/Invasion of Both Normal Neural Stem Cells and Glioma Stem-Like Cells
To interrogate the role of Olig2 in promoting cell migration/invasion, we compared murine Olig2-ko (Olig2-knockout) and Olig2-wt (Olig2-wild type) using an in vitro migration assay. We utilized previously characterized murine glioma stem-like cells (mGSCs) (Ink4a/Arf-/-hEGFRvIII) and normal murine neural stem cells (mNSCs) (Ligon et al., 2007). Both mNSCs and mGSCs expressing wild-type Olig2 showed increased capacity of migration compared to cells without Olig2 (Olig2-ko) (Figures 1A and 1B). There was no significant difference in cell viability or substrate attachment between Olig2-wt and Olig2-ko mNSCs and mGSCs in samples collected 2 hr post plating (Figure S1A). However, after 24 hrs Olig2-wt cells proliferate at slightly higher (but significant) efficiency compared to Olig2-ko cells (Figure S1B). We next assessed whether Olig2 expression is also required for cell invasion through a 3-dimensional (3D) Matrigel matrix. As shown in Figures 1C and 1D, under both normal and oncogenic backgrounds, Olig2-wt cells have significantly higher capability to invade through a 3D matrix than Olig2-ko cells. It is known that the absence of Olig2 produces a small but significant effect on the proliferation rate of normal and oncogenic neurospheres (Ligon et al., 2007). Thus, the question is whether the increase in cell invasion is due to increased proliferation of Olig2-wt cells. However, considering the fact that Olig2-wt and Olig2-ko have doubling times of 33 and 43 hours (Ligon et al., 2007), respectively, it is highly unlikely that the increased invasion observed after 24 hours is solely due to higher proliferation rates
Figure 1. Phosphorylation status of Olig2 affects invasion/migration of mNSCs and mGSCs.
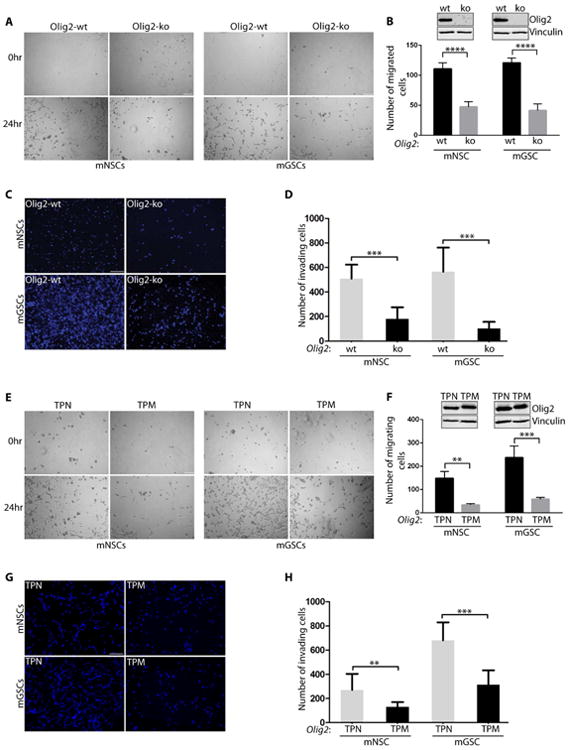
(A-D): Olig2-wt mNSCs and mGSCs are more migratory and invasive than Olig2-ko cells. Representative images of the central zone where cells migrate at 0 hr and 24 hr (A) and quantification of total number of migrated cells at 24 hr (B) Inset shows western blot data for Olig2 and Vinculin. Representative images from transwell assays of mNSCs and mGSCs with or without Olig2 after 24 hr post-seeding (C) and quantification of total number of DAPI stained nuclei (D). (E-H): In vitro migration/invasion assays in mNSC and mGSC expressing Olig2 phosphomutants. mNSC or mGSC expressing TPN mutant shows increased migration (E-F) and invasion (G-H) compared to the TPM expressing cells. Scale bars = 100 μm. Inset in F shows western blot probed for Olig2 and Vinculin. For all bar graphs the data represent mean ± SD of three independent experiments. *p < 0.05; **p < 0.01; ***p < 0.001. See also Fig. S1.
N-terminal Phosphorylation of Olig2 at Triple Serine Motif Affects Migration/Invasion of mNSCs and mGSCs
We used previously established Olig2-TPM and TPN mutant expressing cell lines to examine the effect of Olig2 phosphorylation on the ability of mNSCs and mGSCs to migrate/invade (Sun et al., 2011). We found that highly proliferative TPM-expressing murine cells migrate and invade significantly slower than TPN-expressing cells (Figures 1E-1H). Control experiments confirmed that the differences in migration and invasion between TPM and TPN mutants are independent of cell viability or loss of attachment (Figure S1C and S1D). As previously observed (Sun et al., 2011), there were significantly more TPM cells after 24 hrs of seeding than TPN cells. These data demonstrate that both mNSCs and mGSCs expressing unphosphorylated form of Olig2 have increased migration/invasion ability in vitro.
Phosphorylation Level of OLIG2 at Triple Serine Motif Dictates Migration/Invasion Ability of Human GSCs
Our previous studies show that OLIG2 is phosphorylated at the N-terminus in most proliferating GBM cells grown in presence of growth factors (Sun et al., 2011). However, the phosphorylation levels vary significantly among various human patient-derived GBM GSCs (hGSCs), as seen previously (Sun et al., 2011), and from the pOLIG2/total OLIG2 (tOLIG2) levels across six hGSC lines used in this study (Figures 2A and S2A, Table S1). As shown in Figure 2B and 2C, phosphorylation levels of OLIG2 affect the migration/invasion capacity of multiple hGSCs. There is a significant difference in the number of migrating hGSCs with pOLIG2high (BT145 and GB7, labelled in blue) than hGSCs with pOLIG2low (BT147, GB3, GB16 and GB42). We observed similar differences between hGSCs in their ability to invade the 3D matrix (Figures 2D and 2E). As expected, hGSCs with pOLIG2high were more proliferative than pOLIG2low and no difference was observed in substrate attachment and cell viability (Figure S2B and S2C).
Figure 2. N-terminal phosphorylation of OLIG2 affects invasion/migration in hGSCs.
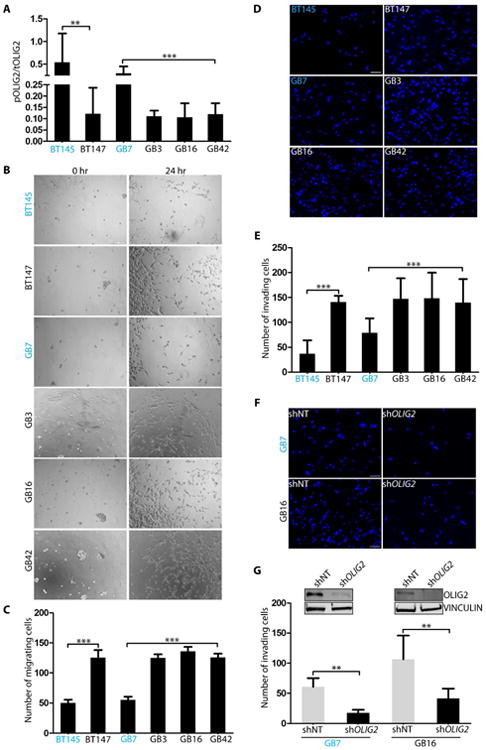
Indicated hGSC cell lysates were analyzed for the ratio of pOLIG2 over tOLIG2 by immunoblotting with pOLIG2, OLIG2, and VINCULIN antibodies (A). pOLIG2high hGSCs are labelled in blue. (B-E): In vitro cell migration assays show that cell lines with pOLIG2low (BT147, GB3, GB16 and GB42) are more migratory (B-C) and invasive (D-E) compared to cell lines with pOLIG2high (BT145 and GB7). (F-G): Knockdown of OLIG2 reduces glioma cell invasion. Invasion assay was performed 72 hours post transduction of GB7 and GB16 cells with either control non-target hairpin (shNT) or shOlig2-expressing lentivirus (F). Quantification of total number of invading cells after knockdown of OLIG2 (G). Western blot analysis after OLIG2 knockdown in GB7 and GB16 cells (G inset). Scale bars = 100 μm (B) and 50 μm (D and F). For all bar graphs the data represent mean ± SD of three independent experiments.*p < 0.05; **p < 0.01; ***p < 0.001. See also Fig. S2.
To determine whether increased invasion in hGSCs is dependent on OLIG2 expression, we transduced three hGSCs (GB7, GB16, and BT147) with either a control non-target short hairpin RNA (shNT) or shOLIG2. Knockdown of OLIG2 significantly decreased the ability of all three hGSCs to invade (Figures 2F, 2G and S2D). Knockdown with a second hairpin targeting different region of OLIG2 ORF confirmed that the decrease in invasion was not an off-target effect (Figure S2E). Thus, it can be concluded that OLIG2 expression promotes cell migration/invasion in hGSCs and that the phosphorylation status of OLIG2 is critical in determining their invasive properties in vitro.
OLIG2 Protein Is Found at Both the Proliferative Tumor Core and the Infiltrative Rim
We compared the peritumoral rims in tumors induced by TPN- and TPM-expressing mGSCs to assess whether unphosphorylated Olig2 expression promotes invasion in vivo. As indicated in Figures 3A-3B and S3A-S3D, TPN cells could be detected in the normal brain regions distal from the tumor core whereas TPM cells showed restricted invasion of the brain parenchyma. Quantification of the number of cells that invaded into the adjacent areas e.g., the tumor rim, ventricles, the white matter tracts, and the dentate gyrus (DG) region, clearly demonstrated the invasive nature of TPN cells (Figure 3C). In addition, TPN cells showed strong expression of Snail/Slug (EMT marker) compared to TPM-induced tumors (Figure S3E).
Figure 3. Cells expressing unphosphorylated Olig2/pOLIG2low are invasive.
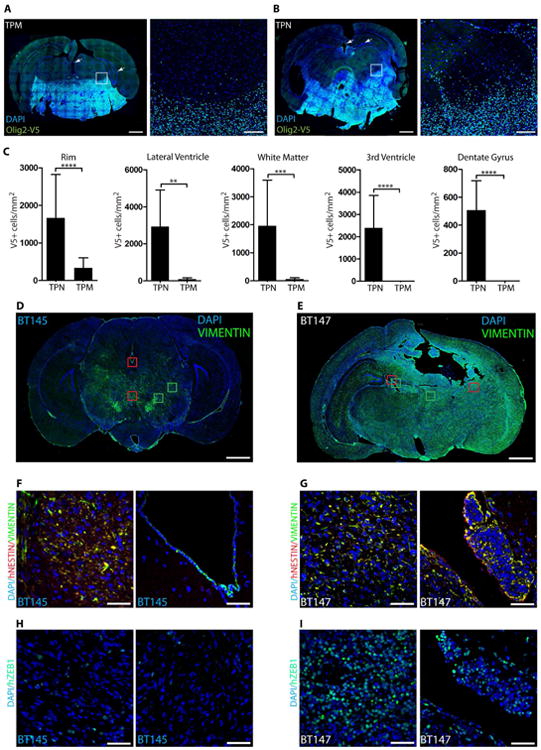
(A-B): mGSCs expressing TPN mutant form highly infiltrative tumors compared to TPM-expressing mGSCs. Immunostaining for V5 epitope tag (green) in murine TPM-expressing tumors (DAPI - blue) (A). TPN-expressing tumors show infiltration of normal brain parenchyma, the ventricular and hippocampal area (arrows) (B). Scale bars = 1mm and 100 μm. Quantification of invading tumor cells at the peritumoral rim (the area comprised in white boxes in A and B), ventricular areas, white matter tracts, and dentate gyrus regions (C) (arrows). Tumors induced by hGSCs with pOLIG2high (BT145) are less invasive compared to pOLIG2low (BT147) (D-I). Immunostaining with anti-VIMENTIN (green) in human GBM xenograft tissues derived from BT145 (D) or BT147 (E) (DAPI - blue). Scale bars = 1mm. Tracking tumor cells with human-specific NESTIN in PDX tissues (F and G). Images of hNESTIN (red) and VIMENTIN (green) immunostaining in BT145 tumor tissue (zoom-in images of red boxed regions from D) (F). Images of hNESTIN immunostaining in BT147 tumor tissue (zoom-in of red boxed regions from E) (G) (DAPI - blue). Immunostaining with anti-hZEB1 in BT145 (H) and BT147 (I) tissues (zoom-in images of green boxed regions from D and E). For all bar graphs, data represent mean ± SD of three independent experiments.*p < 0.05; **p < 0.01; ***p < 0.001. See also Fig. S3.
In order to further strengthen our observations with genetically defined murine glioma models and Olig2 phosphomutants, we compared patient-derived xenograft (PDX) tissues from the hGSC lines BT147 (pOLIG2low) and BT145 (pOLIG2high) and probed with the stem cell marker VIMENTIN (VIM) to track hGSCs. Immunostaining of the BT147 xenograft revealed extensive infiltration of tumor cells throughout the brain parenchyma while BT145 cells were comparatively more localized (Figure 3D and 3E). To confirm that the VIM+ cells were indeed tumor cells, we co-stained with a human-specific NESTIN antibody which colocalized with VIM in both BT147 and BT145 tumors except in the ventricular regions of BT145 tumor (Figure 3F-3G). VIM+ and NESTIN+ BT147 cells were detected within the DG area as well (Figure S3F). Furthermore, we saw strong ZEB1 expression in the invasive BT147 xenograft, including the ventricular and DG areas (Figure 3H-3I and S3G), but only few ZEB1+ cells were seen in BT145 tumor tissue.
To further examine differences in tumor cell dispersion between pOLIG2high and pOLIG2low hGSCs, we examined brain tissues from GB3, BT145 and GB16 PDXs at an early time point (3 weeks) post-implantation. The pOLIG2low lines GB3 and GB16 cells were seen to migrate significantly further from the graft site, mostly along white matter tracts, compared to pOLIG2high BT145 cells, which were restricted to the site of injection (Figure 4A – 4E, Figure S4A). These data strongly support our claim that pOLIG2low hGSCs are highly invasive both in vitro and in vivo.
Figure 4. GBM cells expressing unphosphorylated OLIG2 (or pOLIG2 low) are infiltrative and are found at the tumor core and rim.
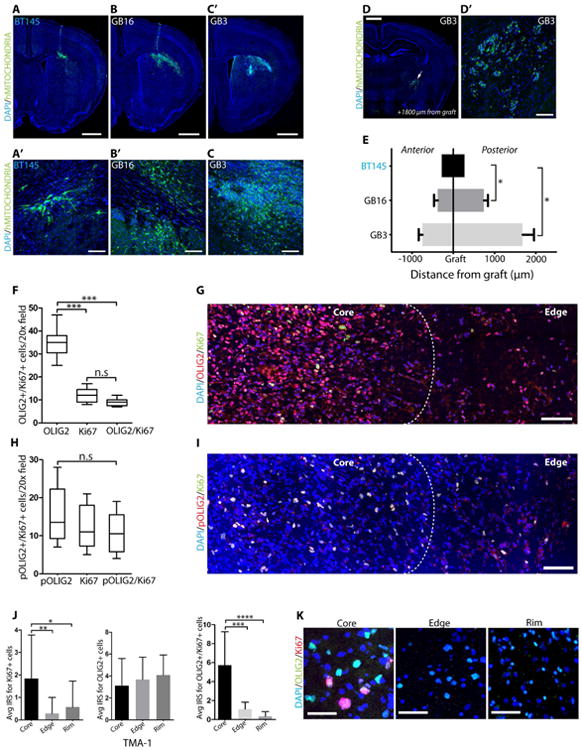
Analysis of tumor cell invasion in GBM xenograft models (GB3, GB16 and BT145) three weeks post-implantation (A-F). Immunostaining of tumor tissue with human-specific mitochondrial antibody (green) in GB3 (A and A′), GB16 (B and B′), and BT145 (C and C′). Scale bars = 1mm and 50μm. Immunodetection of GB3 tumor cells away from injection site within the white matter tracts (D and D′). Scale bars = 1mm and 100μm. Distance travelled by tumor cells from the graft site to the anterior or posterior regions (N=3 for each group) (E). OLIG2+ cells are found throughout the tumor tissue. Quantification (F) and immunodetection (G) of OLIG2+ (red) and Ki67+ (green) cells (both single and double labelled cells) in GBM patient tissue section. Proliferating cells in human GBM tissue express pOLIG2. Quantification (H) and immunostaining (I) with pOLIG2 (red) and Ki67 (green) antibodies (both single and double labelled cells) in GBM patient tissue sections. (DAPI - blue). G and I images are representative of 5 GBM cases. For F and H, total number of cells from 5 individual fields per patient tumor tissue section were counted. Scale bars = 100μm Analysis of glioma invasion TMA immunostained with OLIG2 and Ki67 antibodies. (J) Immune Reactivity Score (IRS) quantification of OLIG2+ and Ki67+ cells across 33 patient tumor core, edge, and rim in GBM patient TMA (both individual and coexpressing cells). (K) Representative images of OLIG2 (green) and Ki6 (red) staining from core, edge and rim in TMA sections. Scale bar = 50 μm. For all bar graphs, data represent mean ± SD from multiple experiments.*p < 0.05; **p < 0.01; ***p < 0.001. See also Fig. S4.
To analyze the localization of phosphorylated and total OLIG2 within human GBM specimens, we stained fresh frozen tissue sections from multiple GBM patients for pOLIG2, tOLIG2, and Ki67. As previously reported, we found that almost all Ki67+ cells are OLIG2+; however, a larger percentage (∼70%) of OLIG2+ cells do not express Ki67 (Figures 4F and 4G) (Ligon et al., 2004, Ligon et al., 2007). Using our highly specific pOLIG2 antibody, we found that pOLIG2 co-localizes with the proliferative marker Ki67 in ∼90% of cells (Figures 4H and 4I), confirming our previous observations (Ligon et al., 2007, Sun et al., 2011). Within multiple GBM tissues, we found a decreasing gradient of pOLIG2+ cells from the tumor core to the invasive edge (Figure 4I and Figure S4B-S4D). These data support our hypothesis that proliferating cells express pOLIG2, while invading cells express unphosphorylated OLIG2.
To assess the distribution of OLIG2+ and pOLIG2+ cells within GBM tumors, we probed a GBM tissue microarray (TMA) comprising 33 matched GBM tumor core, edge, and rim tissues (Kislin et al., 2009). Since our pOLIG2 antibody does not work on paraffin-embedded tissues (and there is ∼90% colocalization between pOLIG2 and Ki67),, we utilized Ki67 staining as a surrogate for pOLIG2 staining on paraffin-embedded tissues. In vast majority of GBM tissues, OLIG2+ cells were detected at the tumor core, edge and at the infiltrative tumor rim, whereas Ki67+ (pOLIG2) cells are found predominantly at the tumor core (Figures 4J and 4K). These data strongly suggest that Ki67+ (pOLIG2+) proliferating cells are mainly present at the tumor core, whereas unphosphorylated OLIG2-expressing cells are present throughout the tumor.
OLIG2 Phosphorylation Regulates Expression of Invasion Genes
Since OLIG2 is a TF, we investigated the effect of OLIG2 phosphorylation on genes involved in invasion, cell cycle regulation, and proliferation. We performed qRT-PCR analysis of invasion-related markers enriched for genes associated with an epithelial-to-mesenchymal transition (EMT) (e.g., TWIST1, CD44, TGFβ2, CREB1, and ZEB1) (Kalluri and Weinberg, 2009, Polyak and Weinberg, 2009) in mGSCs and hGSCs. Interestingly, we found that invasion genes are upregulated in TPN-expressing mGSCs compared to TPM-expressing cells. Expression of Tgfβ2, Zeb1, and Cd44 was upregulated in TPN-expressing mGSCs, while proliferation markers (Egfr and Cdk6) were highly expressed in TPM-expressing cells (Figures S5A and S5B). We next examined whether this observation also holds true in hGSCs, and if it is dependent on OLIG2 phosphorylation status. qRT-PCR analysis showed a robust transcriptional upregulation of invasion genes in hGSCs with pOLIG2low (BT147 and GB16) compared to hGSCs with pOLIG2high (BT145 and GB7) (Figures 5A and 5B). In contrast, proliferation and cell cycle associated genes are upregulated in pOLIG2high hGSCs (Figures S5C and S5D). To further confirm that OLIG2 regulates the expression of invasion genes, we ablated OLIG2 expression in BT147, GB16, and GB7 cells. shRNA-mediated knockdown of OLIG2 led to a significant decrease in the expression of invasion genes in all three hGSCs, suggesting that OLIG2 is required for the regulation of expression of these genes in hGSCs (Figures 5C, 5D, and S5E). Previous studies have shown that ZEB1 regulates OLIG2 expression. Our data demonstrates a reciprocal regulation of ZEB1 by OLIG2. Analysis of published ChIP-seq data (Suva et al., 2014) showed that OLIG2 associated with an enhancer region of the ZEB1 gene, which is also enriched for H3K27ac mark. Directed ChIP analysis in GB16 line (pOLIG2low) confirmed that OLIG2 associated with the ZEB1 enhancer region and that the region is also marked by H3K27ac (Figure S5F). Furthermore, ZEB1 expression is dramatically reduced after knockdown of OLIG2 in two hGSCs (GB3 and GB16) (Figure S5G). Collectively, these data show that unphosphorylated, or pOLIG2low, induces expression of migration/invasion genes.
Figure 5. OLIG2 phosphorylation-dependent regulation of invasion markers in human GSCs.
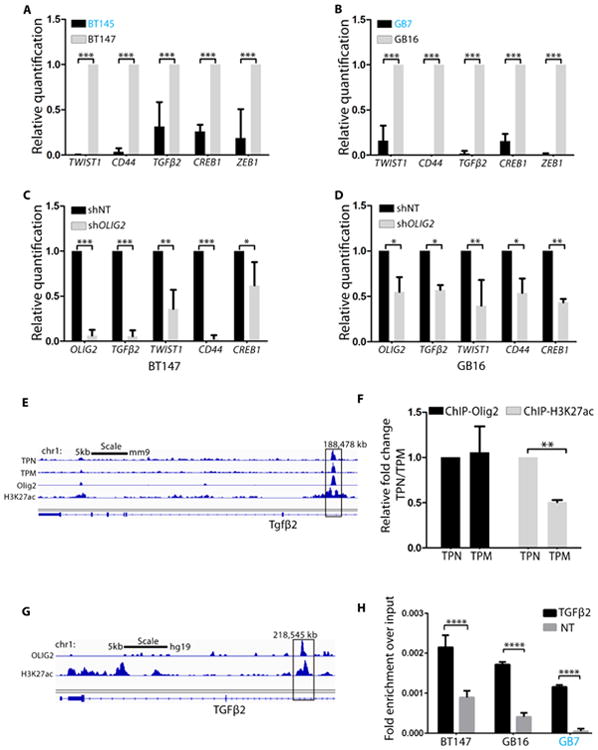
(A-B): qRT-PCR analysis of invasion genes in hGSCs with pOLIG2high (BT145 and GB7) as compared to hGSCs with pOLIG2low (BT147 and GB16). (C and D) qRT-PCR in BT147 and GB16 cells transduced with either control (shNT) or shOLIG2-expressing lentivirus. (E) ChIP-seq tracks show TPN, TPM, Olig2 and H3K27ac signals at Tgfβ2 loci (Mateo et al., 2015). (F) Directed ChIP assay with anti-Olig2 and anti-H3K27ac to assess binding to Tgfβ2 enhancer region in TPM- and TPN-expressing cells. Bar graph represents fold change of TPM over TPN. (G) ChIP-seq tracks from (Suva et al., 2014) show Olig2 and H3K27ac signals at TGFβ2 loci. (H) Directed ChIP assay for OLIG2 binding to TGFβ2 enhancer region in represented hGSCs as compared to non-target site (NT). Bar graphs represent fold enrichment of OLIG2 over non-target (NT). For A-D, F and H the data represent mean ± SEM of three independent experiments. *p < 0.05; **p < 0.01; ***p < 0.001. See also Fig. S5.
OLIG2 Promotes Invasion by Upregulating TGFβ2 Expression
To scrutinize the downstream mechanisms through which OLIG2 governs invasion, we focused our attention on TGFβ2 for two reasons: Tgfβ2 is a direct genetic target of Olig2 in normal neural progenitor cells (Meijer et al., 2014) and the TGFβ pathway plays an important role in invasion of tumor cells in several solid cancers, including GBM (Anido et al., 2010, Rich, 2003, Weller et al., 2001, Wick et al., 2001). Analysis of ChIP-seq tracks from Meijer et al demonstrated that both phosphorylated and unphosphorylated forms of Olig2 associate with the Tgfβ2 locus (Figures 5E and 5F) and regulate its expression in normal neural progenitor cells (Meijer et al., 2014). ChIP assay with Olig2 and H3K27ac antibodies confirmed association of both TPM and TPN mutants with Tgfβ2 enhancer region in mGSCs (Figure 5F) and we found significant enrichment of the active enhancer histone mark (H3K27ac) at the Tgfβ2 locus (ChIP-seq track for H3K27ac from (Mateo et al., 2015)) in TPN cells compared to that in TPM cells (Figures 5E and 5F).
We confirmed that TGFβ2 is also a direct target of OLIG2 in hGSCs by performing chromatin immunoprecipitation (ChIP) assay in hGSCs. OLIG2 associated with TGFβ2 locus in hGSCs within a region that has been shown to be enriched for H3K27ac marks (Suva et al., 2014) (Figures 5G and 5H). We performed ELISA and TGFβ growth inhibition assay and found that pOLIG2low hGSCs and TPN-expressing murine cells express high levels of TGFβ2 (Figures S6A and S6B). Using TGFβ sensitive CCL64 cells we observed significant growth inhibition after incubation with supernatants from pOLIG2low hGSCs or TPN-expressing cells (Figures S6C and S6D) compared to media alone or pOLIG2high and TPM-expressing cells. Pre-incubation of the supernatant with TGFβ2 antibody decreased growth inhibition. These data suggest that Tgfβ2 expression is upregulated in presence of unphosphorylated Olig2.
We confirmed that the increase in TGFβ2 levels translates to an increase in downstream TGFβ2 signaling. TGFβ2 ligand associates with TGFβ type I/II receptors and triggers phosphorylation of SMAD2/3 proteins. Phosphorylated SMAD2/3 (pSMAD2/3) then associates with SMAD4 to form a co-regulatory complex to activate downstream genetic targets (Schmierer and Hill, 2007). We did not detect any difference in TGFβ type I/II receptor expression between pOLIG2high and pOLIG2low lines (Figure S6E). However, we did detect high levels of pSMAD2 expression in oncogenic TPN-induced tumor tissues compared to TPM-induced tumors (Figures 6A and 6B). The correlation between pSMAD2 levels and OLIG2 phosphorylation status in human tumors was confirmed by staining of GB7 and GB16 patient tissues with pSMAD2 and Ki67 antibodies. GB16 tissue showed high levels of pSMAD2 compared to GB7 tissue (Figure S6F). We confirmed this pattern by immunostaining of concomitant sections from another fresh frozen human GBM tissue with pSMAD2/Ki67 and pSMAD2/OLIG2 antibodies (Figure 6C). We found very little overlap in pSMAD2 and Ki67 staining; however, most OLIG2+ cells were pSMAD2+. Furthermore, we found that hGSCs with pOLIG2low (GB16 and GB42) had higher levels of pSMAD2 compared to the hGSC with pOLIG2high (GB7) (Figure 6D). Ablation of OLIG2 (shOLIG2) in GB16 resulted in a decrease in the levels of pSMAD2 (Figure 6E). Next, we probed the TMA with pSMAD2/Ki67 antibodies to assess its localization within the tumor. Similar to OLIG2+ cells (Figure 3), pSMAD2+ cells were found at the tumor core, edge, and rim regions (Figures 6F-6H). We observed no colocalization between pSMAD2 and Ki67. We also immunostained the TMA with OLIG2 and pSMAD2 and found that OLIG2+ and pSMAD2+ cells were present throughout the tumor (Figure S6G).
Figure 6. SMAD2 phosphorylation is inversely correlated with high expression of pOLIG2.
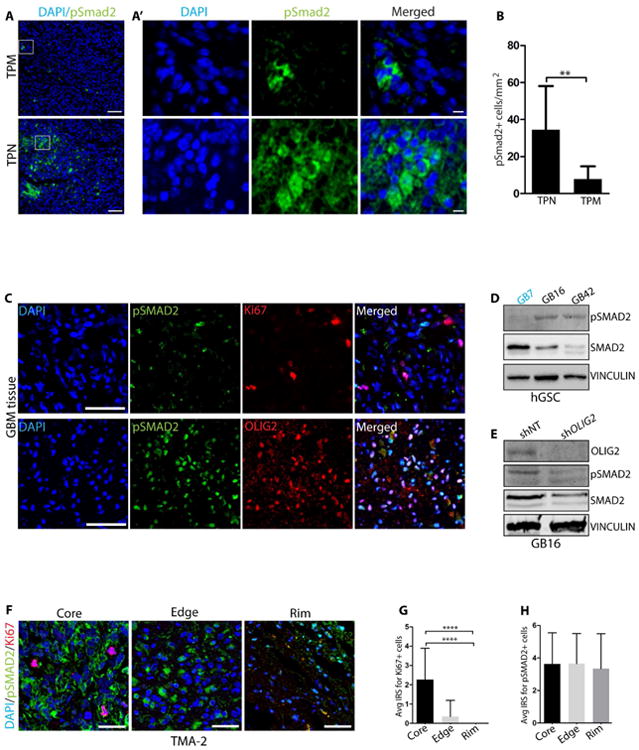
(A) Immunodetection of pSmad2 (green) in orthotopic tumors induced by mGSCs expressing TPM (upper panel) or TPN (lower panel) mutant. (A′) Right sub-panels show higher magnification images in the boxed area from A. (B) Quantification of pSmad2+ cells in TPN and TPM tumor tissues (cells from 5 independent fields from three tumor tissues each were counted). (C) Representative images from immunostaining of consecutive patient GBM tissue sections with pSMAD2 (green)/Ki67 (red) and pSMAD2 (green)/OLIG2 (red) antibodies. DAPI staining in blue. (D) Western blot analysis of indicated hGSC lysates for pSMAD2 expression. (E) Western blot analysis for OLIG2, pSMAD2, and SMAD2 after transduction with shNT or shOLIG2 lentivirus in GB16 cells. (F) Representative images of Ki67 and pSMAD2 immunostaining at core, edge and rim regions in TMA-2. IRS quantification of Ki67+ (red) (G) and pSMAD2+ (green) (H) cells at core, edge and rim regions (see methods for details). DAPI is in blue. Scale bars = 50 μm (A), 5 μm (A′) 100 μm (C) and 50 μm (F). For bar graphs B, G and H, data represent mean ± SEM. *p < 0.05; **p < 0.01; ***p < 0.001. See also Fig. S6.
In breast cancer, TGFβ has been shown to increase the population of cells expressing CD44, a marker known to be upregulated upon induction of EMT (Gupta et al., 2009, Mani et al., 2008). Recent studies demonstrated that in GBM, TGFβ regulates CD44 expression through induction of ID1 (inhibitor of DNA binding 1 protein) (Anido et al., 2010). We found that an OLIG2-mediated increase in TGFβ2 expression also correlates with increased CD44 levels. We probed for CD44 levels in the hGSC line with pOLIG2high levels (GB7) and in two hGSC lines with pOLIG2low (GB16 and GB42). Both highly invasive GB16 and GB42 lines have significantly higher levels of CD44 as compared to the less invasive GB7 line. Furthermore, we sorted for CD44high and CD44low populations by fluorescence-activated cell-sorting from the GB42 GSC line and performed qRT-PCR for migration/invasion genes (Figure S6H). We found that the CD44high population expressed high levels of migration/invasion genes, including TGFβ2, ZEB1, and VIM, as well as OLIG2, in contrast to the CD44low population (Figure S6I).
Modulating TGFβ2 Levels Alters OLIG2-mediated Glioma Invasion
To determine whether TGFβ2 is the downstream effector of OLIG2-mediated invasion in hGSCs with pOLIG2low, we treated hGSCs (GB7 and GB16) with TGFβ Receptor 1/2 inhibitor (TβRI) (LY2109761) for 8 hours. In parallel experiments, we supplemented the media with TGFβ2. The number of invading GB7 cells increased significantly in presence of TGFβ2, a phenotype not seen in GB16 cells (Figures 7A, 7B, S7A and S7B). Upon inhibitor treatment, there was a significant decrease in invasion in GB16 hGSC line, however, the TβRI only had a minor effect on the less invasive cell line (GB7) (Figures 7A, 7B, S7A and S7B). The concentration and duration of TβRI treatment and TGFβ2 addition were sufficient to affect TGFβ signaling, as seen by changes in pSMAD2/3 levels and by expression of invasion genes (Figures S7C and S7D). This effect was not due to a decrease in cell viability upon TβRI treatment (Figure S7E). It is intriguing that we did not see an increase in invasion of GB16 in the presence of external TGFβ2. It is possible that either the TGFβ2 signaling has reached its threshold, or GB16 invasion is independent of SMAD2 activation. To further confirm a direct role of secreted TGFβ2, we pretreated pOLIG2high hGSCs (GB7 and BT145) with conditioned media from invasive hGSC lines (GB16 and BT147) that have high levels of TGFβ2. As expected, the number of cells invading through Matrigel increased when grown in the presence of conditioned media from GB16 and BT147 (Figures 7C, 7D, S7F and S7G). To confirm that the increased invasion was due to secreted TGFβ2 in the conditioned media, we performed migration assay with cells that were pretreated with both GB16 and BT147-conditioned media and TβRI. GB7 and BT145 cells failed to respond to conditioned media and displayed a significant decrease in invasion in the presence of the TβRI (Figures 7C, 7D, S7F and S7G). These data suggest that TGFβ2 is a downstream target of OLIG2 and that inhibition of the TGFβ pathway blocks OLIG2-mediated invasion.
Figure 7. OLIG2 promotes glioma invasion via TGFβ2 pathway.
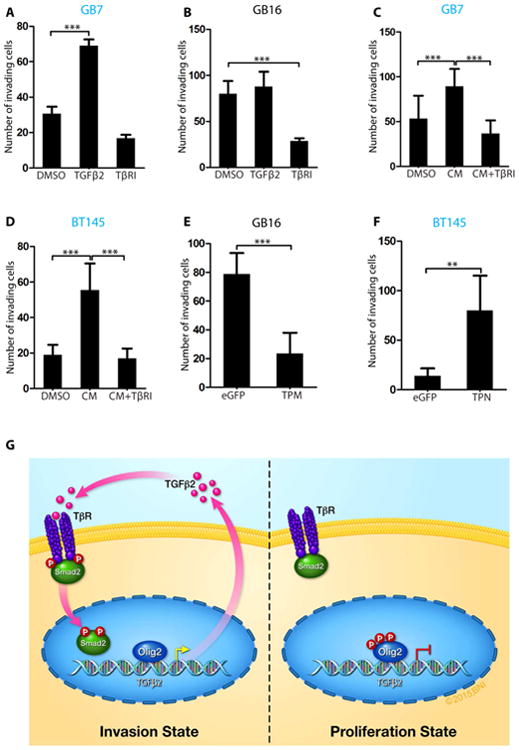
(A) Number of invading cells showing increased invasion following TGFβ2 addition or reduced invasion following TβRI treatment in less invasive GB7 cells. (B) Quantification showing reduced invasion following TβRI treatment in GB16 cells. (C and D) Increase in invading GB7 and BT145 cells in the presence of conditioned media from invasive GB16 and BT147 cells. Addition of TβRI to conditioned media reduces invasion. (E) GB16 cells show impaired invasion when transduced with TPM expressing lentivirus compared to control eGFP virus. (F) BT145 cells showed significant increase in invasion when transduced with TPN-expressing lentivirus compared to eGFP control virus. (G) Model of Olig2 phosphorylation dependent glioma invasion. Our results suggest that when OLIG2 is phosphorylated at the N-terminus, TGFβ2 levels are low and hence there is no phosphorylation of SMAD2. Unphosphorylated OLIG2 triggers expression of TGFβ2, which then associates with TGFβR1/2 resulting in phosphorylation and nuclear localization of SMAD2 and eventual increase in invasion. For all graphs, data represent mean ± SD of three independent experiments. *p < 0.05; **p < 0.01; ***p < 0.001). See also Fig. S7.
We tested whether OLIG2 phosphorylation/dephosphorylation is required for invasion by overexpressing TPM mutant of Olig2 in the invasive GB16 cells and TPN mutant in the less invasive BT145 cells. Increased expression of TPM mutant in GB16 led to a dramatic decrease in the rate of invasion through Matrigel and decreased the expression of invasion markers (Figures 7E, S7H and S7J). Conversely, overexpression of the TPN form of Olig2 in BT145 led to increased invasion as well as expression of invasion markers (Figures 7F, S7I and S7K).
Discussion
One of the hallmark features of glioblastoma is infiltration of normal brain regions. These invasive glioma cells are the primary cause for tumor recurrence and poor prognosis in GBM patients. Understanding the molecular mechanisms and signaling pathways that trigger the invasive phenotype is critical for the development of effective treatment of GBM. Our findings provide insight into how the post-translational modification of a single TF could possibly mediate the switch between proliferative and invasive phenotypes. We show that the phosphorylation status of the CNS-specific factor OLIG2 regulates glioma cell proliferation and invasion. Specifically, we discovered that unphosphorylated OLIG2 promotes glioma invasion through the TGFβ2 signaling pathway.
Olig2 expression has been previously linked to migration/invasion both in normal and malignant cells (Hornig et al., 2013, Nevo et al., 2014, Siebzehnrubl et al., 2013). However, our report demonstrates that the phosphorylation status of OLIG2 regulates the switch from proliferation to invasion (Figure 7G). Recently, two studies have reported the role of OLIG2 in glioma invasion. Siebzehnrubl and colleagues identified ZEB1 as a key regulator of GBM invasion and stemness (Siebzehnrubl et al., 2013). These authors showed that ZEB1 upregulates expression of both, EMT genes as well as critical GSC markers like SOX2 and OLIG2. Consistent with their observation, we found that mGSCs expressing TPN and hGSCs expressing pOLIG2low have high levels of invasion genes, including ZEB1 (Figures 5 and S5). Furthermore, our findings demonstrate that ZEB1 is a direct genetic target of OLIG2, suggesting a cross-regulatory loop wherein unphosphorylated OLIG2 leads to increase in ZEB1, which in turn upregulates OLIG2 expression.
Another study identified OLIG2 as one of the genes highly expressed within the tumor cells in the invasive niche but not at the tumor core (Nevo et al., 2014). The authors found that in a single patient matched tumor core vs rim, OLIG2 protein is predominantly found at the tumor rim. In contrast, previous reports (Venere et al., 2015), and our analysis of multiple human GBM fresh frozen sections and GBM invasion TMA (containing 33 matched core, edge and rim tumor tissues), reveals that OLIG2 expressing cells are found both at the tumor core and at the peritumoral rim (∼70% of tumors show strong signal for OLIG2 at the core, edge, and rim) (Figure 4). It is plausible that the presence of OLIG2+ cells at the tumor core and rim depends on the tumor location, as well as the molecular subtype of the tumor. However, our analysis of more than 33 human GBM tumors, and observations made by other laboratories (Venere et al., 2015), suggest that OLIG2-expressing cells are present throughout the tumor. In accord with our observations, Nevo et al demonstrated that the knockdown of OLIG2 leads to a decrease in expression of EMT gene, TWIST1.
The main question our data addresses is how OLIG2 can promote both proliferation and invasion. With the use of TPM and TPN mutants we demonstrate that phosphorylation of N-terminal serines in Olig2 decreases migration/invasion, both in normal and malignant neural progenitors, in vitro and in vivo (Figures 1-3). Our genetically relevant murine glioma model allows us to dissect the role of Olig2 phosphorylation in glioma invasion without the compounding effect of human genetic and epigenetic heterogeneity in GBM. We have previously shown that TPM-expressing glioma cells are highly proliferative and tumorigenic and can form tumors even upon injection of 100 cells (Sun et al., 2011). Here we provide evidence for a role of unphosphorylated Olig2 in promoting tumor invasion. TPN-expressing cells form highly invasive tumors, wherein tumor cells show extensive infiltration of normal brain at distant sites (Figures 3 and S3).This is not observed in TPM-induced tumors. The only difference between these tumors is the phosphorylation status of Olig2. Xenografts of hGSCs with low levels of OLIG2 phosphorylation confirm our observations with the murine glioma model. Based on our in vivo PDX data and analysis of TMA, it seems likely that either of these two scenarios or a combination of the two exists: i) distinct populations of GSCs within a single tumor express pOLIG2high, pOLIG2low or no OLIG2 at all which are responsible for highly proliferative (pOLIG2high), invasive OPC-like (OLIG2low) and astrocyte-like invasive (no OLIG2) cells or ii) within the tumor cells, OLIG2 expression and phosphorylation is modulated based on the location of the tumor and/or extracellular cues from the microenvironment and other tumor cells. Analysis of a small cohort of hGSCs suggests that OLIG2 phosphorylation levels are lower in the Proneural subtype of GBMs, with PDGFRa expression compared to Classical subtype with high EGFR levels (Kupp, R and Mehta, S; unpublished data). However, ectopic overexpression of Olig2 phosphomutants in hGSCs suggests that altering OLIG2 phosphorylation alone is capable of switching the phenotype from proliferative to invasive and vice-versa, suggesting that both scenarios might occur in GBM tumors.
The TGFβ pathway has been shown to play an important role in invasion of tumor cells in several solid cancers, including GBM (Anido et al., 2010, Rich, 2003, Weller et al., 2001, Wick et al., 2001). Several studies have implicated the TGFβ pathway in glioma pathobiology, with high levels of both TGFβ1 and TGFβ2 being found in GBM tumors compared to normal healthy brain (Platten et al., 2001, Rich, 2003, Wick et al., 2001). Recently, high levels of TGFβ2 expression were reported to be correlated with a poor prognosis in GBM patients (Rodon et al., 2014). Our data provides evidence that TGFβ2 acts downstream of OLIG2, and is a critical player in promoting OLIG2-mediated glioma invasion. hGSCs with pOLIG2low express high levels of pSMAD2 protein, which is one of the mediators of TGFβ signaling (Figure 6). High levels of pSMAD2 expression in GSCs with low or unphosphorylated OLIG2 suggest that GBM tumor cells that have pOLIG2low levels are inherently more invasive due to an active TGFβ2 pathway.
Previous studies have demonstrated the importance of TGFβ signaling in maintenance of the mesenchymal stem-like population in the GBM cells (Anido et al., 2010). Our study provides the mechanism involved in the regulation of TGFβ levels in hGSCs through the modulation of OLIG2 phosphorylation (Figures 7). Overexpression of Olig2 phosphomutants (pOLIG2high) suggests that the presence of pOLIG2 suppresses the invasion program, in part through the suppression of TGFβ2 signaling pathway.
OPCs are the major proliferating cell population in adult brain (Dawson et al., 2003, Geha et al., 2010). Following brain injury, OPCs migrate to the site of injury and contribute to scar formation and remyelination (Hughes et al., 2013). Given the fact that Olig2 plays an important role in OPC specification, it is not surprising that overexpression of Olig2 in OPCs enhances migration (Hornig et al., 2013). Our data suggests that glioma cells exploit Olig2's normal role in OPC migration to invade and populate normal brain parenchyma.
Collectively, our experimental findings provide insight into how a single TF can lead to either tumor growth or invasion, depending on its phosphorylation state. The role of OLIG2 (a critical factor for gliomagenic properties of GSCs) in GBM invasion provides strong support to the presence of glioma stem-like cells at the invasive rim. The OLIG2+, therapy resistant cells that evade surgical resection could be the likely source of tumor recurrence in GBM. Although therapies targeting glioma invasion alone have shown no clinical benefit, our data provide strong support for adjuvant therapies in conjunction with anti-proliferative agents that can target invasive cells. Several agents targeting TGFβ pathway, including an antisense oligonucleotide against TGFβ2 (AP-12009), are currently being evaluated in clinical trials for high grade gliomas (Joseph et al., 2013). Future combination studies with inhibitors of OLIG2 phosphorylation and the TGFβ2 pathway will shed light on its therapeutic effectiveness.
Methods
Cell Culture
Patient samples used for this research were provided by the Biobank Core Facility at St. Joseph's Hospital and Medical Center and Barrow Neurological Institute (BNI), Phoenix, Arizona. The samples were de-identified and conformed to the Biobank Institutional Review Board protocol. Patient-derived cell lines (GB3, GB7, GB16, and GB42) were established from resected primary GBM tumor tissue at BNI. BT145 and BT147 cells were obtained from Dr. Keith Ligon's laboratory at Dana-Farber Cancer Institute, Boston, Massachusetts and propagated under similar conditions. Both mGSCs and hGSCs were cultured, as described previously (Ligon et al., 2007, Mehta et al., 2011). Tumor-bearing animals were euthanized at the onset of neurological symptoms. See supplementary methods for details.
Animal Experiments
Animal husbandry was performed according to the guidelines of St. Joseph Hospital and Medical Center and Barrow Neurological Institute under the Institutional Animal Care and Use Committee–approved protocol. Five- to six-week-old CrTac: NCr-Foxn1nu nude mice (Taconic Biosciences) were used for in vivo orthotropic transplant of BT145, GB3, GB16 cells. Mouse tumor tissues derived from injection of TPM and TPN-expressing cells were obtained from Dr. Sun (Stiles laboratory) at Dana-Farber Cancer Institute. BT145 and BT147 xenograft tissues were obtained from Dr. Ligon's laboratory at Dana-Farber Cancer Institute. For orthotopic transplants, 2 μL of dissociated cells at a density of 100,000 cells/μL were injected in the right striatum, as described previously (Ligon et al., 2007; Mehta et al., 2011).
Tissue processing and cell culture
Tissue was disaggregated using the gentleMACS Dissociator and enzymatically digested with Tumor Tissue Dissociation kit with papain (Miltenyi Biotec Inc.). Cells were plated at a density of 5×10⁵ to 1×10⁶ cells in Corning non-tissue culture treated 75-cm2 flasks. Both mNSCs, mGSCs and hGSCs were cultured as spheres on non-tissue culture-treated flasks or as adherent cultures on laminin (Sigma-Aldrich Co. LLC) in DMEM/F12 media supplemented with B27 and N2 (Invitrogen Corp.; ThermoFisher Scientific Inc.) in the presence of 20 ng/mL epidermal growth factor (EGF) and basic fibroblast growth factor (bFGF) (EMD Millipore, Merck KGaA).
Immunofluorescence
For mouse brain tissue, immunofluorescence was performed on free-floating sections (40μm thickness), while for human frozen tumor tissue sections (5μm thickness) were utilized. For TPN/TPM and BT145/BT147 FFPE tumor tissues 5μm thickness sections were used. For immunodetection of nuclear antigens, tissues were treated for 45 minutes in citrate buffer (pH 6) at 80°C. For detailed staining procedures see supplemental materials.
Imaging
Analysis of immunostaining was performed on confocal stacks (step size of 1 μm) acquired with a 20× oil-immersion objective on a laser scanning microscope (Leica TCS SPE; Leica Microsystems GmbH).
Analysis of migratory properties of GBM lines
We injected 100,000 cells of two pOLIG2low lines (GB16 and GB3) and one -pOlig2high line (BT145) as described above. After 24 days the mice (N=3 per group) were sacrificed and brains were fixed as described above. Following sucrose 30% treatment, brains were frozen and cut in 40 μm sections using a cryostat. Sections were collected in 1:8 series so that in each series, consecutive sections were spatially separated by 280 μm. After staining with anti-hMitochondria and anti-VIMENTIN, sections were mounted on gelatin-coated slides (LabScientific, USA) in a thorough antero-posterior anatomical order. Cancer cells were identified by the co-expression of hMitochondria and VIMENTIN. Maximum distance reached by GBM cells was calculated as 280 μm × the number of sections separating the section with a visible needle track and the furthermost anterior and posterior sections containing hMito+/VIM+ cells.
Real-time PCR and ChIP Analysis
Total RNA was extracted from cells by using the RNeasy purification kit (Qiagen N.V.) according to the manufacturer's instructions. RNA was quantified on a NanoDrop spectrophotometer (Thermo Scientific; ThermoFisher Scientific Inc.) and 1 μg of total RNA was used for cDNA synthesis by using the SuperScript III kit (Life Technologies). Quantitative PCR was performed using inventoried Taqman assays for respective target genes and housekeeping control genes (HPRT or 18S) on the QuantStudio 6 Flex Real-Time PCR System (Life Technologies; ThermoFisher Scientific Inc.). ChIP experiments were performed as described previously (Meijer et al., 2014). Primers details provided in supplementary materials.
GBM subtype classification of human GSCs
Human GSC lines from Dr. Keith Ligon's laboratory (BT145 and BT147) have been classified based on genetic mutations, microarray analysis, and array CGH analysis. GB lines have been classified to respective subtypes through qRT-PCR analysis of genes associated with each subtype (Verhaak et al., 2010) using inventoried Taqman assays (PDGFRa, DLL3, OLIG2, PTEN, TOP2A, EGFR, CD44, and CHI3L1). It is important to note that Table S1 indicates proteins levels of OLIG2. IDH1 mutation status was confirmed by the pathology department at St. Joseph's Hospital and Medical Center by immunohistochemistry with anti-IDH1R132H antibody. Samples were classified into a particular subtype based on the expression of most markers within a subtype.
Cell Migration and Invasion Assay
For determination of migration capacity, 10,000 cells/well (mNSC, mGSC and hGSC) were seeded on the laminin-coated 96-well Oris Cell Seeding Stoppers or Oris (BCG) plate (Platypus Technologies, LLC). The stoppers were removed after 2 hours, and additional media with growth factors was added to the wells. Migration of cells to the detection zone was analyzed after 24 hours. Cells were imaged using bright-field microscopy. Images were then analyzed for cell migration using Image J software (National Institutes of Health, US Department of Health and Human Services). The invasion potential was determined on collagen-coated transwell inserts with a pore size of 8 μm (Becton, Dickinson and Co.). Briefly, dissociated cells (∼100,000/well for mNSC or mGSC) and (∼50,000/well for hGSC) were resuspended in serum-free media with growth factors (20 ng/mL EGF and bFGF each) and mixed with thawed Matrigel (BD Biosciences). A total of 50 μL of Matrigel plus cells suspension was transferred to transwells and inserted in triplicates; transwells were then placed in 24-well plates. After 24 hours (for hGSC) or 48 hours (for mNSC or mGSC), invaded cells that accumulated on the bottom surface of the transwell insert membrane were fixed with 4% PFA (paraformaldehyde) for 20 minutes and stained with DAPI for 1 minute. The membranes were subsequently cut out and mounted on microscopic slides for quantification. Representative pictures of the membranes with cells were acquired at 10× or 20× magnifications, and the total number of cells in 5 individual fields per membrane were counted; the mean ± SD number of invading cells for every condition was calculated. Cells were treated with TGFβ2 (10 ng/mL; Gibco; ThermoFisher Scientific Inc.) and/or the small-molecule inhibitor of the TβRI/II, LY2109761 (2 μM; ApexBio Technology LLC; Fisher Scientific; ThermoFisher Scientific Inc.).
Quantification of TGFβ2 by ELISA
Levels of TGFβ2 secreted by murine or human cells in cell culture media were measured using sandwich ELISA (Quantikine mouse TGFβ-2 and Quantikine human TGFβ-2; R&D Systems) according to the manufacturer's protocol. Cells were seeded (1 × 10⁵ cells/well, 24-well plates) on laminin-coated plates and incubated for 36 hrs. The values were expressed as nanograms per milligram of protein.
TMA Staining and Analysis
Glioma invasion Tissue microarrays (TMA) were obtained from Berens laboratory at TGen, Phoenix, AZ (Kislin et al., 2009). Slides were deparaffinized and hydrated, followed by heat-mediated antigen retrieval in 10 mM Citrate Buffer pH 6 at 80°C, and subsequently immunostained with fluorescence-conjugated antibodies as described above. For each immunostaining, TMA were imaged with a 20× oil-immersion objective. In this study 33 patient tumor tissues on the TMA were used for analysis of percentage of positive cells at the core, rim, or edge. The closest H&E section from the TMA was reviewed by Dr. Jennifer Eschbacher, a board certified Neuropathologist at St. Joseph's Hospital & Medical Center. The TMA images were assessed and scored according to the semi-quantitative scoring system to obtain the immunoreactive score (IRS) (Remmele and Stegner, 1987). For evaluation of the staining patterns the percentage of positive cells (PP; 0 point: no positive cells, 1 point: 1-10%, 2 points: 10-20%, 3 points; >20%) and the staining intensity (SI; 0 point: no signal, 1 point: weak, 2 point: moderate, 3 point; strong) were determined and added. The average IRS score was plotted for each staining.
Statistical Analyses
Data are presented as mean ± standard deviation (SD) or as mean ± standard error of the mean (SEM). If comparing two conditions or cell lines significance was tested with unpaired two-tailed Student's t-test. Significance of differences between conditions or cell lines was tested by the two-way analysis of variance (ANOVA) with Bonferroni multiple comparison tests using GraphPad Prism software. Statistical significance was defined as p < 0.05. For detailed methods see supplementary materials.
Supplementary Material
Highlights.
-Glioma cells expressing unphosphorylated OLIG2 are highly invasive
-Unphosphorylated OLIG2 upregulates TGFβ2 pathway and activates invasion genes
-Inhibition of TGFβ pathway blocks OLIG2-mediated invasion
-Phospho-OLIG2 suppresses TGFβ2-mediated invasion
Acknowledgments
Patient-derived glioma cells were provided by the Biobank Core Facility @ St. Joseph's Hospital and Barrow Neurological Institute and the Living Tissue Bank at Dana-Farber Cancer Institute. The Biobank is funded by the Arizona Biomedical Research Commission and the Barrow Neurological Foundation. We are grateful to Dr. Mythreye Karthikeyan (University of South Carolina at Columbia) for useful suggestions for ELISA assays and TGFβ signaling in general. We thank Mr. Timothy Troxel, Dr. Sara Bowen, Mr. Lior Shtayer, Ms. Nicole Giannonatti, Ms. Laura Belmont, and Ms. Padhmavathy Yuvaraj for their technical assistance. Dr. Harshil Dhruv and Mr. Brock Armstrong (TGen) provided the reagents and technical advice for glioma tissue microarray. We thank the Neuro publications department at Barrow Neurological Institute for their help with the illustrations.
Funding: This work was supported by Barrow Neurological Foundation (to S.M). S.M is also supported by NIH/NINDS grant R01 NS088648A and Bear Necessities Pediatric Cancer Foundation. N.S. is supported by NIH grants R01 NS082745 and R01 CA175391.
Footnotes
Authors' Contribution: S.M. and S.K.S. conceived and designed the experiments and wrote the manuscript. S.K.S. standardized the techniques, performed most of the experiments and analyzed data. S.K.S and R.F. performed immunohistochemistry experiments with xenograft tissues, analyzed data, and edited the manuscript; R.K. produced lentivirus, generated stable cell lines, and helped characterize patient-derived GBM lines; S.K.S and S.R. isolated RNA, performed qPCR analysis, and analyzed immunofluorescence images; E.S. cultured PDX GBM lines, assisted in intracranial surgeries, and performed ELISA assay; S.K.S. and C.LC. generated lentivirus, performed invasion assays, and intracranial surgeries; C.L.M. provided patient-derived cells, xenograft tissue and edited the manuscript; Y.S. provided murine xenograft tissues; J.A.A. provided antibodies, various constructs, reagents, and edited the manuscript; J.E. provided patient tissue for analysis, and conducted neuropathological analysis of H&E samples for GBM tissue, and helped with scoring of TMA; K.L.L. provided patient-derived cells and PDX tissues from DFCI; M.E.B. provided glioma invasion TMA; N.S. provided patient-derived tissues; S.M. coordinated the project, helped analyze the data, and wrote the manuscript.
Publisher's Disclaimer: This is a PDF file of an unedited manuscript that has been accepted for publication. As a service to our customers we are providing this early version of the manuscript. The manuscript will undergo copyediting, typesetting, and review of the resulting proof before it is published in its final citable form. Please note that during the production process errors may be discovered which could affect the content, and all legal disclaimers that apply to the journal pertain.
References
- Anido J, Saez-Borderias A, Gonzalez-Junca A, Rodon L, Folch G, Carmona MA, Prieto-Sanchez RM, Barba I, Martinez-Saez E, Prudkin L, et al. TGF-beta Receptor Inhibitors Target the CD44(high)/Id1(high) Glioma-Initiating Cell Population in Human Glioblastoma. Cancer Cell. 2010;18:655–68. doi: 10.1016/j.ccr.2010.10.023. [DOI] [PubMed] [Google Scholar]
- Carro MS, Lim WK, Alvarez MJ, Bollo RJ, Zhao X, Snyder EY, Sulman EP, Anne SL, Doetsch F, Colman H, et al. The transcriptional network for mesenchymal transformation of brain tumours. Nature. 2010;463:318–25. doi: 10.1038/nature08712. [DOI] [PMC free article] [PubMed] [Google Scholar]
- Cayre M, Canoll P, Goldman JE. Cell migration in the normal and pathological postnatal mammalian brain. Prog Neurobiol. 2009;88:41–63. doi: 10.1016/j.pneurobio.2009.02.001. [DOI] [PMC free article] [PubMed] [Google Scholar]
- Dawson MR, Polito A, Levine JM, Reynolds R. NG2-expressing glial progenitor cells: an abundant and widespread population of cycling cells in the adult rat CNS. Mol Cell Neurosci. 2003;24:476–88. doi: 10.1016/s1044-7431(03)00210-0. [DOI] [PubMed] [Google Scholar]
- Dhruv HD, Mcdonough Winslow WS, Armstrong B, Tuncali S, Eschbacher J, Kislin K, Loftus JC, Tran NL, Berens ME. Reciprocal activation of transcription factors underlies the dichotomy between proliferation and invasion of glioma cells. PLoS One. 2013;8:e72134. doi: 10.1371/journal.pone.0072134. [DOI] [PMC free article] [PubMed] [Google Scholar]
- Furnari FB, Fenton T, Bachoo RM, Mukasa A, Stommel JM, Stegh A, Hahn WC, Ligon KL, Louis DN, Brennan C, et al. Malignant astrocytic glioma: genetics, biology, and paths to treatment. Genes Dev. 2007;21:2683–710. doi: 10.1101/gad.1596707. [DOI] [PubMed] [Google Scholar]
- Geha S, Pallud J, Junier MP, Devaux B, Leonard N, Chassoux F, Chneiweiss H, Daumas-Duport C, Varlet P. NG2+/Olig2+ cells are the major cycle-related cell population of the adult human normal brain. Brain Pathol. 2010;20:399–411. doi: 10.1111/j.1750-3639.2009.00295.x. [DOI] [PMC free article] [PubMed] [Google Scholar]
- Giese A. Glioma invasion--pattern of dissemination by mechanisms of invasion and surgical intervention, pattern of gene expression and its regulatory control by tumorsuppressor p53 and proto-oncogene ETS-1. Acta Neurochir Suppl. 2003;88:153–62. doi: 10.1007/978-3-7091-6090-9_21. [DOI] [PubMed] [Google Scholar]
- Giese A, Bjerkvig R, Berens ME, Westphal M. Cost of migration: invasion of malignant gliomas and implications for treatment. J Clin Oncol. 2003;21:1624–36. doi: 10.1200/JCO.2003.05.063. [DOI] [PubMed] [Google Scholar]
- Giese A, Loo MA, Tran N, Haskett D, Coons SW, Berens ME. Dichotomy of astrocytoma migration and proliferation. Int J Cancer. 1996;67:275–82. doi: 10.1002/(SICI)1097-0215(19960717)67:2<275::AID-IJC20>3.0.CO;2-9. [DOI] [PubMed] [Google Scholar]
- Glas M, Rath BH, Simon M, Reinartz R, Schramme A, Trageser D, Eisenreich R, Leinhaas A, Keller M, Schildhaus HU, et al. Residual tumor cells are unique cellular targets in glioblastoma. Ann Neurol. 2010;68:264–9. doi: 10.1002/ana.22036. [DOI] [PMC free article] [PubMed] [Google Scholar]
- Gupta PB, Onder TT, Jiang G, Tao K, Kuperwasser C, Weinberg RA, Lander ES. Identification of selective inhibitors of cancer stem cells by high-throughput screening. Cell. 2009;138:645–59. doi: 10.1016/j.cell.2009.06.034. [DOI] [PMC free article] [PubMed] [Google Scholar]
- Hess KR, Wong ET, Jaeckle KA, Kyritsis AP, Levin VA, Prados MD, Yung WK. Response and progression in recurrent malignant glioma. Neuro Oncol. 1999;1:282–8. doi: 10.1215/15228517-1-4-282. [DOI] [PMC free article] [PubMed] [Google Scholar]
- Hornig J, Frob F, Vogl MR, Hermans-Borgmeyer I, Tamm ER, Wegner M. The transcription factors Sox10 and Myrf define an essential regulatory network module in differentiating oligodendrocytes. PLoS Genet. 2013;9:e1003907. doi: 10.1371/journal.pgen.1003907. [DOI] [PMC free article] [PubMed] [Google Scholar]
- Hughes EG, Kang SH, Fukaya M, Bergles DE. Oligodendrocyte progenitors balance growth with self-repulsion to achieve homeostasis in the adult brain. Nat Neurosci. 2013;16:668–76. doi: 10.1038/nn.3390. [DOI] [PMC free article] [PubMed] [Google Scholar]
- Joseph JV, Balasubramaniyan V, Walenkamp A, Kruyt FA. TGF-beta as a therapeutic target in high grade gliomas - promises and challenges. Biochem Pharmacol. 2013;85:478–85. doi: 10.1016/j.bcp.2012.11.005. [DOI] [PubMed] [Google Scholar]
- Kalluri R, Weinberg RA. The basics of epithelial-mesenchymal transition. J Clin Invest. 2009;119:1420–8. doi: 10.1172/JCI39104. [DOI] [PMC free article] [PubMed] [Google Scholar]
- Kislin KL, Mcdonough WS, Eschbacher JM, Armstrong BA, Berens ME. NHERF-1: modulator of glioblastoma cell migration and invasion. Neoplasia. 2009;11:377–87. doi: 10.1593/neo.81572. [DOI] [PMC free article] [PubMed] [Google Scholar]
- Ligon KL, Alberta JA, Kho AT, Weiss J, Kwaan MR, Nutt CL, Louis DN, Stiles CD, Rowitch DH. The oligodendroglial lineage marker OLIG2 is universally expressed in diffuse gliomas. J Neuropathol Exp Neurol. 2004;63:499–509. doi: 10.1093/jnen/63.5.499. [DOI] [PubMed] [Google Scholar]
- Ligon KL, Huillard E, Mehta S, Kesari S, Liu H, Alberta JA, Bachoo RM, Kane M, Louis DN, Depinho RA, et al. Olig2-regulated lineage-restricted pathway controls replication competence in neural stem cells and malignant glioma. Neuron. 2007;53:503–17. doi: 10.1016/j.neuron.2007.01.009. [DOI] [PMC free article] [PubMed] [Google Scholar]
- Loftus JC, Ross JT, Paquette KM, Paulino VM, Nasser S, Yang Z, Kloss J, Kim S, Berens ME, Tran NL. miRNA expression profiling in migrating glioblastoma cells: regulation of cell migration and invasion by miR-23b via targeting of Pyk2. PLoS One. 2012;7:e39818. doi: 10.1371/journal.pone.0039818. [DOI] [PMC free article] [PubMed] [Google Scholar]
- Lu QR, Park JK, Noll E, Chan JA, Alberta J, Yuk D, Alzamora MG, Louis DN, Stiles CD, Rowitch DH, et al. Oligodendrocyte lineage genes (OLIG) as molecular markers for human glial brain tumors. Proc Natl Acad Sci U S A. 2001;98:10851–6. doi: 10.1073/pnas.181340798. [DOI] [PMC free article] [PubMed] [Google Scholar]
- Maher EA, Furnari FB, Bachoo RM, Rowitch DH, Louis DN, Cavenee WK, Depinho RA. Malignant glioma: genetics and biology of a grave matter. Genes Dev. 2001;15:1311–33. doi: 10.1101/gad.891601. [DOI] [PubMed] [Google Scholar]
- Mani SA, Guo W, Liao MJ, Eaton EN, Ayyanan A, Zhou AY, Brooks M, Reinhard F, Zhang CC, Shipitsin M, et al. The epithelial-mesenchymal transition generates cells with properties of stem cells. Cell. 2008;133:704–15. doi: 10.1016/j.cell.2008.03.027. [DOI] [PMC free article] [PubMed] [Google Scholar]
- Mateo JL, Van Den Berg DL, Haeussler M, Drechsel D, Gaber ZB, Castro DS, Robson P, Crawford GE, Flicek P, Ettwiller L, et al. Characterization of the neural stem cell gene regulatory network identifies OLIG2 as a multifunctional regulator of self-renewal. Genome Res. 2015;25:41–56. doi: 10.1101/gr.173435.114. [DOI] [PMC free article] [PubMed] [Google Scholar]
- Mehta S, Huillard E, Kesari S, Maire CL, Golebiowski D, Harrington EP, Alberta JA, Kane MF, Theisen M, Ligon KL, et al. The central nervous system-restricted transcription factor Olig2 opposes p53 responses to genotoxic damage in neural progenitors and malignant glioma. Cancer Cell. 2011;19:359–71. doi: 10.1016/j.ccr.2011.01.035. [DOI] [PMC free article] [PubMed] [Google Scholar]
- Meijer DH, Kane MF, Mehta S, Liu H, Harrington E, Taylor CM, Stiles CD, Rowitch DH. Separated at birth? The functional and molecular divergence of OLIG1 and OLIG2. Nat Rev Neurosci. 2012;13:819–31. doi: 10.1038/nrn3386. [DOI] [PMC free article] [PubMed] [Google Scholar]
- Meijer DH, Sun Y, Liu T, Kane MF, Alberta JA, Adelmant G, Kupp R, Marto JA, Rowitch DH, Nakatani Y, et al. An amino terminal phosphorylation motif regulates intranuclear compartmentalization of Olig2 in neural progenitor cells. J Neurosci. 2014;34:8507–18. doi: 10.1523/JNEUROSCI.0309-14.2014. [DOI] [PMC free article] [PubMed] [Google Scholar]
- Nevo I, Woolard K, Cam M, Li A, Webster JD, Kotliarov Y, Kim HS, Ahn S, Walling J, Kotliarova S, et al. Identification of molecular pathways facilitating glioma cell invasion in situ. PLoS One. 2014;9:e111783. doi: 10.1371/journal.pone.0111783. [DOI] [PMC free article] [PubMed] [Google Scholar]
- Ostrom QT, Gittleman H, Fulop J, Liu M, Blanda R, Kromer C, Wolinsky Y, Kruchko C, Barnholtz-Sloan JS. CBTRUS Statistical Report: Primary Brain and Central Nervous System Tumors Diagnosed in the United States in 2008-2012. Neuro Oncol. 2015;17 Suppl 4:iv1–iv62. doi: 10.1093/neuonc/nov189. [DOI] [PMC free article] [PubMed] [Google Scholar]
- Platten M, Wick W, Weller M. Malignant glioma biology: role for TGF-beta in growth, motility, angiogenesis, and immune escape. Microsc Res Tech. 2001;52:401–10. doi: 10.1002/1097-0029(20010215)52:4<401::AID-JEMT1025>3.0.CO;2-C. [DOI] [PubMed] [Google Scholar]
- Polyak K, Weinberg RA. Transitions between epithelial and mesenchymal states: acquisition of malignant and stem cell traits. Nat Rev Cancer. 2009;9:265–73. doi: 10.1038/nrc2620. [DOI] [PubMed] [Google Scholar]
- Rich JN. The role of transforming growth factor-beta in primary brain tumors. Front Biosci. 2003;8:e245–60. doi: 10.2741/992. [DOI] [PubMed] [Google Scholar]
- Rodon L, Gonzalez-Junca A, Inda Mdel M, Sala-Hojman A, Martinez-Saez E, Seoane J. Active CREB1 promotes a malignant TGFbeta2 autocrine loop in glioblastoma. Cancer Discov. 2014;4:1230–41. doi: 10.1158/2159-8290.CD-14-0275. [DOI] [PubMed] [Google Scholar]
- Schmierer B, Hill CS. TGFbeta-SMAD signal transduction: molecular specificity and functional flexibility. Nat Rev Mol Cell Biol. 2007;8:970–82. doi: 10.1038/nrm2297. [DOI] [PubMed] [Google Scholar]
- Siebzehnrubl FA, Silver DJ, Tugertimur B, Deleyrolle LP, Siebzehnrubl D, Sarkisian MR, Devers KG, Yachnis AT, Kupper MD, Neal D, et al. The ZEB1 pathway links glioblastoma initiation, invasion and chemoresistance. EMBO Mol Med. 2013;5:1196–212. doi: 10.1002/emmm.201302827. [DOI] [PMC free article] [PubMed] [Google Scholar]
- Silver DJ, Siebzehnrubl FA, Schildts MJ, Yachnis AT, Smith GM, Smith AA, Scheffler B, Reynolds BA, Silver J, Steindler DA. Chondroitin sulfate proteoglycans potently inhibit invasion and serve as a central organizer of the brain tumor microenvironment. J Neurosci. 2013;33:15603–17. doi: 10.1523/JNEUROSCI.3004-12.2013. [DOI] [PMC free article] [PubMed] [Google Scholar]
- Sun Y, Meijer DH, Alberta JA, Mehta S, Kane MF, Tien AC, Fu H, Petryniak MA, Potter GB, Liu Z, et al. Phosphorylation state of Olig2 regulates proliferation of neural progenitors. Neuron. 2011;69:906–17. doi: 10.1016/j.neuron.2011.02.005. [DOI] [PMC free article] [PubMed] [Google Scholar]
- Suva ML, Rheinbay E, Gillespie SM, Patel AP, Wakimoto H, Rabkin SD, Riggi N, Chi AS, Cahill DP, Nahed BV, et al. Reconstructing and reprogramming the tumor-propagating potential of glioblastoma stem-like cells. Cell. 2014;157:580–94. doi: 10.1016/j.cell.2014.02.030. [DOI] [PMC free article] [PubMed] [Google Scholar]
- Venere M, Horbinski C, Crish JF, Jin X, Vasanji A, Major J, Burrows AC, Chang C, Prokop J, Wu Q, et al. The mitotic kinesin KIF11 is a driver of invasion, proliferation, and self-renewal in glioblastoma. Sci Transl Med. 2015;7:304ra143. doi: 10.1126/scitranslmed.aac6762. [DOI] [PMC free article] [PubMed] [Google Scholar]
- Weller M, Cloughesy T, Perry JR, Wick W. Standards of care for treatment of recurrent glioblastoma--are we there yet? Neuro Oncol. 2013;15:4–27. doi: 10.1093/neuonc/nos273. [DOI] [PMC free article] [PubMed] [Google Scholar]
- Weller M, Wick W, Platten M. Role of TGF-beta in oncogenesis. Microsc Res Tech. 2001;52:353. doi: 10.1002/1097-0029(20010215)52:4<353::AID-JEMT1019>3.0.CO;2-U. [DOI] [PubMed] [Google Scholar]
- Wick W, Platten M, Weller M. Glioma cell invasion: regulation of metalloproteinase activity by TGF-beta. J Neurooncol. 2001;53:177–85. doi: 10.1023/a:1012209518843. [DOI] [PubMed] [Google Scholar]
- Wong ET, Hess KR, Gleason MJ, Jaeckle KA, Kyritsis AP, Prados MD, Levin VA, Yung WK. Outcomes and prognostic factors in recurrent glioma patients enrolled onto phase II clinical trials. J Clin Oncol. 1999;17:2572–8. doi: 10.1200/JCO.1999.17.8.2572. [DOI] [PubMed] [Google Scholar]
Associated Data
This section collects any data citations, data availability statements, or supplementary materials included in this article.