

Abstract
Out of their niche environment, adult stem cells, such as mesenchymal stem cells (MSCs), spontaneously differentiate. This makes both studying these important regenerative cells and growing large numbers of stem cells for clinical use challenging. Traditional cell culture techniques have fallen short of meeting this challenge, but materials science offers hope. In this study, we have used emerging rules of managing adhesion/cytoskeletal balance to prolong MSC cultures by fabricating controllable nanoscale cell interfaces using immobilized peptides that may be enzymatically activated to change their function. The surfaces can be altered (activated) at will to tip adhesion/cytoskeletal balance and initiate differentiation, hence better informing biological mechanisms of stem cell growth. Tools that are able to investigate the stem cell phenotype are important. While large phenotypical differences, such as the difference between an adipocyte and an osteoblast, are now better understood, the far more subtle differences between fibroblasts and MSCs are much harder to dissect. The development of technologies able to dynamically navigate small differences in adhesion are critical in the race to provide regenerative strategies using stem cells.
Keywords: mesenchymal stem cell, stem cell growth, dynamic cell/material interface, metabolomics
In vivo, adult stem cells reside within a specialized environment known as the niche. The niche is made up of cellular and noncellular components, including resident stem cells, support cells, and extracellular matrix (ECM) that, together, regulate stem cell self-renewal.1−4
Traditional culture plastics present a different environment to the in vivo niche, and hence mesenchymal stem cells (MSCs) spontaneously differentiate to a heterogeneous population mainly made up of fibroblasts.5 Thus, understanding and ultimately controlling MSC growth is desirable.
In vitro materials-based strategies have been critical for understanding how cells adhere, for example, in showing that MSCs require a minimum patterned area of 69 μm2 of fibronectin per 1000 μm2 of surface in order for adhesions to form6 and that integrin composition and spacing are critical in integrin gathering and adhesion maturation.7,8 As biomaterials can be used to control focal adhesion formation, they can thus be used to tune MSC phenotype.9,10 It has been shown that if MSCs are allowed to spread, form large adhesions, and develop a highly contractile cytoskeleton, they differentiate into osteoblasts.11−16 If, however, the MSCs are prevented from spreading, low intracellular tension and resultant adipogenesis follows.11−16 These rules have been devised using techniques such as microcontact printing of adhesive patterns,11,17,18 control of stiffness/cross-linking density,12,13,19 changing grafted chemistries,20,21 employing stress relaxation,22,23 and using defined nanotopographies.24
Of these, only nanotopography has been shown to also be able to facilitate prolonged MSC growth with retained multipotency.5 Enhanced MSC self-renewal required a slightly lower level of adhesion and cytoskeletal tension than on controls where spontaneous and untargeted differentiation to fibroblasts was observed.25 As MSCs have fibroblastic morphology,26 the morphology/adhesion/tension difference between a fibroblast and a MSC is small. Thus, as it is challenging to control cell tension so subtly, the rules for in vitro prolonged MSC growth with multipotency retained remain unclear, and platforms able to achieve this are a scarce resource for the study of how stem cells work.
An optimal cell/material interface would allow dynamic regulation of intracellular tension so that it would be possible to prove that altering the growth adhesion state results in differentiation. While examples of in situ change of surface properties exist, these switches involve uncaging and switching between inactive (no adhesion, cell quiescence) and active states (differentiation) and thus are not suited to a more subtle regulation of adhesion required to probe stem cell growth.
Dynamic culture systems are emerging largely based on light-sensitive27−29 surfaces. Typically, a caging group is removed to reveal the cell adhesive tripeptide RGD (arginine, glycine, aspartic acid), which binds integrins and hence regulates adhesion and intracellular tension.27,28,30
The first MSC dynamic system involved MSCs adhering to pendular RGD incorporated within a polyethylene glycol (PEG)-based hydrogel.31 Photocleavage was used to release the RGDs from the hydrogel, resulting in chondrogenesis as the MSCs rounded up.31 While clearly demonstrating that it is possible to control cell fate using changes in cell adhesion, this study had limitations as cell viability and expansion were limited in the hydrogels. Another study illustrated the potential for targeting osteogenesis from MSCs in 3D gels over short culture times, but control over cell growth was not achieved.32
Electroactive surfaces33−35 and protein-responsive materials36 are also of interest in this area. However, these studies rely on nonbiological chemistries and use of conducting materials/electrochemical potentials that may affect cell response, and none demonstrated the ability to support prolonged multipotency or the ability to modulate the environment to allow observation of changes that occur as differentiation is initiated. Recently, mechano-activated surfaces have gained interest based on concepts of opening of cryptic sites in proteins.37,38
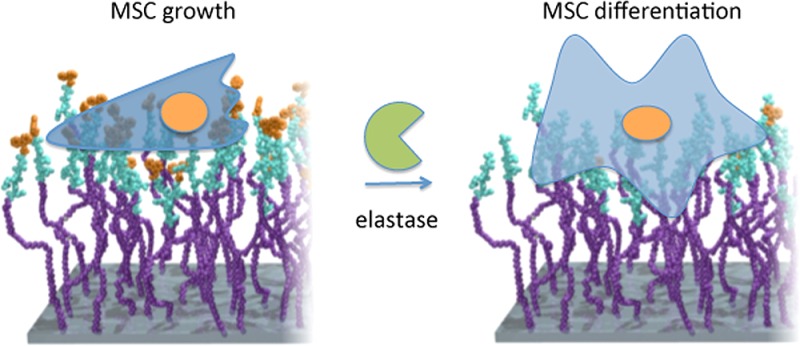
We, however, chose to employ enzymatic activation to provide a natural stimulus to trigger changes in material properties, with advantages of biocompatibility and selectivity.39 Here, we present a dynamic surface where both the caging group and the hidden group have discrete and tunable biological roles and show that adhesion can be subtly tuned to turn MSCs from a growth state with multipotency retained to a differentiating state that allows us to elucidate in vitro MSC growth mechanisms.
Results and Discussion
Synthesis of a User-Controlled Nanointerface
Surfaces were synthesized by silanizing glass coverslips and covalently attaching a PEG monolayer onto which fluorenylmethyloxycarbonyl (FMOC)-amino acids were iteratively coupled using solid-phase peptide synthesis directly on the PEGylated glass surface. The complete surface consists of the integrin binding RGD peptide or integrin inactive RGE peptide, followed by an elastase cleavable dialanine (AA) linker and then either FMOC as a steric blocking group, or PEG as an adhesion-reducing blocking group. Hence, the final full sequences were either FMOC-AARGD/E or PEG-AARGD/E, where D/E refers to RGD or RGE constructs. The FMOC protecting moiety sterically prevents cells from fully interacting with the underlying RGD ligands.40 Elastase removes the FMOC/PEG blocking group exposing RGD, that is, FMOC-A↓ARGD or PEG-A↓ARGD, where ↓ refers to the cleavage point (Figure 1A and Supplementary Figure 1). Using optimized protocols,41 synthesis was followed using a combination of solid-state fluorescence spectroscopy (SSFS), water contact angle measurements, and time-of-flight secondary ion mass spectrometry (Figure 1B and Supplementary Figures 2 and 3).
Figure 1.

Dynamic, enzyme cleavable surfaces for MSC growth. (A) Cartoon representation of the FMOC and PEG blocked RGD surfaces illustrating the elastase cleavage site. Plain glass coverslips were modified using silanization and PEGylation steps followed by solid-phase peptide synthesis to build up the full structure in a stepwise manner. The incorporation of a dialanine enzyme cleavable linker facilitates the removal of the FMOC/PEG blocking group, thereby forming the basis of the switch. (B) ToF-SIMS image shows a uniform chemical surface composition on the micron scale and confirms that PEG, FMOC, and amino acids (shown as the sum of the indicated representative peaks for each amino acid) are only detected in the analysis where expected; that is, FMOC only seen on the FMOC-D surface and amino acids was only noted when the AARGD sequence was present. Color scales represent ion counts. Images for specific ions are presented on the same scale for all samples; total ion images are scaled to their individual range. Note that inset images in the FMOC column are all similarly brightness-enhanced versions of the main images to show differences more clearly. (C) MSCs were cultured on plain glass coverslips for 48 h and treated with different concentrations of elastase ranging from 1.0 to 0.1 mg/mL (4.60 to 0.460 U) in basal cell culture medium. Live/dead stain for elastase tolerance showed that while cell adhesion was clearly affected at the higher concentrations, few remaining dead cells were noted with any elastase concentration (they may have detached). However, cells incubated with 0.1 mg/mL elastase were indistinguishable from controls, whereas the positive controls (ethanol addition) indicated uptake of the ethidium homodimer; thus these cells were dead. (D) Surface-bound FMOC groups were seen to fluoresce at a wavelength of 315 nm (left-hand spectrum), and piperidine cleavage resulted in a loss of this signal (middle spectrum). At 0.1 mg/mL, it was seen that elastase cleaved surface-bound FMOC (right-hand spectrum); n = 3.
In order to activate the surface in situ, elastase concentration was optimized so the blocking group could be cleaved from the surface without affecting cell adhesion/viability. MSC adhesion/viability was assessed by incubating the cells with different elastase concentrations (1.0–0.1 mg/mL, 4.60–0.460 U) and using a live/dead stain. Between 1.0 and 0.4 mg/mL, MSCs were rounded up and detached, while at 0.2 mg/mL, some live cells remained attached though poorly spread. At 0.1 mg/mL, cell adhesion/viability was indistinguishable from controls (Figure 1C) and no detrimental affects were identified (Supplementary Figure 4). SSFS confirmed that 0.1 mg/mL elastase could cleave AA and remove FMOC (Figure 1D). ToF-SIMS was employed to indicate that, after FMOC cleavage, RGD was still in place (Supplementary Figure 5). Note that cleavage can be controlled as changing AARGD to phenylalanine (F)ARGD creates a shift from 29 to 50% FMOC cleavage, respectively (Supplementary Figure 6), and this should allow control of how adhesive the surface is or even permit sequential RGD% exposure to the cells.
For FMOC blocking groups, uncleaved substrates are referred to as FMOC-RGD and FMOC-RGE, respectively, and cleaved substrates are referred to as RGD and RGE. Plain glass, PEG18, RGD, and RGE controls were also used, and PEG blocked substrates used in later experiments.
Dynamic Targeting of MSC Adhesions
MSCs were seeded on plain, PEG18, RGD/E controls, FMOC-RGD/E, and surfaces pretreated with 0.1 mg/mL elastase to remove the FMOC blocking group (RGD/E). As expected, poor cell adhesion was observed on PEG18, RGE controls, FMOC-RGD/E, and cleaved RGE substrates. In comparison, cells seeded on plain, RGD controls, and cleaved RGD surfaces adhered well; this is in line with hypothesized adhesion results (i.e., high adhesion on plain glass and surfaces with RGD exposed). Viability assay confirmed that all surfaces supported cell growth (Supplementary Figures 7 and 8).
Seeding density was also optimized and 75, 39, and 7 cells/mm2 tested. All samples were cultured for 7 days with half of the FMOC-RGD/E substrates cultured as uncleaved (or adhesion “low”) for 48 h before switching to cleaved (or adhesion “high”) using elastase (2 days “low” and 5 days “high”). High cell density (75 cells/mm2) muted the effects of spreading from the “low” to “high” state, while lower cell densities (39 and 7 cells/mm2) exhibited markedly different degrees of cell spreading between these substrates (Supplementary Figures 8–10). This is in agreement with previous reports illustrating that reduction in cell–cell signaling is important to amplify cell–material signaling.12 An amount of 7 cells/mm2 was selected as optimal because, postcleavage, the MSCs acted as if on RGD control.
Adhesion and resultant intracellular tension were further studied through vinculin (present in cell adhesions) and p-myosin (pSer 19 was chosen as it phosphorylates Rho-associated protein kinase involved in cytoskeletal contraction11) immunofluorescence. After 7 days of culture (2 days “low” and 5 days “high” for cleaved substrates), adhesions were classified by length42 as focal complexes (FX, <1 μm), focal adhesions (FA, 1–5 μm), and supermature adhesions (SMAdh, >5 μm). Imaging of vinculin and actin cytoskeleton demonstrated poor adhesion and few stress fibers in cells cultured on PEG18, RGE controls, FMOC-RGE, cleaved RGE, and FMOC-RGD (low) substrates. In contrast, increased adhesion numbers and numerous stress fibers were seen in cells on plain, RGD controls, and cleaved RGD (high) samples (Figure 2A).
Figure 2.

Dynamic control of MSC adhesion and tension. (A) MSCs cultured at 7 cells/mm2 were seen to spread to a greater degree on plain controls, RGD controls, FMOC-RGD (low), and cleaved RGD (high) surfaces and to a smaller degree on PEG18 and all RGE surfaces, creating a pronounced cell size difference between the surfaces. As morphology was altered, adhesion and cytoskeletal arrangement also changed with RGD controls and cleaved RGD (high) surfaces, supporting more organized stress fibers and larger adhesions. Red = actin, green = vinculin, and blue = nuclei. (B) Adhesion subtypes were recorded as a percentage of the average number of adhesions identified per cell. The majority of adhesions were focal adhesions (FAs), with focal complexes (FXs) and supermature adhesions (SMAdhs) making up a much smaller percentage. As a whole, more FXs were observed per cell on plain, PEG18, RGE controls, FMOC-RGD (low), and cleaved RGE substrates, while more SMAdhs were observed on RGD controls and cleaved RGD (high) surfaces. In line with differences in cell size and adhesion length, p-myosin expression, as a measure of cytoskeletal tension, showed the cells were under increased tension on RGD controls and cleaved RGD (high) surfaces. Error bars are standard error of the mean; stars indicate significant difference between groups as determined by one-way ANOVA and Dunn’s post-hoc test, where *P < 0.5, **P < 0.01, and ***P < 0.001 - § = plain/PEG different to RGD by P < 0.05; n = 40 cells per substrate and three material replicates.
All observations thus fit with the hypothesis that FMOC-RGD permitted only cells with a similar adhesion profile to RGE, but as the surfaces were switched from the “low” to the “high” mode, larger cell adhesions became established, similar to RGD controls (Figure 2B and Supplementary Figure 11).
When p-myosin expression was considered, the cells were observed to switch from a lower tension phenotype to a higher one when FMOC-RGD surfaces were enzymatically switched from “low” to “high”. MSCs cultured on FMOC-RGD surfaces exhibited p-myosin levels only slightly higher than those of cells cultured on RGE containing substrates, whereas p-myosin expression for MSCs seeded on cleaved RGD surfaces was similar to levels expressed by cells cultured on the RGD control (Figure 2B). Critically, in line with nanotopographical studies, the number of SMAdhs and p-myosin expression was significantly lower on FMOC-RGD substrates than on glass controls, supporting that MSC growth requires a lower tensional state than fibroblastic growth.5,25
To ascertain if FMOC-RGD substrates do support MSC growth, cell proliferation was assessed on plain, FMOC-RGD, FMOC-RGE, and RGD and RGE controls by analyzing bromodeoxyuridine (BrdU) uptake. Similar numbers of BrdU-positive cells were observed at day 1 of culture, but by day 4, active proliferation was only significantly increased on FMOC-RGD (low) (Supplementary Figure 12A). Furthermore, cell counts over 28 days showed cell expansion was greatest on uncleaved FMOC-RGD (low), in line with MSCs being faster growing than differentiated cells (Supplementary Figure 12B). Moving into functional analysis, we discounted all RGE and PEG18 substrates because cell numbers were considered too low to gather meaningful data.
To understand the first stages of differentiation related to adhesion, we examined roles for integrins β1 (part of the fibronectin (FN) receptor) and β5 (can form part of the vitronectin (VN) receptor and has been identified previously as being important in MSC osteogenic commitment43), the bone morphogenetic protein 2 (BMP2) receptor BMPR1a, and ezrin (anchors stress fibers to the cell membrane). After 48 h of culture, elastase was added to half the cultures to reveal RGD (t0) and then receptor colocalization followed for 48 h. For MSCs on FMOC-RGD (low) substrates, adhesions were largely punctate and β1-based, suggesting predominantly FN-receptor-mediated attachments with negligible BMPR1a colocalization or β5 expression (Figure 3A,B). However, on cleaved RGD (high) surfaces, MSCs were seen to express highly colocalized β5 and BMPR1a with elongated adhesion morphologies (Figure 3B). These data agree with reports showing that cells bridge adhesions better using VN receptors, allowing larger adhesions to form.44
Figure 3.
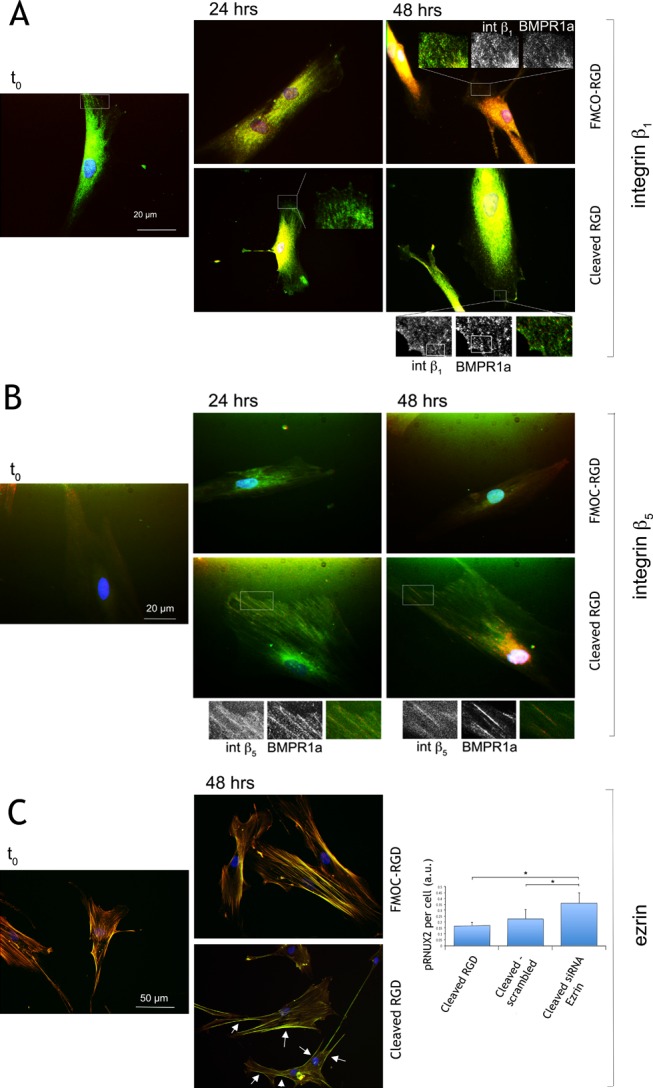
Integrin, BMP2 receptor, and cytoskeletal tethering changes in MSCs on dynamic surfaces. (A) Integrin β1 and BMPR1a staining in MSCs cultured on FMOC-RGD (low) at t0 (t0 is after 48 h of culture immediately before addition of elastase) and then after 24 and 48 h post-elastase treatment (cleaved RGD) or in FMOC-RGD surfaces. β1 was observed to be found in punctate adhesions, with little BMPR1a colocalization noted (48 h inset). On the cleaved RGD (high) surfaces, BMPR1a was seen with adhesion morphology but in different areas to the regions of β1 localization (48 h outset). (B) Integrin β5 and BMPR1a staining in MSCs on FMOC-RGD surfaces at t0 (immediately before addition of elastase) and then at 24 and 48 h post-elastase (cleaved RGD) or in FMOC-RGD surfaces. On the FMOC-RGD surfaces, little β5 expression and no BMPR1a colocalization were observed. However, on the cleaved surfaces, strong β5/BMPR1a colocalization was noted by 24 h (outset images). (C) Actin/ezrin colocalization could be seen at t0 and on FMOC-RGD. However, for cleaved RGD samples, ezrin appeared to colocalize with cortical actin at the cell periphery (arrows). SiRNA knock-down of ezrin resulted in an increase in pRUNX 2 5 days post-switch. For pRNUX2, in-cell western analysis, n = 3, results are mean ± SD, stats by ANOVA and Dunn’s post-hoc test where *P < 0.05.
For ezrin, MSCs on FMOC-RGD (low) surfaces had close colocalization of stress fibers and ezrin (Figure 3C). However, on cleaved RGD (high) surfaces, ezrin relocated, becoming associated with cortical actin (Figure 3C). We can postulate that this allows for stress fiber remodeling required as the MSCs adapt to their new environments and increase adhesion. Indeed, if ezrin is knocked down with siRNA, runt-associated transcription factor 2 (RUNX2, an osteogenic transcription regulator) phosphorylation, hence activation, increases (Figure 3C).
Controlling Adhesion Retains MSC Phenotype
Following from observations of adhesion changes, we need to consider if these translate into an ability to control phenotype. Thus, phenotypical analyses of the MSC growth markers STRO-1 and activated leukocyte cell adhesion molecule (ALCAM) and the osteoblast markers osteopontin (OPN) and osteocalcin (OCN) were next used in longer-term cultures. The cells grew to form areas of confluence on glass, RGD controls, FMOC-RGD (low), and cleaved RGD (high) surfaces as could be seen at day 7 (2 days “low” and 5 days “high” for cleaved RGD; Supplementary Figure 13). While MSCs on all surfaces retained expression of STRO-1 and ALCAM, it appeared that MSCs on the RGD controls and cleaved RGD (high) surfaces had started to express OPN and OCN. Image analysis for OCN at days 1, 3, and 5, however, showed negligible OCN at days 1 and 3 and a significant change in osteogenesis only on RGD controls (where cells had been exposed to RGD longest) at day 5 (Supplementary Figure 14).
By day 21 (2 days “low” and 19 days “high” for cleaved RGD), these differences were clear. On RGD controls and cleaved RGD surfaces, the cells expressed low levels of STRO-1 and ALCAM and high levels of OPN and OCN (Figure 4A). Image analysis of STRO-1 expression at days 7, 14, and 21 illustrated a homogeneous STRO-1 starting population at day 7 on all materials, with STRO-1 levels then falling with time (Figure 4B). It is noteworthy that, at day 14, STRO-1 levels were highest on the cleaved RGD (high) surfaces, possibly reflecting a lag due to the switch. However, by day 21, as osteogenic markers were expressed on the cleaved surface, STRO-1 expression was reduced to 15% of cells comparable to 12.2% in cells on the glass control. In contrast, on the FMOC-RGD (low) surface, 30.5% of MSCs retained STRO-1 expression; MSCs could be removed from this surface after 21 day culture and multipotency demonstrated (Supplementary Figure 15).
Figure 4.
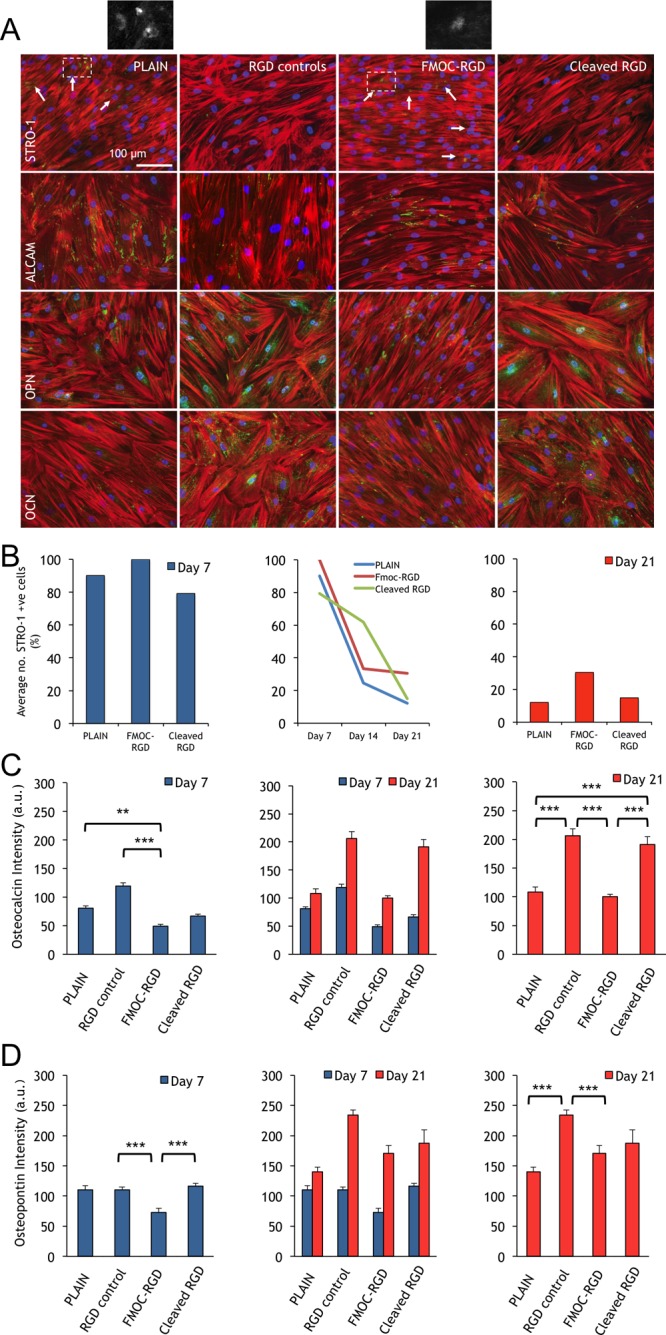
Analysis of MSC growth and differentiation at days 7 and 21. (A) Immunofluorescence images of STRO-1 MSCs at day 21. At this time point, the STRO-1 marker had substantially decreased on all surfaces, remaining only on plain controls and FMOC-RGD (low) surfaces (outset images). ALCAM was still easily detectible on the plain controls and FMOC-RGD but reduced on RGD controls and cleaved RGD (high) surfaces. OPN and OCN levels were increased on RGD controls and cleaved RGD with respect to the other surfaces. Red = actin, green = STRO-1/ALCAM/OPN/OCN, and blue = nuclei; scale bar is 100 μm. (B) Graphs show quantification of STRO-1 expression at 7, 14, and 21 days of culture. At day 7, almost all cells on plain controls, FMOC-RGD, and cleaved RGD surfaces expressed STRO-1. This reduced with time until, at day 21, less that 15% of cells on plain controls and the cleaved RGD surface retained STRO-1 expression, while double this number, >30%, retained STRO-1 expression on FMOC-RGD (approximately 100 cells were included in the quantification; n = 2). (C) OCN quantification. Data represent OCN levels expressed by MSCs cultured on plain glass, RGD controls, FMOC-RGD, and cleaved RGD surfaces at days 7 and 21 of culture. OCN expression was observed to increase most on RGD controls and cleaved RGD compared to the other surfaces. (D) OPN quantification. Data represent OPN levels expressed by MSCs seeded on plain glass, RGD controls, FMOC-RGD, and cleaved RGD at days 7 and 21 of culture. OPN expression was observed to increase most on the RGD controls and cleaved RGD surfaces. Statistics carried out by one-way ANOVA and Dunn’s post-hoc test, where *P < 0.05, **P < 0.01, and ***P < 0.001, n = 3. Note that au = arbitrary units.
Quantification of OPN and OCN at 21 days of culture indicated that FMOC-RGD (low) and plain controls had low levels of bone marker expression, wheras significantly elevated levels were observed on the RGD control and cleaved RGD surface (Figure 4C,D). In addition, we checked for the expression of chondrogenic (collagen II) and adipogenic (fatty acid binding protein, FABP) markers. We observed negligible evidence for significant expression of either chondrogenesis or adipogenesis (Supplementary Figure 16), illustrating that targeted differentiation toward a high-tension phenotype, osteogenesis, was achieved on the RGD-exposed surfaces. Osteogenesis for MSCs on the RGD control and cleaved RGD (high) surfaces was confirmed at 28 days (Supplementary Figure 17).
Adhesion/Phenotype Changes Are Reflected in MSC Metabolic Activity
To support phenotypical data, metabolomic analysis was carried out to gain a deeper understanding of MSC metabolism during in situ activation as it has been previously shown that the stem cell metabolome becomes activated upon differentiation.5,25,45,46 Untargeted mass spectrometry analysis of metabolites from MSCs cultured on FMOC-RGD (low) at 2 and 4 days versus MSCs on plain controls at similar time points showed only a slight metabolomic change between both time points (Figure 5A,B). However, when FMOC was then cleaved from the surface on day 2 to reveal the RGD ligand (high) and cultured for a further 2 days, changes became highly significant; that is, metabolome activation was observed (Figure 5C). When the culture time was expanded to 7 days (2 days “low” and 5 days “high” for cleaved RGD), metabolic differences increased. Principle component analysis showed that the FMOC-RGD (low) metabolome was more homogeneous than for MSCs on the plain control or cleaved RGD (high) surfaces, where heterogeneous metabolomic profiles were identified (Figure 5D). It has also been proposed that self-renewing embryonic stem cell45 and MSC5 populations pool unsaturated metabolites to allow for redox plasticity; this trend is seen in the lipid metabolites in this current study (Figure 5E).
Figure 5.

Metabolite analysis of MSCs on dynamic surfaces. (A–C) Putative metabolites were analyzed using MetaboAnalyst 2.0, and the data were displayed as volcano plots relative to D2-plain (plain control at day 2). The y-axis refers to the p value (determined by two-tailed t test), with the x-axis intercept set at P = 0.05 so that all data points above the x-axis represent metabolites that were significantly different from controls. The x-axis represents fold change as a measure of the magnitude in difference between samples and the control. Data points to the left of the y-axis are metabolites down-regulated with respect to controls, and data points on the right of the y-axis were up-regulated (n = 3). (D) At 7 days (2 days “low” and 5 days “high” for cleaved RGD), principle component analysis showed very clear metabolomic differences with MSCs on the FMOC-RGD (low) surface having a highly homogeneous metabolome, more so than on the controls, and the cleaved RGD (high) surfaces having a far more heterogeneous metabolome (n = 3). (E) Heatmap of putatively detected unsaturated lipids after 7 days culture showing up-regulation in MSCs on the FMOC-RGD surface and down-regulation in MSCs on the cleaved RGD surface (n = 3). (F,G) Ingenuity functional pathway analysis illustrating more significantly altered functional pathways in MSCs on the cleaved RGD surface (F) compared to those on FMOC-RGD surfaces (G). Functions include carbohydrate, small molecule, nucleic acid, lipid and vitamin metabolism, cell growth and proliferation, and skeletal development pathways (statistics by Fischer’s exact test, P < 0.05 represented by bars higher than the threshold arrow, n = 3).
Ingenuity pathway analysis allowed us to observe that fewer metabolic pathways were differentially regulated with less significance in MSCs on the FMOC-RGD (low) surface compared to that on the cleaved RGD (high) surface (Figure 5F,G). These include pathways involved in energy (energy production, lipid and carbohydrate metabolism), growth (cell proliferation and nucleic acid metabolism), protein (post-translational modification and cellular development), and skeletal development. Furthermore, most highly modulated networks for MSCs on FMOC-RGD (low) illustrated metabolic regulation linked to cell growth control. When similar networks were considered for cells on cleaved RGD (high), metabolic regulation appeared less significant (Supplementary Figures 18 and 19).
Long-Term MSC Growth Control
Next, we wanted to examine if our “low” maintenance state could work for prolonged cultured before switching to “high”, thus further demonstrating that adhesion was responsible for growth/osteogenesis. Thus, we cultured the MSCs for 2 weeks rather than 2 days before adding elastase and then allowed the cells to grow a further 2 weeks before staining for STRO-1. With the longer time to trigger, loss of STRO-1 on the cleaved RGD surface (high) was not seen, suggesting retention of multipotency rather than differentiation (Supplementary Figure 20). Working on the hypothesis that the FMOC group becomes coated in ECM proteins reducing elastase efficiency, we substituted the FMOC blocking group for PEG to reduce protein adsorption.
As with FMOC-RGD, MSCs were seen to expand on PEG-RGD and retain STRO-1 expression, which was reduced on plain controls (Figure 6A,B). However, unlike with FMOC, switching from PEG-RGD to its corresponding cleaved counterpart resulted in focal adhesion elongation and reduction in STRO-1, demonstrating that stimulus-initiated cell differentiation with elastase could be achieved with longer culture (Figure 6A,B). Metabolomic analysis after 7 days culture (2 days “low” then 5 days “high” for cleaved RGD) again showed that the inactive RGD surface (PEG-RGD) had the most homogeneous metabolome, while cleaved RGD surfaces had a more heterogeneous metabolome indicative of a change from MSCs to differentiating phenotype (Figure 6C).
Figure 6.
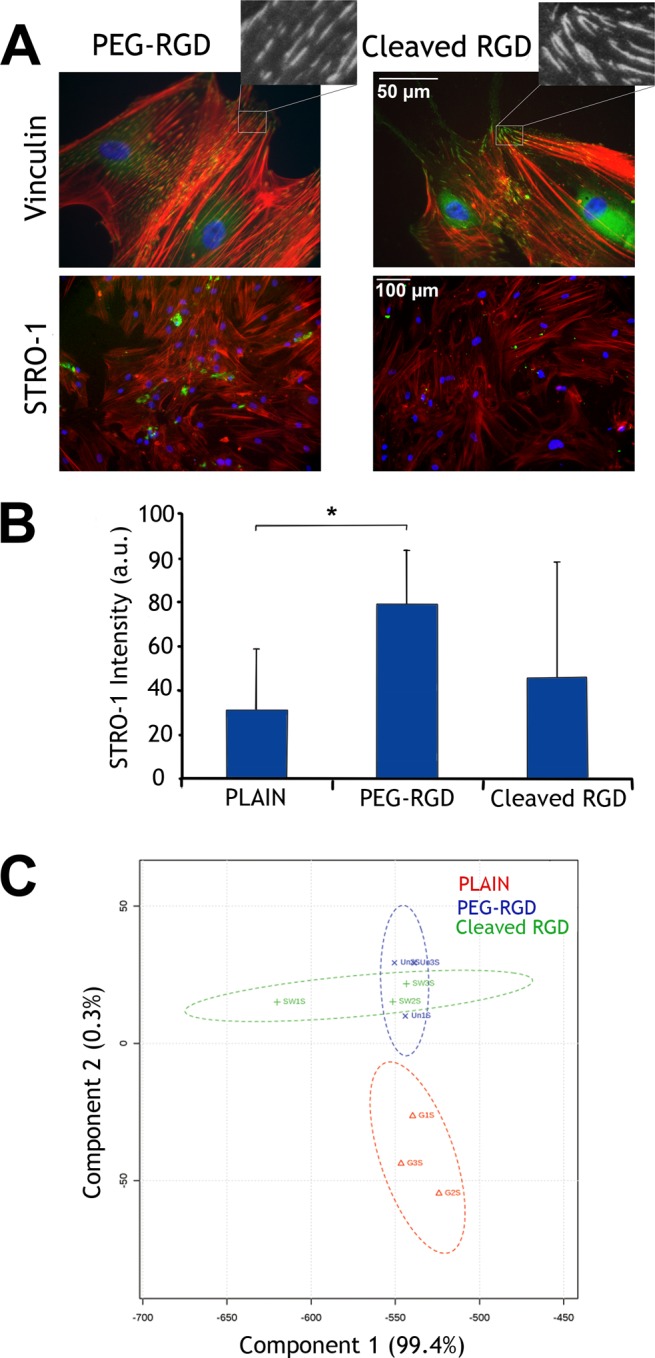
Analysis of MSC adhesion and differentiation on PEG blocked surfaces. (A) Immunofluorescence images of vinculin in adhesions at day 5 and STRO-1 at day 21 of culture. On the PEG-RGD (low) substrates, MSCs were observed to have smaller adhesions and increased expression of the STRO-1 MSC marker (arrows) compared to MSCs seeded on RGD cleaved surfaces (high) where, again, larger adhesions and loss of STRO-1 expression was observed. Red = actin, green = vinculin or STRO-1, and blue = nucleus. (B) Image analysis after 21 days of culture confirmed these results, demonstrating that more MSCs retained STRO-1 expression on PEG-RGD than cells on plain controls and cleaved RGD surfaces which typically lose STRO-1 much faster (results are mean ± SD, statistics by ANOVA, *P < 0.05). (C) Principle component analysis from metabolomics data illustrates most data homogeneity on PEG-RGD surfaces and most heterogeneity on the cleaved RGD surface as with the FMOC blocked samples (n = 3).
Summary and Conclusions
This report provides evidence that the MSC adhesion “footprint” permits control of MSC growth and targeted differentiation. Using enzyme cleavable surfaces, it is shown that increasing adhesion causes lineage commitment. This report addresses a major research focus of MSC biology—how do they regulate multipotency. MSCs are shown to walk an extremely fine line between controlled growth with multipotency and spontaneous fibroblast differentiation. We propose from our data that a small reduction in adhesion by controlling the integrin subunit use prevents metabolome activation with associated energy demand required for differentiation; a larger reduction in adhesion and tension would result in adipogenesis.11,17 On the same surface, we demonstrate that a switch from FN to VN receptor facilitates both adhesion and BMP signaling to switch from stem cell growth to osteogenic commitment through increased levels of intracellular tension. We note that our analysis relies largely on binning adhesion length and that analysis in X, Y, and Z may yield further information.47,48 However, we show that length gives an effective, easy to use, differentiation between MSC states of self-renewal and osteogenesis. Further, we postulate, from ezrin observations, that potential cytoskeleton decoupling from the membrane during changes in adhesion dynamics can accelerate the commitment to differentiation.
We illustrate that we can refine our protocols by switching from FMOC to PEG to create a surface that is both amenable to longer-term dynamic culture and is made from all biocompatible building blocks. This, and the ability to control degree of cleavage by switching peptide sequence (Supplementary Figure 6), is a clear advantage of our surfaces.
We present a dynamic surface that clearly shows that the adhesion/tension balance relationship between a fibroblast (the “lab weed”) and MSCs (a stem cell with major regenerative potential) is small. It is thus exciting that materials can be designed to enhance MSC growth and to study lineage commitment in a dynamic manner.
Materials and Methods
Unless otherwise stated, reagents are from Sigma, UK. Raw data can be found at doi.org/10.5525/gla.researchdata.324.
Surface Modification
Substrates were synthesized as previously described40 using FMOC protected l-amino acids. Glass coverslips were sonicated in acetone, ethanol, methanol, and then deionized water (20 min each). Afterward, coverslips were cleaned for 1 h using a 3:7 piranha solution of 30% hydrogen peroxide and concentrated sulfuric acid to remove organic contaminants and then individually washed in copious amounts of deionized water, dried under nitrogen, and left at 75 °C overnight. Once dry, surfaces were functionalized with amine groups as per Piehler et al.,49 to facilitate direct attachment of amino acids during SPPS. To achieve this, surfaces were silanized using (3-glycidyloxypropyl)trimethoxysilane at 37 °C for 1 h and washed with acetone and dried under nitrogen. A diamine-functionalized polyethylene glycol powder (O,O′-bis(2-aminoethyl)octadecaethylene glycol, PEG; CAS no. 892154-56-2) was melted onto the surfaces at 75 °C for 48 h to attach the PEG linker through reaction of the epoxy groups on the surface, with the amine groups on the PEG. Surfaces were cleaned in deionized water to wash off the unbound PEG and then dried under nitrogen.
To build up the peptide chain using SPPS, a three-step procedure was applied. In step 1, the first FMOC-protected amino acid (0.2 mmol) was coupled to the PEG monolayer in a solution of ethyl(hydroxyimino)cyanoacetate (0.4 mmol) and N,N′-diisopropylcarbodiimide (0.4 mmol) per 10 mL of anhydrous N,N-dimethylformamide (DMF). Samples were submerged in solution for 2 h and gently agitated on an orbital shaker to allow continued mixing of reagents and removal of byproducts from the sample surface. After this time, samples were rinsed in DMF, ethanol, methanol, and DMF (5 min each using agitation). A fresh reaction solution containing the same amino acid was prepared and added to samples, which were then left overnight under the same conditions described above. Washing stages using DMF, ethanol, methanol, and DMF were previously outlined.
For the second step, FMOC groups were removed (deprotected) using piperidine (20% in DMF) for 2 h under agitation, followed by washing steps. Subsequent additions of FMOC-protected amino acids were carried out repeating steps 1 and 2 until the desired peptide sequence was obtained. The terminating FMOC groups were left in place. The final step (step 3) was to remove side-chain protecting groups on aspartic acid and glutamic acid residues (O-tert-butyl; OtBu) and arginine (pentamethyldihydrobenzofuran-5-sulfonyl; Pbf) with a 90% solution of aqueous trifluoroacetic acid for 4 h. Samples were washed and dried and then stored under vacuum in a desiccator or used straight away. For surfaces terminating in a PEG blocking group (i.e., PEG-AARGD−), the peptide chain was built up as per the method for FMOC surfaces with an additional step to remove the terminating FMOC with piperidine. PEG (O-methyl-O′-succinyl polyethylene glycol 2000, CAS no. 31961-02-1) was then added to the terminal amino acid prior to the side-chain protecting groups being removed.
FMOC and PEG blocking groups were removed in situ by enzymatic cleavage using porcine pancreatic elastase (Worthington Biochemical), which was reconstituted in basic culture media and filtered through 0.22 μm. Throughout this work, the same bottle was used and certified as having an enzymatic activity of 4.61 units/mg, where 1 unit (U) converts 1 μmol of N-succinyltrialynyl-p-nitroanilide per minute at 25 °C.
Stepwise Monitoring of Solid-Phase Peptide Synthesis
Water Contact Angle
Water contact angle was carried out using the sessile drop technique with a KSV CAM 100 contact angle goniometer (KSV Instruments, USA). High contrast images of static water droplets were recorded, and CAM 100 software was used to apply a circular fit to the droplet outline to determine contact angles across a series of measurements. A total of three droplets were recorded per surface (25 frames per droplet) and three of each surface used. Averages were pooled for the main data.
Solid-State Fluorescence Spectroscopy
After each coupling and deprotection stage, samples were taken from the bulk batch after the methanol washing stage and rinsed in distilled water, followed by drying under nitrogen. Samples were analyzed using fluorescence spectroscopy to confirm the attachment of the FMOC-protected amino acids and removal of the FMOC group during coupling and deprotection stages. This technique is as described in literature by Zelzer et al.,50 taking advantage of the fluorescent properties of the FMOC group. Fluorescence spectra were measured at room temperature using a JASCO FP-6500 spectrophotometer (JASCO, JPN) with spectra manager software. Samples were attached to a glass microscope slide inserted into a custom-made rotatable holder within the spectrophotometer chamber. Samples were orientated at 30° to the incident light to limit the amount of reflected excitation light hitting the detector. Excitation of the surface-tethered FMOC groups was carried out using an excitation wavelength of 270 nm with a slit width of 20 nm. Three spectra were recorded at each stage of synthesis using three different samples.
Cell Culture
STRO-1 Selected MSCs
Skeletal STRO-1+ MSCs were derived from bone marrow obtained from hematologically normal patients undergoing routine total hip replacement surgery with the approval of Southampton General Hospital Ethics Committee; only tissue that is normally discarded was used. Cells were aspirated from trabecular bone marrow samples and centrifuged at 250g for 4 min at 4 °C. The cell pellet was resuspended in α-MEM and passed through a 70 μm pore nylon mesh (BD Biosciences). Red blood cells were removed by centrifugation with lymphoprep gradient solution (Robbins Scientific) and the remaining cells in the buffy layer resuspended in 10 mL of blocking solution (4-(2-hydroxyethyl)-1-piperazine ethanesulfonic acid, HEPES) saline solution with 5% v/v fetal calf serum, 5% v/v human serum, and 1% w/v bovine serum albumin (BSA). Afterward, the cells were incubated with a STRO-1 antibody in hybridoma supernatant (hybridoma courtesy of Dr. Beresford, University of Bath) and flushed with magnetic cell separation buffer (Miltenyi Biotec) to remove any excess antibody. The cells were incubated with human anti-IgM magnetic microbeads (Miltenyi Biotec, UK) and added to a magnetic column; the eluent was collected as the STRO-1– fraction. After being washed with MACs buffer without the magnetic field, the eluted cell population was collected as the STRO-1+ fraction. Skeletal MSCs purchased from Promocell were used for metabolomics experiments.
MSC Maintenance and Experiment Preparation
MSCs were maintained at 37 °C and 5% CO2 in α-MEM (PAA Laboratories) supplemented with 10% v/v fetal bovine serum (FBS) and 2% v/v antibiotic mix (60% v/v l-glutamine, 35% v/v penicillin–streptomysin, and 5% v/v ampotericin B). For all experiments, cells were rinsed in HEPES saline solution (150 mM NaCl, 5 mM KCl, 5 mM glucose, 10 mM HEPES, and 0.5% v/v phenol red indicator adjusted to pH 7.5), followed by 4 mL of trypsin–versene solution (0.5% v/v trypsin and versene: 150 mM NaCl, 5 mM KCl, 5 mM glucose, 10 mM HEPES, 1 mM ethylenediaminetetraacetic acid, and 0.5% v/v phenol red indicator adjusted to pH 7.5) until cells were detached from the tissue culture flask. Detached cells were transferred to a sterile falcon tube and centrifuged at 376g for 4 min. The supernatant was discarded and the cell pellet resuspended in 5 mL of fresh α-MEMs. Cell numbers were counted using a Neubaur hemocytometer and seeded as per experimental setup. Prior to use, substrates were sterilized with 70% ethanol (3 × 5 min) and then washed with HEPES saline solution and basal α-MEM.
Coomassie Blue Staining
To assess cell adhesion, MSCs were fixed 10% v/v formaldehyde/PBS for 15 min at 37 °C and then stained with coomassie blue protein dye (0.5% w/v coomassie brilliant blue R-250 dissolved in 4:1 methanol/acetic acid and filtered with Whatman filter paper) for 15 min at room temperature. Excess stain was removed by washing samples with water until areas around the cells were clear. Images were taken using a Zeiss Axiovert inverted light microscope at 10× magnification (0.25 NA) with a Qimaging digital CCD camera (Qimaging, Canada) and Qcapture software; n = 3.
Elastase Tolerance
For elastase tolerance, MSCs were seeded onto plain glass coverslips and left to adhere for 48 h. Porcine pancreatic elastase was dissolved in α-MEMs at 37 °C as a stock solution and then filter sterilized through a 0.22 μm syringe filter. The stock solution was diluted across a concentration range of 1.0–0.1 mg/mL (4.61–0.461 units) and added to samples in place of α-MEMs (controls were maintained in basic α-MEMs). MSCs were incubated for a further 24 h and examined for detachment using a Zeiss Axiovert inverted light microscope at 10× magnification (0.25 NA) with a Qimaging digital CCD camera (Qimaging, Canada) and Qcapture software; n = 3.
Live/Dead Staining
For live/dead staining during elastase tolerance, cells were seeded onto plain glass coverslips as described in Elastase Tolerance section and cultured for 24 h in α-MEM, followed by a further 24 h of culture in medium containing the titrated concentrations of elastase (4.61–0.461 units and controls). Additional “dead” control cells were cultured in the absence of elastase, and 70% ethanol was added to kill the cells prior to staining. Culture medium was removed, and cells were washed twice in warm phosphate-buffered saline (PBS), which was then replaced with live/dead assay reagents (2 μM calcein AM and 4 μM ethidium homodimer-1 in PBS) and incubated at room temperature until color development occurred (approximately 15 min in the dark). The stain was removed, and the cells were rinsed twice in warm PBS and imaged using a Zeiss Axiovert fluorescence microscope.
For live/dead staining of cells cultured on the panel of surfaces, cells were cultured on plain controls, PEG18, RGD, and RGE controls, FMOC-RGD, and FMOC-RGE (see Supplementary Figure 2 for corresponding peptide sequences) for 24 h in α-MEM. Dead control cells were prepared by adding 70% ethanol to cells cultured on plain coverslips after 24 h. The cells were stained and imaged as described above.
Proliferation Assay
Cells were cultured on plain glass coverslips, plain controls, PEG18, RGD, and RGE controls, FMOC-RGD, and FMOC-RGE substrates in α-MEM and pulse-labeled with 10 μM 5-bromo-2-deoxyuridine (BrdU) for 4 h prior to fixation for 1 day and 4 day time points. BrdU-positive MSCs were visualized as described in Immunocytochemistry.
Phenotype Characterization Pre- and Post-trigger
Cells were seeded onto plain glass coverslips, RGD controls, and FMOC-RGD surfaces and cultured in standard α-MEM (see MSC Maintenance and Experiment Preparation for culture media composition). To cleave the FMOC blocking group, the culture medium was replaced with medium containing 0.1 mg/mL elastase for 2 days and then replaced with standard α-MEM for the remaining length of the culture. The cells were cultured for a total of 2 weeks.
Induction Medium Experiment
Cells were cultured for 2 weeks on plain controls and FMOC-RGD surfaces in standard α-MEM. After this time, samples were divided into three groups: control groups cultured in standard α-MEM, osteogenic cultures incubated with osteogenic induction media (350 μM ascorbate-2-phosphate, 0.1 μM dexamethasone in DMEM with 10% FBS), and adipogenic cultures that were alternated between adipogenic induction media (1 μM dexamethasone, 1.7 nM insulin, 200 μM indomethacin, 500 μM isobutylmethylxanthine in DMEM with 10% FBS, l-glutamine and antibiotics) and maintenance medium (1.7 nM insulin in DMEM with 10% FBS, 200 mM l-glutamine and antibiotics). The three groups were cultured for 4 weeks before fixation; n = 3 replicates of each surface per group.
Cell Population Marker Analysis
Cells were seeded onto plain controls, RGD controls, and FMOC-RGD substrates. Half of the FMOC-RGD surfaces were cleaved by replacing the culture medium with medium containing 0.1 mg/mL elastase after 2 days of culture. Cells were fixed after 24 h, 3 days, and 5 days of culture as per the method described in Immunocytochemistry.
Immunocytochemistry
Samples were washed with PBS and fixed with 10% v/v formaldehyde/PBS for 15 min at 37 °C. Cells were permeabilized at 4 °C for 5 min (30 mM sucrose, 50 mM NaCl, 3 mM MgCl2·6H2O, 20 mM HEPES, and 0.5% v/v Triton X-100 in PBS adjusted to pH 7.2), and nonspecific binding epitopes were blocked with 1% w/v BSA/PBS for 15 min at 37 °C (this step was omitted for anti-BrdU staining). Primary antibodies were made up in PBS/BSA with rhodamine–phalloidin (1:500; Molecular Probes) with either
-
1.
Mouse monoclonal antivinculin IgG (1:150; Sigma) for adhesion analysis.
-
2.
Mouse monoclonal anti-phosphomyosin IgG (1:200; Cell Signaling Technology) for phosphomyosin studies.
-
3.
Mouse monoclonal anti-STRO-1/OPN/OCN IgG (1:50; Insight Biotechnology) or rabbit polyclonal anti-ALCAM IgG (1:50; Epitomics) for phenotype analysis and cell population marker analysis.
-
4.
Mouse monoclonal anti-BrdU (clone BU-1, 1:100 in nuclease solution, prepared according to the manufacturer’s instructions in kit RPN202; GE Healthcare) for proliferation studies. Rhodamine–phalloidin was added with the secondary rather than the primary antibody.
-
5.
Rabbit polyclonal anti-fatty acid binding protein (FABP; 1:50; Abcam) or rabbit polyclonal anti-collagen II (COL2A, 1:50; Insight Bio) for cell phenotype pre- and post-trigger. Rhodamine–phalloidin was added with the secondary antibody for collagen II.
-
6.
Rabbit polyclonal anti-RUNX2 (1:50; Insight Bio) or mouse monoclonal anti-vimentin (1:50; Sigma) for elastase experiments.
-
7.
Rabbit polyclonal anti-ezrin/radixin/moesin (Cell Signaling Technology; 1:50) for ezrin expression.
Samples were incubated for 1 h (1.5 h for anti-BrdU) at 37 °C, after which time they were washed in 0.5% v/v Tween 20/PBS (PBST, 3 × 5 min under gentle agitation) to minimize background labeling. Horse biotinylated anti-mouse IgG (1:50; Vector Laboratories) or horse biotinylated anti-rabbit IgG (Vector Laboratories) BSA/PBS was added to samples and incubated for 1 h at 37 °C. After the washing stages, samples were incubated for 30 min at 4 °C with fluorescein isothiocyanate streptavidin (FITC; 1:50; Vector Laboratories) in BSA/PBS followed by a final washing stage. Coverslips were placed on glass slides in 4′6-diamidino-2-phenylindole mountant (Vector Laboratories).
Cells imaged for adhesions analysis were visualized using a Zeiss Axiophot fluorescence microscope at 20× magnification (0.40 NA). Images were captured using an Evolution QEi digital monochromatic CCD camera (Media Cybernetics, USA) with Qcapture imaging software. Cells imaged for phosphomyosin and phenotype analysis were imaged with a Zeiss Axiovert fluorescence microscope at 20× magnification (0.50 NA) and studies at 40× (0.40 NA). Axiovert images were taken using an Evolution QEi digital monochromatic CCD camera (Media Cybernetics, USA) with ImagePro software.
Double Immunostaining for Colocalization Studies
Cells seeded on FMOC-RGD substrates were cultured for 2 days. After this time, control cells were cultured in standard culture media while test samples were incubated with 0.1 mg/mL elastase for 24 and 48 h. Colocalization of BMPR1A with the integrins β1 and β5 was performed using immunocytochemistry in the previous section. After fixation, samples were incubated with a primary antibody cocktail consisting of rabbit polyclonal anti-BMPR1A (Thermo Scientific; 1:50), mouse monoclonal anti-integrin β1 (Thermo Scientific; 1:50), and mouse anti-integrin αvβ5 (R&D system, 1:50) in 1% of BSA/PBS. Secondary antibodies were Texas red anti-mouse (Vector Laboratories; 1:50) for integrin β1 and β5 and biotinylated anti-rabbit (Vector laboratories) conjugated with FITC for BMPR1A.
Cells imaged for colocalization of BMPR1A with integrin β1 and β5 were visualized using a Zeiss Axiophot fluorescence microscope at 40× magnification (0.75 NA). Images were captured using an Evolution QEi digital monochromatic CCD camera (Media Cybernetics, USA) with Qcapture imaging software.
RNA Interference
RNA interference was performed using nontargeting siRNA (cat no. D001810-01-05) and human ezrin–siRNA (cat no. L-017370-00) purchased from GE Healthcare. Transfections were carried out using DharmaFECT Transfection Reagents (GE Healthcare) according to the manufacturer’s instructions.
In Cell Western
Cells on substrates were washed with PBS and fixed with 10% v/v formaldehyde/PBS for 15 min at 37 °C. Cells were permeabilized using precooled methanol at 4 °C for 10 min, and nonspecific binding epitopes were blocked with 1% milk protein in 0.1% Tween 20/PBS (PBST) for 1 h at room temperature. Cells were then washed three times (3 × 5 min) with 0.1% PBST. Primary antibodies diluted in 1% milk/PBST containing cell tag 700CW stain (1:500; LI-COR, cat no. 926-41090) with either
-
1.
Rabbit polyclonal anti-ezrin/radixin/moesin (Cell Signaling Technology; 1:50) for ezrin knock-down efficiency measurement.
-
2.
Rabbit polyclonal RUNX2 (Santa Cruz; 1:50) expression in ezrin knock-down cells.
-
3.
Rabbit polyclonal phospho-RUNX2 pSer465 (Thermo Scientific; 1:50) for phospho-UNX2 expression in ezrin knock-down cells.
Cells with primary antibodies were incubated at room temperature for 1 h and then washed with 0.1% PBST three times. After being washed, cells with secondary antibody—either IRDye 800CW, goat anti-mouse (LI-COR, cat no. 926-32210), or donkey anti-rabbit (LI-COR, cat no. 926-32213) diluted in 1% milk/PBST at 1:1000 were incubated at room temperature for 1 h or at 4 °C for overnight. After the washing stage, cells were subjected to a LI-COR Odyssey Sa (0157) scanner. The protein of interest was scanned at channel 800 and CellTag at channel 700 (scan parameters: focus offset = 2.0 mm, scan resolution = 100 μm, intensity = 12). Data were collected in integrated intensity (IntegInten) and analyzed by one-way analysis of variance (ANOVA) and Dunn’s post-hoc test applied where significance was determined as P < 0.05.
Image Analysis
Fluorescence microscopy images were exported to Adobe Photoshop for the purpose of labeling and superimposing color channels. For size analysis, actin images were exported to ImageJ (http://rsbweb.nih.gov/ij/download.html) to calculate cell area using the threshold tool. For adhesion analysis, vinculin images were exported to Adobe Photoshop, and each individual adhesion was traced with a 1 pixel width line to create an adhesion mask superimposed over the background image. ImageJ was then used to determine total adhesion numbers and length; individual subtypes were plotted as a percentage of the overall number of adhesions recorded. For the proliferation analysis, the percentage of BrdU-positive cells was quantified for at least 150 cells per sample type and normalized to determine the percentage change relative to the glass controls. Analysis of the maintenance of STRO-1+ expression of staining over time was performed by allocating cells into categories (at least 50 cells per surface type), indicating the features of the staining.
In order to determine phosphomyosin expression, or STRO-1+ expression for cell population analysis (at least 50 cells per sample type), grayscale images were exported into ImageJ and individual cells were selected with the polygon tool. Using the method described in Burgess et al.,51,52 phosphomyosin expression was calculated using integrated density (ID) values where ID = (area × mean gray value). Calculations were then corrected for background fluorescence using the formula ID – (cell area × ID of background fluorescence). In order to quantify the expression of phenotypic markers, fluorescence images were exported to ImageJ and highlighted with the threshold tool. Integrated density values (area × mean gray value) were recorded, and these values were divided by the number of nuclei to average fluorescence across the number of cells in the same field of view. As the background fluorescence could not be recorded because of cell confluency, only images taken at similar exposure levels were used.
Data were analyzed by ANOVA and Dunn’s post-hoc test applied or t-tests to identify any significant differences between the groups, where significance was determined as P < 0.5.
MTT Assay
After 5 days, 100 μL of 5 mg/mL MTT (methylthiazolyldiphenyl tetrazolium bromide) solution in complete cell culture media was added to the cells for 2 h. After this time, the medium was removed and replaced with DMSO for 5 min. Liquid from each well was then analyzed at 570 nm (background set to 670 nm) and optical density reported.
Metabolomics
For metabolomic analysis, substrates were removed from the well plates and transferred to new sterile plates so that only cells that were attached to the substrates were used in the analysis. Substrates were washed once with warmed PBS, and then 0.5 mL of ice-cold extraction solvent (chloroform/methanol/water at 1:3:1 v/v) was added to the wells. Plates were sealed with parafilm to minimize evaporation and placed on a rotary shaker for 1 h at 4 °C. After this time, the extraction solvent was transferred to sterile 0.5 mL Eppendorf tubes and centrifuged at 13 000g for 5 min to remove cell debris. The supernatant was transferred to LC vials; otherwise, samples were stored at −80 °C in Eppendorf tubes until use. For elastase studies, all samples were processed in-well with 150 μL of extraction solvent added to each well. Samples were then processed as above.
All samples were diluted 1 in 2 with acetonitrile prior to being aspirated to HPLC vials; an additional 5 μL of each sample was combined into a single aliquot to be used as a quality control sample. This pooled sample was injected several times throughout the duration of each run in order to monitor metabolite quality and sample degradation. Three standards containing a number of known metabolites were also run alongside unknown samples for the purpose of identifying all other metabolites. Chromatographic separation of metabolites was performed using an UltiMate 3000 RS-LC (Thermo Fisher) with a zwitterionic hydrophilic interaction liquid chromatography (ZIC-HILIC) column (C18 150 × 4.6 mm; Merck Sequant) as the stationary phase, 1% v/v formic acid in acetonitrile as the organic mobile phase, and 1% v/v aqueous formic acid as the aqueous mobile phase. The mobile phase was run as a gradient over 46 min (Table 1). Injection volumes were 10 μL, and a ZIC-HILIC C8 20 × 2.0 guard column was used to protect the main column from impurities; chromatography columns were maintained at 25 °C.
Table 1. LC–MS Mobile Phase Parametersa.
| time (min) | aqueous (%) | organic (%) | flow rate (mL/min) | gradient curve |
|---|---|---|---|---|
| 0 | 20 | 80 | 0.3 | 1 |
| 30 | 20 | 80 | 0.3 | 6 |
| 32 | 80 | 20 | 0.3 | 6 |
| 40 | 95 | 5 | 0.3 | 6 |
| 42 | 95 | 5 | 0.3 | 6 |
Chromatographic separation of metabolites was carried out using an organic (1% v/v formic acid in acetonitrile)/aqueous (1% v/v aqueous formic acid) mobile phase run over a period of 46 min. Table data show the percentage of each mobile phase at particular time points, flow rate, and gradient curve conditions.
MS was performed using an Orbitrap Exactive accurate mass mass spectrometer (Thermo Fisher Scientific). Scans were conducted at a mass resolution of 50 000 in both positive and negative ion modes across a range of 70–1400 m/z. Prior to data acquisition, mass calibration was performed in positive and negative modes using a calibration mix containing a number of compounds with known masses across the acquisition range. Data conversion, chromatographic peak selection, and metabolite identification were carried out using the IDEOM/MzMatch Excel interface,53,54 and chromatographic peak intensities (peak area under the curve) were normalized against calculated protein content. Known standards were used to define both mass and retention times of analytes. Putative metabolites were also identified on this basis using predicted retention times as described in Creek et al.(55) MetaboAnalyst56 and Ingenuity pathway analysis were used to generate illustrations.
Time-of-Flight Secondary Ion Mass Spectrometry (ToF-SIMS)
ToF-SIMS analysis was carried out with a ToF-SIMS IV time-of-flight instrument (ION-ToF GmbH). Secondary ions were generated using a primary ion beam from a 25 kV Bi3+ liquid metal ion source with a 1 pA pulsed target current. The primary ion dose was kept below the static limit (less than 2.45 × 10¹² ions/cm2). Built-up surface charge was compensated using an electron gun, producing a flux of low-energy electrons (20 eV). Secondary ions were subjected to a post-acceleration voltage of 10 kV and analyzed with positive polarity with a single stage reflectron analyzer. Images were acquired by rastering the primary ion beam across the sample surface. On each sample, two small scale (500 μm × 500 μm; 2 μm resolution) and one large scale (3 mm × 3 mm; 10 μm resolution) areas were imaged.
The data were processed using Surface Lab 6. Mass spectra were calibrated to known reference peaks from H+, CH3+, C2H5+, C3H7+, and C4H9+. Peaks from the samples were assigned to PEG, FMOC, and the amino acids according to reference data from the literature.40,57,58 Ion intensity images were generated from these ions of interest by the software.
For qualitative assessment of sample uniformity and presence of chemical functionalities, small-scale images (500 μm × 500 μm) were used and the ions associated with amino acids were summed up and combined in a single image. The ion count scale for specific ion images (PEG, FMOC, amino acids) was manually adjusted to the same range for each sample to allow direct comparison. Total ion images were scaled individually.
For semiquantitative assessment of the relative amount of FMOC removed from the surface, the large-scale images (3 mm × 3 mm; one per sample type) were normalized to the total ion counts and divided into four regions of interest (ROI) that correspond to four equally sized, non-overlapping quadrants (1.5 mm × 1.5 mm) of the image. Normalized ion intensities for an FMOC-related ion (C14H11+, m/z = 179) were generated for each ROI by the software to provide four data sets for each sample that were used to calculate a mean and standard deviation for the FMOC ion intensities before and after exposure of FMOC-AARGD and FMOC-FARGD to elastase. These normalized intensities were used to calculate a percentage decrease of FMOC on the two sample types. It should be noted that this method to generate numeric data of surface densities of chemical compounds is sensitive to small amounts of material on the surface but not fully quantitative due to a variety of factors affecting measured ion intensities from ToF-SIMS.
Acknowledgments
J.N.R., H.A., and J.H. are funded by EPSRC DTC scholarships. M.J.D. and R.V.U. are funded by BBSRC Grant BB/K006908/1. R.V.U. is funded by an ERC starting grant (EMERgE/ERC No. 258775). R.O.C.O. is funded by BBSRC (BB/G010579/1). We thank Carol-Anne Smith and Kate White for technical assistance, and David J. Scurr for helping with ToF-SIMS measurements.
Supporting Information Available
The Supporting Information is available free of charge on the ACS Publications website at DOI: 10.1021/acsnano.6b01765.
Supplementary figures and references (PDF)
The authors declare no competing financial interest.
Supplementary Material
References
- Ehninger A.; Trumpp A. The Bone Marrow Stem Cell Niche Grows Up: Mesenchymal Stem Cells And Macrophages Move. J. Exp. Med. 2011, 208, 421–428. 10.1084/jem.20110132. [DOI] [PMC free article] [PubMed] [Google Scholar]
- Bianco P. Bone And The Hematopoietic Niche: A Tale Of Two Stem Cells. Blood 2011, 117, 5281–5288. 10.1182/blood-2011-01-315069. [DOI] [PubMed] [Google Scholar]
- Watt F. M.; Hogan B. L. Out Of Eden: Stem Cells And Their Niches. Science 2000, 287, 1427–1430. 10.1126/science.287.5457.1427. [DOI] [PubMed] [Google Scholar]
- Bianco P.; Cao X.; Frenette P. S.; Mao J. J.; Robey P. G.; Simmons P. J.; Wang C. Y. The Meaning, The Sense And The Significance: Translating The Science Of Mesenchymal Stem Cells Into Medicine. Nat. Med. 2013, 19, 35–42. 10.1038/nm.3028. [DOI] [PMC free article] [PubMed] [Google Scholar]
- Mcmurray R. J.; Gadegaard N.; Tsimbouri P. M.; Burgess K. V.; Mcnamara L. E.; Tare R.; Murawski K.; Kingham E.; Oreffo R. O.; Dalby M. J. Nanoscale Surfaces For The Long-Term Maintenance Of Mesenchymal Stem Cell Phenotype And Multipotency. Nat. Mater. 2011, 10, 637–644. 10.1038/nmat3058. [DOI] [PubMed] [Google Scholar]
- Giam L. R.; Massich M. D.; Hao L.; Shin Wong L.; Mader C. C.; Mirkin C. A. Scanning Probe-Enabled Nanocombinatorics Define The Relationship Between Fibronectin Feature Size And Stem Cell Fate. Proc. Natl. Acad. Sci. U. S. A. 2012, 109, 4377–4382. 10.1073/pnas.1201086109. [DOI] [PMC free article] [PubMed] [Google Scholar]
- Huang J.; Grater S. V.; Corbellini F.; Rinck S.; Bock E.; Kemkemer R.; Kessler H.; Ding J.; Spatz J. P. Impact Of Order And Disorder In RGD Nanopatterns On Cell Adhesion. Nano Lett. 2009, 9, 1111–1116. 10.1021/nl803548b. [DOI] [PMC free article] [PubMed] [Google Scholar]
- Frith J. E.; Mills R. J.; Cooper-White J. J. Lateral Spacing Of Adhesion Peptides Influences Human Mesenchymal Stem Cell Behaviour. J. Cell Sci. 2012, 125, 317–327. 10.1242/jcs.087916. [DOI] [PubMed] [Google Scholar]
- Dalby M. J.; Gadegaard N.; Oreffo R. O. Harnessing Nanotopography And Integrin-Matrix Interactions To Influence Stem Cell Fate. Nat. Mater. 2014, 13, 558–569. 10.1038/nmat3980. [DOI] [PubMed] [Google Scholar]
- Murphy W. L.; Mcdevitt T. C.; Engler A. J. Materials As Stem Cell Regulators. Nat. Mater. 2014, 13, 547–557. 10.1038/nmat3937. [DOI] [PMC free article] [PubMed] [Google Scholar]
- Mcbeath R.; Pirone D. M.; Nelson C. M.; Bhadriraju K.; Chen C. S. Cell Shape, Cytoskeletal Tension, And Rhoa Regulate Stem Cell Lineage Commitment. Dev. Cell 2004, 6, 483–495. 10.1016/S1534-5807(04)00075-9. [DOI] [PubMed] [Google Scholar]
- Engler A. J.; Sen S.; Sweeney H. L.; Discher D. E. Matrix Elasticity Directs Stem Cell Lineage Specification. Cell 2006, 126, 677–689. 10.1016/j.cell.2006.06.044. [DOI] [PubMed] [Google Scholar]
- Trappmann B.; Gautrot J. E.; Connelly J. T.; Strange D. G.; Li Y.; Oyen M. L.; Cohen Stuart M. A.; Boehm H.; Li B.; Vogel V.; Spatz J. P.; Watt F. M.; Huck W. T. Extracellular-Matrix Tethering Regulates Stem-Cell Fate. Nat. Mater. 2012, 11, 642–649. 10.1038/nmat3339. [DOI] [PubMed] [Google Scholar]
- Huebsch N.; Arany P. R.; Mao A. S.; Shvartsman D.; Ali O. A.; Bencherif S. A.; Rivera-Feliciano J.; Mooney D. J. Harnessing Traction-Mediated Manipulation Of The Cell/Matrix Interface To Control Stem-Cell Fate. Nat. Mater. 2010, 9, 518–526. 10.1038/nmat2732. [DOI] [PMC free article] [PubMed] [Google Scholar]
- Swift J.; Ivanovska I. L.; Buxboim A.; Harada T.; Dingal P. C.; Pinter J.; Pajerowski J. D.; Spinler K. R.; Shin J. W.; Tewari M.; Rehfeldt F.; Speicher D. W.; Discher D. E. Nuclear Lamin-A Scales With Tissue Stiffness And Enhances Matrix-Directed Differentiation. Science 2013, 341, 1240104. 10.1126/science.1240104. [DOI] [PMC free article] [PubMed] [Google Scholar]
- Khetan S.; Guvendiren M.; Legant W. R.; Cohen D. M.; Chen C. S.; Burdick J. A. Degradation-Mediated Cellular Traction Directs Stem Cell Fate In Covalently Crosslinked Three-Dimensional Hydrogels. Nat. Mater. 2013, 12, 458–465. 10.1038/nmat3586. [DOI] [PMC free article] [PubMed] [Google Scholar]
- Kilian K. A.; Bugarija B.; Lahn B. T.; Mrksich M. Geometric Cues For Directing The Differentiation Of Mesenchymal Stem Cells. Proc. Natl. Acad. Sci. U. S. A. 2010, 107, 4872–7. 10.1073/pnas.0903269107. [DOI] [PMC free article] [PubMed] [Google Scholar]
- Lee J.; Abdeen A. A.; Tang X.; Saif T. A.; Kilian K. A. Geometric Guidance Of Integrin Mediated Traction Stress During Stem Cell Differentiation. Biomaterials 2015, 69, 174–1183. 10.1016/j.biomaterials.2015.08.005. [DOI] [PMC free article] [PubMed] [Google Scholar]
- Wen J. H.; Vincent L. G.; Fuhrmann A.; Choi Y. S.; Hribar K. C.; Taylor-Weiner H.; Chen S.; Engler A. J. Interplay Of Matrix Stiffness And Protein Tethering In Stem Cell Differentiation. Nat. Mater. 2014, 13, 979–987. 10.1038/nmat4051. [DOI] [PMC free article] [PubMed] [Google Scholar]
- Curran J. M.; Chen R.; Hunt J. A. The Guidance Of Human Mesenchymal Stem Cell Differentiation In Vitro By Controlled Modifications To The Cell Substrate. Biomaterials 2006, 27, 4783–4793. 10.1016/j.biomaterials.2006.05.001. [DOI] [PubMed] [Google Scholar]
- Benoit D. S.; Schwartz M. P.; Durney A. R.; Anseth K. S. Small Functional Groups For Controlled Differentiation Of Hydrogel-Encapsulated Human Mesenchymal Stem Cells. Nat. Mater. 2008, 7, 816–823. 10.1038/nmat2269. [DOI] [PMC free article] [PubMed] [Google Scholar]
- Chaudhuri O.; Gu L.; Klumpers D.; Darnell M.; Bencherif S. A.; Weaver J. C.; Huebsch N.; Lee H. P.; Lippens E.; Duda G. N.; Mooney D. J. Hydrogels With Tunable Stress Relaxation Regulate Stem Cell Fate And Activity. Nat. Mater. 2016, 15, 326–334. 10.1038/nmat4489. [DOI] [PMC free article] [PubMed] [Google Scholar]
- Das R. K.; Gocheva V.; Hammink R.; Zouani O. F.; Rowan A. E. Stress-Stiffening-Mediated Stem-Cell Commitment Switch In Soft Responsive Hydrogels. Nat. Mater. 2016, 15, 318–325. 10.1038/nmat4483. [DOI] [PubMed] [Google Scholar]
- Dalby M. J.; Gadegaard N.; Tare R.; Andar A.; Riehle M. O.; Herzyk P.; Wilkinson C. D. W.; Oreffo R. O. C. The Control Of Human Mesenchymal Cell Differentiation Using Nanoscale Symmetry And Disorder. Nat. Mater. 2007, 6, 997–1003. 10.1038/nmat2013. [DOI] [PubMed] [Google Scholar]
- Tsimbouri P. M.; Mcmurray R. J.; Burgess K. V.; Alakpa E. V.; Reynolds P. M.; Murawski K.; Kingham E.; Oreffo R. O.; Gadegaard N.; Dalby M. J. Using Nanotopography And Metabolomics To Identify Biochemical Effectors Of Multipotency. ACS Nano 2012, 6, 10239–10249. 10.1021/nn304046m. [DOI] [PubMed] [Google Scholar]
- Friedenstein A. J. Precursor Cells Of Mechanocytes. Int. Rev. Cytol. 1976, 47, 327–359. 10.1016/S0074-7696(08)60092-3. [DOI] [PubMed] [Google Scholar]
- Lee T. T.; Garcia J. R.; Paez J. I.; Singh A.; Phelps E. A.; Weis S.; Shafiq Z.; Shekaran A.; Del Campo A.; Garcia A. J. Light-Triggered In Vivo Activation Of Adhesive Peptides Regulates Cell Adhesion, Inflammation And Vascularization Of Biomaterials. Nat. Mater. 2015, 14, 352–360. 10.1038/nmat4157. [DOI] [PMC free article] [PubMed] [Google Scholar]
- Liu D.; Xie Y.; Shao H.; Jiang X. Using Azobenzene-Embedded Self-Assembled Monolayers To Photochemically Control Cell Adhesion Reversibly. Angew. Chem., Int. Ed. 2009, 48, 4406–4408. 10.1002/anie.200901130. [DOI] [PubMed] [Google Scholar]
- Deforest C. A.; Polizzotti B. D.; Anseth K. S. Sequential Click Reactions For Synthesizing And Patterning Three-Dimensional Cell Microenvironments. Nat. Mater. 2009, 8, 659–664. 10.1038/nmat2473. [DOI] [PMC free article] [PubMed] [Google Scholar]
- Petersen S.; Alonso J. M.; Specht A.; Duodu P.; Goeldner M.; Del Campo A. Phototriggering Of Cell Adhesion By Caged Cyclic RGD Peptides. Angew. Chem., Int. Ed. 2008, 47, 3192–3195. 10.1002/anie.200704857. [DOI] [PubMed] [Google Scholar]
- Kloxin A. M.; Kasko A. M.; Salinas C. N.; Anseth K. S. Photodegradable Hydrogels For Dynamic Tuning Of Physical And Chemical Properties. Science 2009, 324, 59–63. 10.1126/science.1169494. [DOI] [PMC free article] [PubMed] [Google Scholar]
- Deforest C. A.; Tirrell D. A. A Photoreversible Protein-Patterning Approach For Guiding Stem Cell Fate In Three-Dimensional Gels. Nat. Mater. 2015, 14, 523–531. 10.1038/nmat4219. [DOI] [PubMed] [Google Scholar]
- Yeo W. S.; Mrksich M. Electroactive Substrates That Reveal Aldehyde Groups For Bio-Immobilization. Adv. Mater. 2004, 16, 1352–1356. 10.1002/adma.200400591. [DOI] [Google Scholar]
- Mendes P. M. Cellular Nanotechnology: Making Biological Interfaces Smarter. Chem. Soc. Rev. 2013, 42, 9207–9218. 10.1039/c3cs60198f. [DOI] [PMC free article] [PubMed] [Google Scholar]
- Weis S.; Lee T. T.; Del Campo A.; Garcia A. J. Dynamic Cell-Adhesive Microenvironments And Their Effect On Myogenic Differentiation. Acta Biomater. 2013, 9, 8059–8066. 10.1016/j.actbio.2013.06.019. [DOI] [PubMed] [Google Scholar]
- Maitz M. F.; Freudenberg U.; Tsurkan M. V.; Fischer M.; Beyrich T.; Werner C. Bio-Responsive Polymer Hydrogels Homeostatically Regulate Blood Coagulation. Nat. Commun. 2013, 4, 2168. 10.1038/ncomms3168. [DOI] [PMC free article] [PubMed] [Google Scholar]
- Bacharouche J.; Badique F.; Fahs A.; Spanedda M. V.; Geissler A.; Malval J. P.; Vallat M. F.; Anselme K.; Francius G.; Frisch B.; Hemmerle J.; Schaaf P.; Roucoules V. Biomimetic Cryptic Site Surfaces For Reversible Chemo- And Cyto-Mechanoresponsive Substrates. ACS Nano 2013, 7, 3457–3465. 10.1021/nn400356p. [DOI] [PubMed] [Google Scholar]
- Davila J.; Chassepot A.; Longo J.; Boulmedais F.; Reisch A.; Frisch B.; Meyer F.; Voegel J. C.; Mesini P. J.; Senger B.; Metz-Boutigue M. H.; Hemmerle J.; Lavalle P.; Schaaf P.; Jierry L. Cyto-Mechanoresponsive Polyelectrolyte Multilayer Films. J. Am. Chem. Soc. 2012, 134, 83–86. 10.1021/ja208970b. [DOI] [PubMed] [Google Scholar]
- Zelzer M.; Todd S. J.; Hirst A. R.; Mcdonald T. O.; Ulijn R. V. Enzyme Responsive Materials: Design Strategies And Future Developments. Biomater. Sci. 2013, 1, 11–39. 10.1039/C2BM00041E. [DOI] [PubMed] [Google Scholar]
- Todd S. J.; Scurr D. J.; Gough J. E.; Alexander M. R.; Ulijn R. V. Enzyme-Activated RGD Ligands On Functionalized Poly(Ethylene Glycol) Monolayers: Surface Analysis And Cellular Response. Langmuir 2009, 25, 7533–7539. 10.1021/la900376h. [DOI] [PubMed] [Google Scholar]
- Zelzer M.; Scurr D. J.; Alexander M. R.; Ulijn R. V. Development And Validation Of A Fluorescence Method To Follow The Build-Up Of Short Peptide Sequences On Solid 2D Surfaces. ACS Appl. Mater. Interfaces 2012, 4, 53–58. 10.1021/am2015266. [DOI] [PubMed] [Google Scholar]
- Bershadsky A. D.; Tint I. S.; Neyfakh A. A. Jr.; Vasiliev J. M. Focal Contacts Of Normal And RSV-Transformed Quail Cells. Hypothesis Of The Transformation-Induced Deficient Maturation Of Focal Contacts. Exp. Cell Res. 1985, 158, 433–444. 10.1016/0014-4827(85)90467-7. [DOI] [PubMed] [Google Scholar]
- Yang J.; Mcnamara L. E.; Gadegaard N.; Alakpa E. V.; Burgess K. V.; Meek R. M.; Dalby M. J. Nanotopographical Induction Of Osteogenesis Through Adhesion, Bone Morphogenic Protein Cosignaling, And Regulation Of Micrornas. ACS Nano 2014, 8, 9941–9953. 10.1021/nn504767g. [DOI] [PubMed] [Google Scholar]
- Malmstrom J.; Lovmand J.; Kristensen S.; Sundh M.; Duch M.; Sutherland D. S. Focal Complex Maturation And Bridging On 200 Nm Vitronectin But Not Fibronectin Patches Reveal Different Mechanisms Of Focal Adhesion Formation. Nano Lett. 2011, 11, 2264–2271. 10.1021/nl200447q. [DOI] [PubMed] [Google Scholar]
- Yanes O.; Clark J.; Wong D. M.; Patti G. J.; Sanchez-Ruiz A.; Benton H. P.; Trauger S. A.; Desponts C.; Ding S.; Siuzdak G. Metabolic Oxidation Regulates Embryonic Stem Cell Differentiation. Nat. Chem. Biol. 2010, 6, 411–417. 10.1038/nchembio.364. [DOI] [PMC free article] [PubMed] [Google Scholar]
- Reyes J. M.; Fermanian S.; Yang F.; Zhou S. Y.; Herretes S.; Murphy D. B.; Elisseeff J. H.; Chuck R. S. Metabolic Changes In Mesenchymal Stem Cells In Osteogenic Medium Measured By Autofluorescence Spectroscopy. Stem Cells 2006, 24, 1213–1217. 10.1634/stemcells.2004-0324. [DOI] [PubMed] [Google Scholar]
- Case L. B.; Waterman C. M. Integration Of Actin Dynamics And Cell Adhesion By A Three-Dimensional, Mechanosensitive Molecular Clutch. Nat. Cell Biol. 2015, 17, 955–963. 10.1038/ncb3191. [DOI] [PMC free article] [PubMed] [Google Scholar]
- Kanchanawong P.; Shtengel G.; Pasapera A. M.; Ramko E. B.; Davidson M. W.; Hess H. F.; Waterman C. M. Nanoscale Architecture Of Integrin-Based Cell Adhesions. Nature 2010, 468, 580–584. 10.1038/nature09621. [DOI] [PMC free article] [PubMed] [Google Scholar]
- Piehler J.; Brecht A.; Valiokas R.; Liedberg B.; Gauglitz G. A High-Density Poly(Ethylene Glycol) Polymer Brush For Immobilization On Glass-Type Surfaces. Biosens. Bioelectron. 2000, 15, 473–481. 10.1016/S0956-5663(00)00104-4. [DOI] [PubMed] [Google Scholar]
- Zelzer M.; Scurr D. J.; Alexander M. R.; Ulijn R. V. Development And Validation Of A Fluorescence Method To Follow The Build-Up Of Short Peptide Sequences On Solid 2D Surfaces. ACS Appl. Mater. Interfaces 2012, 4, 53–58. 10.1021/am2015266. [DOI] [PubMed] [Google Scholar]
- Burgess A.Measuring Cell Fluorescence Using Imagej. Science Techblog Science 2011, https://sciencetechblog.com/2011/05/24/measuring-cell-fluorescence-using-imagej/. [Google Scholar]
- Burgess A.; Vigneron S.; Brioudes E.; Labbe J.-C.; Lorca T.; Castro A. Loss Of Human Greatwall Results In G2 Arrest And Multiple Mitotic Defects Due To Deregulation Of The Cyclin B-Cdc2/PP2A Balance. Proc. Natl. Acad. Sci. U. S. A. 2010, 107, 12564–12569. 10.1073/pnas.0914191107. [DOI] [PMC free article] [PubMed] [Google Scholar]
- Creek D. J.; Jankevics A.; Burgess K. E. V.; Breitling R.; Barrett M. P. IDEOM: An Excel Interface For Analysis Of LC-MS-Based Metabolomics Data. Bioinformatics 2012, 28, 1048–1049. 10.1093/bioinformatics/bts069. [DOI] [PubMed] [Google Scholar]
- Scheltema R. A.; Jankevics A.; Jansen R. C.; Swertz M. A.; Breitling R. Peakml/Mzmatch: A File Format, Java Library, R Library, And Tool-Chain For Mass Spectrometry Data Analysis. Anal. Chem. 2011, 83, 2786–2793. 10.1021/ac2000994. [DOI] [PubMed] [Google Scholar]
- Creek D. J.; Jankevics A.; Breitling R.; Watson D. G.; Barrett M. P.; Burgess K. E. Toward Global Metabolomics Analysis With Hydrophilic Interaction Liquid Chromatography-Mass Spectrometry: Improved Metabolite Identification By Retention Time Prediction. Anal. Chem. 2011, 83, 8703–8710. 10.1021/ac2021823. [DOI] [PubMed] [Google Scholar]
- Xia J.; Psychogios N.; Young N.; Wishart D. S. Metaboanalyst: A Web Server For Metabolomic Data Analysis And Interpretation. Nucleic Acids Res. 2009, 37, W652–660. 10.1093/nar/gkp356. [DOI] [PMC free article] [PubMed] [Google Scholar]
- Zelzer M.; Mcnamara L. E.; Scurr D. J.; Alexander M. R.; Dalby M. J.; Ulijn R. V. Phosphatase Responsive Peptide Surfaces. J. Mater. Chem. 2012, 22, 12229–12237. 10.1039/c2jm31666h. [DOI] [Google Scholar]
- Lhoest J. B.; Wagner M. S.; Tidwell C. D.; Castner D. G. Characterization Of Adsorbed Protein Films By Time Of Flight Secondary Ion Mass Spectrometry. J. Biomed. Mater. Res. 2001, 57, 432–440. . [DOI] [PubMed] [Google Scholar]
Associated Data
This section collects any data citations, data availability statements, or supplementary materials included in this article.