Abstract
Oligosaccharides in milk not only provide nutrition to the infants, but also have significant immune biofunctions such as inhibition of pathogen binding to the host cell. The main component in milk oligosaccharides is free oligosaccharides. Since the proteins in milk are highly glycosylated, N-glycans in milk also play an import role. In this study, we investigated the permethylated free oligosaccharides and N-glycans extracted from bovine, goat and human milk using LC-MS/MS. Quantitation profiles of free oligosaccharides and N-glycans were reported. The number of free oligosaccharides observed in bovine, goat and human milk samples (without isomeric consideration) were 11, 8 and 11 respectively. Human milk had more complex free oligosaccharides structures than the other two milk samples. Totally 58, 21, and 43 N-glycan structures (without isomeric consideration) were associated with whey proteins extracted from bovine, goat and human milk samples, respectively. Bovine milk free oligosaccharides and N-glycans from whey proteins were highly sialylated and to a lesser extend fucosylated. Goat and human milk free oligosaccharides and N-glycans from whey proteins were both highly fucosylated. Also, the isomeric glycans in milk samples were determined by PGC LC at elevated temperatures. For example, separation of human milk free oligosaccharide Gal-GlcNAc-(Fuc)-Gal-Glc and Gal-GlcNAc-Gal-Glc-Fuc isomers was achieved using PGC column. Permethylation of the glycan structures facilitated the interpretation of tandem MS. For example, internal cleavage and glycosidic bond cleavage are readily distinguished in the tandem mass spectra of permethylated glycans. This feature resulted in the identification of several isomers.
Keywords: N-glycans, Free oligosaccharides, Human milk, Bovine and goat milk, LC-MS/MS
1 Introduction
Oligosaccharides are the third most abundant component in human milk and animal milk [1]; they are usually composed of linear or branched units of monosaccharides including N-acetylglucosamine (GlcNAc), N-acetylgalactosamine (GalNAc), galactose (Gal), glucose (Glc), mannose (Man), fucose (Fuc) and N-acetylneuraminic acid (NeuAc). The importance of milk oligosaccharide has been extensively demonstrated [2]. Although oligosaccharides in milk do not provide nutrition to infants, the biofunctions of milk oligosaccharide have been well recognized [3]. One of the major biofunctions of milk oligosaccharides is to inhibit pathogen binding to the host cells. The first step of pathogenesis is to identify and bind to the host cell according to the cell surface glycans. Due to the unique structures of milk oligosaccharides, they act as decoys to protect infants [4–6]. Meanwhile, although milk oligosaccharides cannot directly nourish mammalian neonates, they have been shown to play a role in nourishing highly specific strains of bifidobacteria which would prompt the generation of a particular gut microbiota [7, 8]. All these biofunctions of milk oligosaccharides promote the development of reliable and sensitive quantitation analysis.
The dominant component of milk oligosaccharides is soluble free oligosaccharides that consist of D-glucose (Glc), D-galactose (Gal), N-acetylglucosamine (GlcNAc), L-fucose, and N-acetylneuraminic acid (NeuAc). Unlike peptides’ linear structure, most free oligosaccharides exist as branched structures. The linkage of monosaccharides also varies in different oligosaccharides. All these facts contribute to the complexity of milk oligosaccharides and increase the difficulty of quantitative and structural analysis. Another source of milk oligosaccharides is from the glycosylated whey proteins. These N and O linked glycans also participate in the pathogen inhibition even though they are much less abundant compared to free oligosaccharides [8].
Most informative structural analysis of milk oligosaccharides have been conducted by NMR [9]. Various combinations of different separation and detection methods have been utilized in milk oligosaccharides quantitative analysis. Native oligosaccharides can be separated by ion exchange chromatography [10–14], hydrophilic interaction chromatography (HILIC) [15], porous graphitic carbon (PGC) [16–18], reverse phase LC [19–21] and capillary electrophoresis (CE) [22, 23]. Ion exchange chromatography separation was usually conducted on native oligosaccharides. Among these separation techniques, isomeric separation is mainly attained by PGC and CE while reversed-phase liquid chromatography (RPLC) only separates limited number of isomers [2]. Isomeric separation is important in studies of milk oligosaccharides studies due to the fact that the biofunctions of oligosaccharides are more influenced by their spatial structures. Similar to conventional N-glycan analysis, free oligosaccharides are also labeled with tags containing a fluorophore or chromophore or permanent charge at the reducing end, which is galactose, in most of the free oligosaccharides quantitative studies. With reducing end labeling, milk oligosaccharides are detected by UV or fluorescence. Meanwhile, the hydrophobicity introduced through labeling renders glycan structures more amenable to separation by RPLC. The identification of glycans by UV or fluorescence detection methods relies on the availability of standards. This strategy has limited application in discovering new milk oligosaccharide structures; issues may occur when glycan pool is too complex, and the dynamic concentration range of glycans is wide.
Mass spectrometery (MS) is one of the most powerful analytical technique providing superb identification capability and detailed structural information in glycomics studies. LC coupled with MS would provide most comprehensive qualitative and quantitative analyses of milk oligosaccharides. However, the quantitation of acidic milk oligosaccharides may be problematic because of the lower ionization efficiency and possible sialic acid loss during ionization. However, analyses of native free oligosaccharides and N-glycans of whey proteins in milk have been reported [1, 3, 8, 16, 24–33].
Permethylation is a common derivatization method in glycomics, and can overcome the issues associated with ionization of glycans and loss of acidic structures. Efficient glycan permethylation method was first reported in 1984 [34]. More recently, solid-phase permethylation was developed in order to simplify the procedure and enable high-though sample preparation [35]. Permethylation stabilized glycans and prevents loss of Neu5Ac during ionization. The ionization differences between structures are also eliminated in permethylated glycans, resulting in more reliable glycomic profiling. Moreover, permethylated glycans have higher proton affinity, which would contribute to higher ionization efficiency in positive ESI; hence higher sensitivity could be achieved. Although free oligosaccharides are a major component in milk, N-glycans from whey proteins are relatively less abundant. High sensitivity would enable effective identification and quantitation of N-glycans of whey proteins in milk samples. In most LC-MS analyses of permethylated glycans, the separation is conducted in RPLC such as C18. However RPLC separation cannot resolve isomeric glycan structures, limited structure information can be obtained by this method. Recently our group has optimized the separation of permethylated glycan on PGC column, enables high sensitive and isomeric informative glycomic profiling.
In this study, free oligosaccharides and N-glycans released from whey proteins of human milk, bovine milk and goat milk are quantitatively profiled by C18 LC-MS/MS and isomerically separated by PGC LC-MS/MS. MS2 spectra were utilized for detailed structure elucidation for isomers.
2. Method
2.1 Materials and reagents
Human milk was from Human milk bank at Austin, bovine milk and goat milk were bought from a local supermarket (United supermarket, Lubbock, TX). PNGase F, 10×G7 reaction buffer (50mM sodium phosphate buffer, pH 7.5) were purchased from New England Biolabs (Ipswich, MA, USA). Dimethyl sulfoxide (DMSO), iodomethane, ammonia-borane complex, sodium hydroxide beads and formic acid were acquired from Sigma-Aldrich (St. Louis, MO, USA). ACS/USP grade anhydrous ethanol was from PHARMCO-AAPER, HPLC grade methanol, HPLC grade water, Acetonitrile (ACN) were obtained from Fisher Scientific (Fair Lawn, New Jersey, USA)
2.2 Sample preparation (extraction and purification)
The extraction and purification of whey protein and free oligosaccharides were performed as previously reported [26, 29]. Three aliquots of milk were taken from milk source and subjected to the same protocol. Briefly, as shown in the workflow in Figure 1, a 500-μl aliquot of milk samples were mixed with 500 μl water and centrifuged at 4°C and 1.5 krpm for 60 min. The mixture was separated into 3 layers. The middle aqueous layer was carefully collected, which consisted of whey protein and free oligosaccharides [26]. Next, a 500-μl aliquot of 90% chilled ethanol aqueous solution was added to each of the extracted middle layers. The mixture was then incubated at −20°C for 20 min, and centrifuged at 14.8 krpm for 10 min. The supernatants were then transferred to new vials, and the pellets which consisted of precipitated proteins were dried under vacuum.
Figure 1.
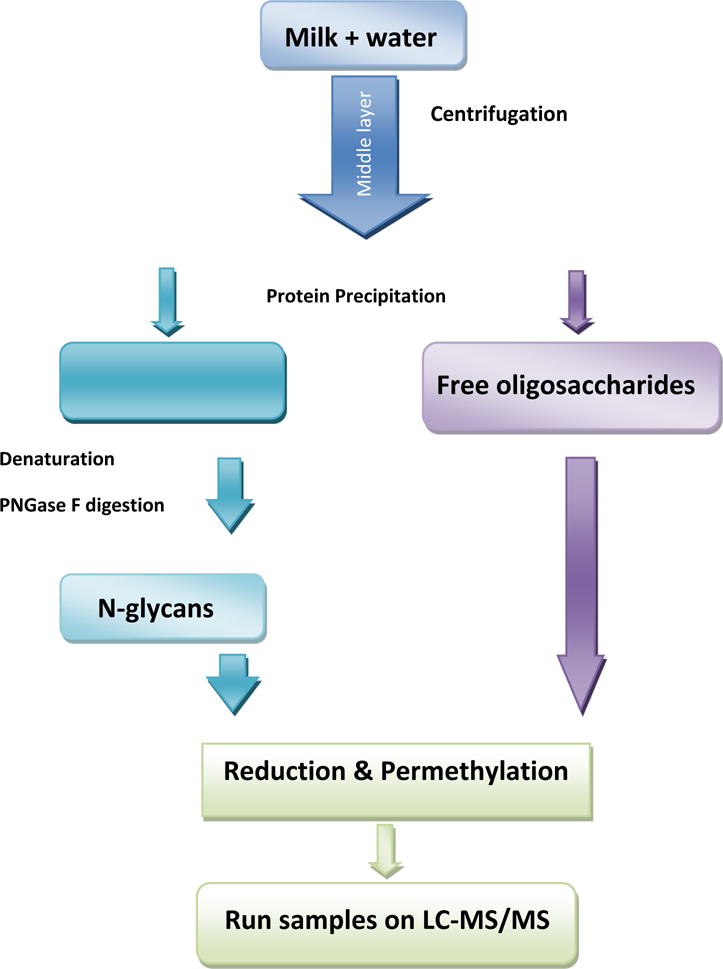
Flow chart summarizing sample preparation steps.
Next, the supernatants were split into 4 vials with 200 μl in each, an 800-μl aliquot of chloroform/methanol (v/v 2:1) solution were added to the supernatants. The mixture was centrifuged at 4°C, and 1.5 krpm for 30 min, all supernatants after enrichment were collected [36].
2.3 Digestion of whey protein, N-glycan release
The dried whey protein pellets were resuspended in 50 μl 10×G7 reaction buffer (50mM sodium phosphate buffer, pH 7.5), incubated in 90°C water bath for 20 min to denature the whey proteins. After denaturation, a 1.2-μl aliquot of PNGase F stock solution was added to the mixture. N-glycans were released from whey proteins after incubation in a 37°C water bath for 18 h. A 500-μl aliquot of 90% ice-cold ethanol aqueous solution was added to the mixture and was incubated at -20°C for 10 min. After centrifugation at 14.8 krpm for 10 min, the supernatants were collected and vacuum dried.
2.4 Reduction of free oligosaccharides and whey protein N-glycans
Free oligosaccharides and N-glycans reduction to eliminate the reducing end of the released and free oligosaccharides were performed as previously described [35]. Briefly, a 10-μl aliquot of ammonia-borane complex solution (10 μg/μl) were mixed with free oligosaccharides and N-glycans, the mixtures were incubated in 60°C water bath for 1h. The reduced samples were purified by using 500 μl methanol to remove the extra ammonia-borane complex and the borate salt. When methanol and ammonia-borane were mixed, volatile methyl borate salts are produced. Thus, repetitive addition and evaporation of methanol will eliminate all borate slats as methyl borate [35]. Samples were then dried under vacuum. The washing steps were repeated two more times to remove thoroughly the reducing reagent.
2.5 Solid-phase permethylation of free oligosaccharides and whey protein N-glycans
Solid-phase permethylation was performed as previously described[35]. Briefly, dried reduced glycans or free oligosaccharides were resuspended in 30 μl DMSO with 1.2 μl water. Sodium hydroxide beads, which were suspended in DMSO were transferred to the spin-columns, prior centrifugation at 1.8 krpm for 2 min. DMSO was then added to the columns and centrifuged again at 1.8 krpm for 2 min.
Next, a 20-μl CH3I aliquot was added to the resuspended glycan samples. The spin columns were loaded with the sample mixture and were incubated for 25 min. Additional 20-μl CH3I aliquot was added to the spin columns and was incubated for another 15 min t room temperature, followed by centrifugation at 1.8krpm for 2 min. The sample mixtures were eluted out with 30 μl ACN and centrifugation at 1.8 krpm for 1 min. The eluted samples were dried under vacuum.
2.6 LC-MS/MS analysis
LC-MS/MS analysis was performed as previously described [37–53]. The dried permethylated N-glycans or free oligosaccharides were resuspended in 80 μl 20%ACN, 0.1% Formic Acid solution then analyzed using UltiMate 3000 nano-LC system (Dionex, Sunnyvale, CA, USA) coupled with LTQ Orbitrap Velos (Thermo Scientific, San Jose, CA, USA). Each injection volume was 3 μl. For glycan profiling, samples were run at 55°C on reversed phase Acclaim PepMap capillary column (150 mm× 75μm i.d.) packed with 100 Å C18 bounded phase (Dionex). The flow rate was 0.35 μl/min. Mobile phase A consisted of 98% HPLC water, 2% ACN, 0.1% formic acid while mobile phase B consisted of 100% ACN with 0.1% formic acid. The gradient conditions for free oligosaccharides separation was 20% mobile phase B, increased to 25% over 11 min, 25% to 60% B (11–46 min), 60% to 90% B (46–47 min), 90% B (47–52 min), 90% to 20% B (52–53min), 20% (53–60min). The gradient conditions for N-glycans separation was 20% B(0–10min), 20% to 42% B (10–11min), 42% to 55% B (11–48min), 55% to 90% B (48–49min), 90% B (49–54min), 90% to 20% B (54–55min), 20% B (55–60min). Isomeric separation was attained at 75°C on HyperCarb porous graphitized carbon (PGC) column (100 mm×0.075mm i.d., particle size 3μm) (Thermo Scientific, Pittsburgh, PA, USA). The flow rate was set to 0.6 μl/min. The separation gradient for free oligosaccharides was 5% B (0–10min), 5% to 15% B (10–11min), 15% to 65% B (11–46min), 65% to 90% B (46–52min), 90% to 20% B (52–53min), 20% B (53–60 min). The flow rate for N-glycans separation on PGC column was 0.65μl/min, and the gradient employed was 20% B (0–10min), 20% to 45% B (10–11min), 45% to 60% B (11–20min), 60% to 95% B (20–46 min), 95% B (46–57min), 95% to 20% B (57–58min), 20% B (58–60min). Full MS spectra were obtained by positive mode with a mass range of 700–2000 m/z. The resolution of the instrument was set to 15,000 while mass accuracy was 5 ppm. MS/MS spectra were generated using collision induced dissociation (CID) at a normalized collision energy of 35%. The relative percentages of free oligosaccharides and N-glycans released from bovine, goat and human milk were based on the peak areas calculated by Xcalibur (Thermo Scientific).
3. Results and Discussion
3.1. Major free oligosaccharides structures detected in different milk sources
Permethylated glycans have high hydrophobicity, thus prompting effective separation on RPLC at high sensitivity. Glycan permethylation also permits the simultaneous detection of sialylated and neutral glycans, which is effective for the identification and relative quantitation of both free oligosaccharides and N-glycans in milk [17, 29, 35, 53]. In different milk sources, the structures and distributions of free oligosaccharides are different. The Extracted ion chromatograms (EICs) of free oligosaccharides derived from bovine, goat and human milk are shown in Figure 2A, B, and C, respectively. Comparing with native free oligosaccharides analysis methods [17], the intensity of permethylated free oligosaccharides in EIC increased at least 2 orders of magnitudes (Figure S1). The dramatic sensitivity increase permitted the detection of relatively low abundant structures in the milk samples, which were difficult to be identified in native oligosaccharides (Figure S1). 11 free oligosaccharides structures (without isomeric consideration) were assigned in the bovine milk sample, 8 structures in goat milk sample and 11 compositions were found in a human milk sample. Human milk had 4 compositions in common with either bovine milk or goat milk. Bovine milk and goat milk shared 5 compositions with the other milk samples. The free oligosaccharides compositions in human milk were more complex than the ones observed in the other two mammalian milk sources. The quantitation profile of free oligosaccharides released from bovine, goat and human milk are shown in Figure 3. In bovine milk, 85% of free oligosaccharides were triose, GlcNAc-lactose, and NeuGc-lactose. In goat milk, fucose-lactose was the most abundant, which was 60%. In human milk, 75% free oligosaccharides were fucosylated Gal-GlcNAc-lactose structure.
Figure 2.
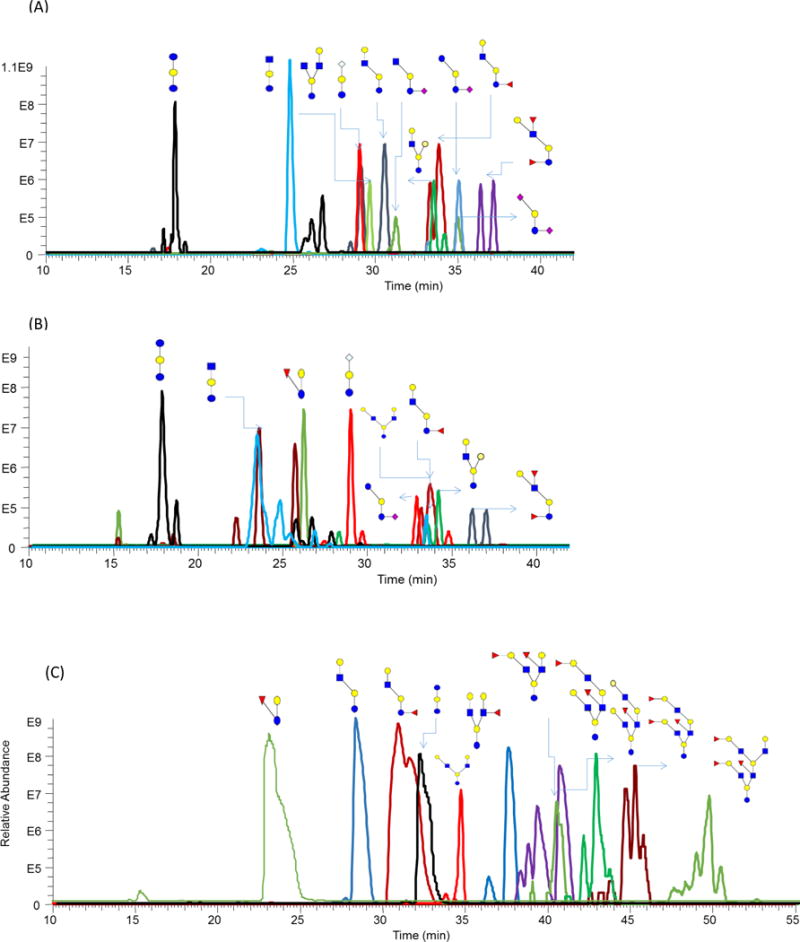
Extracted Ion Chromatogram (EIC) of free oligosaccharides extracted from (A) bovine milk (B) goat milk and (C) human milk. Symbols:
 , N-acetylglucosamine (GlcNAc);
 , Galactose (Gal);
 , Fucose (Fuc);
 , Mannose (Man);
 , Glucose (Glc);
 , N-acetylneuraminic acid (NeuAc/Sialic Acid);
 , N-glycolylneuraminic acid (NeuGc).
Figure 3.
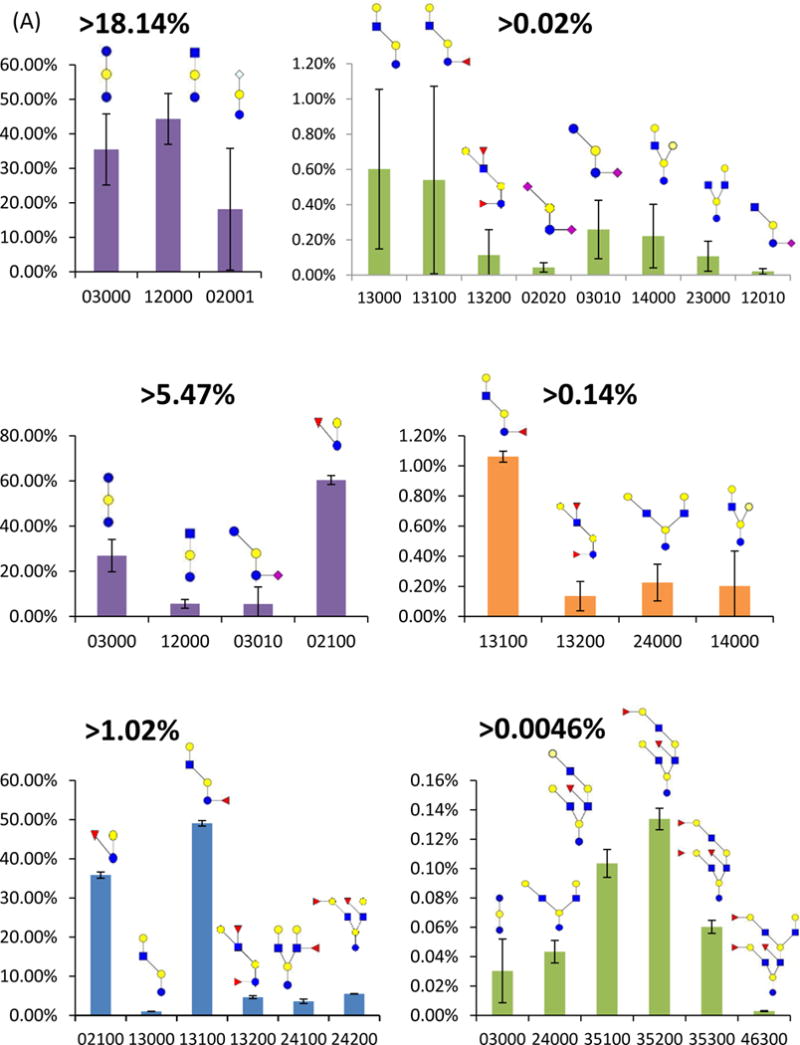
Bar graphs of the relative intensities of free oligosaccharides determined in (A) bovine, (B) goat and (C) human milk samples. The error bars represent the standard deviation of the three performed analyses (N= 3, please see experimental for more details). The oligosaccharides composition on x-axis shows a different number of GlcNAc, Hex(Man/Gal/Glc), Fuc, NeuAc, and NeuGc. Symbols: see Figure 2.
3.2 N-glycan profile in different milk sources
Although free oligosaccharides are the major glycan source in milk with a relative abundance of 7–12 g/L[29], N-glycans from glycosylated proteins are another substantial oligosaccharides source. According to initial studies in human and bovine milk, milk proteins are highly glycosylated [26] and they play similar biological functions as free oligosaccharides in milk. However, due to the limitation of analytical approaches, only N-glycans attached to abundant proteins were studied. Comprehensive list of N-glycan repertoire in milk sources remains to be challenging [26]. Permethylation of N-glycans dramatically increased the ionization efficiency in MS analysis, especially for acidic glycans containing N-acetylneuraminic acid (NeuAc) or N-glycolylneuraminic acid (NeuGc). The putative compositions and relative abundance of N-glycans released from bovine milk, goat milk, and human milk are listed in Table 1. 58 compositions (without considering isomers) were identified in bovine milk, 52% of total were fucosylated structures, 59% of the components included one or more sialic acid. In goat milk, 21 N-glycan structures were identified, and fucosylated structures 52%, 4% of the total were sialylated structures. 43 different N-glycans were found in human milk, 53% of them were composed of at least one fucose, and 39% compositions had sialic acid. Comparing with N-glycan distributions in bovine milk, goat milk, and human milk, we can see that bovine milk was highly sialylated, while in goat milk and human milk, fucosylated structures were in relatively higher abundance. This percentage ia in greement with the previously reported studies [55].
Table 1.
Relative abundances and putative structures of N-glycans associated with whey proteins extracted from bovine, goat, and human milk samples. Symbols:
 , N-acetylglucosamine (GlcNAc);
 , Galactose (Gal);
 , Fucose (Fuc);
 , Mannose (Man);
 , Glucose (Glc);
 , N-acetylneuraminic acid (NeuAc/Sialic Acid);
 , N-glycolylneuraminic acid (NeuGc). Abbreviations: HM, human milk; BM: bovine milk; GM, goat milk.
| Putative structures | % Relative Abundance±SDd HMa | RSDe | % Relative Abundance±SD BMb | RSD | % Relative Abundance±SD GMc | RSD |
|---|---|---|---|---|---|---|
|
|
0.09%±0.02% | 17.56% | – | – | – | – |

|
0.05%±0.01% | 25.68% | – | – | – | – |
|
|
11.1%±0.5% | 4.21% | – | – | – | – |
|
|
0.5%±0.2% | 35.23% | – | – | 1.7%±0.8% | 49.26% |

|
0.3%±0.1% | 36.37% | – | – | – | – |
|
|
0.02%±0.01% | 30.01% | – | – | – | – |
|
|
– | – | – | – | 9.6%±2.9% | 30.28% |
|
|
0.150%±0.002% | 1.63% | – | – | – | – |
|
|
1.7%±0.3% | 16.15% | 4.7%±0.9% | 18.78% | 0.7%±0.2% | 24.53% |
|
|
– | – | 0.18%±0.06% | 34.66% | – | – |
|
|
– | – | 1.10%±0.08% | 7.39% | – | – |

|
0.10%±0.02% | 15.33% | – | – | – | – |
|
|
0.9%±0.3% | 37.85% | 1.0%±0.3% | 33.01% | – | – |

|
0.900%±0.005% | 0.53% | 0.06%±0.02% | 38.55% | 0.7%±0.2% | 25.81% |
|
|
– | – | 1.2%±0.2% | 14.35% | – | – |

|
0.8%±0.4% | 44.73% | – | – | – | – |
|
|
0.1%±0.1% | 90.17% | – | – | – | – |

|
1.6%±0.1% | 6.82% | 2.3%±0.5% | 22.19% | – | – |
|
|
– | – | 2.1%±0.9% | 44.56% | – | – |
|
|
0.07%±0.05% | 74.41% | – | – | 1.9%±1.1% | 60.01% |
|
|
– | – | 0.50%±0.03% | 6.66% | 2.9%±1.7% | 58.95% |
|
|
0.50%±0.01% | 2.76% | 0.20%±0.03% | 14.06% | 6.7%±1.9% | 28.19% |
|
|
5.1%±1.9% | 36.27% | 4.6%±1.0% | 21.02% | 4.0%±0.4% | 8.98% |

|
1.3%±0.6% | 45.57% | 1.4%±0.1% | 6.78% | 6.9%±0.4% | 5.78% |

|
3.5%±1.0% | 31.05% | 0.5%±0.1% | 19.26% | – | – |
|
|
0.4%±0.1% | 23.16% | 0.20%±0.02% | 11.06% | 2.5%±0.2% | 7.45% |
|
|
2.2%±0.4% | 17.81% | 5.7%±1.9% | 33.44% | – | – |
|
|
1.6%±1.1% | 66.33% | 1.8%±0.3% | 16.46% | – | – |
|
|
5.1%±1.8% | 35.07% | 4.0%±0.4% | 9.42% | 4.0%±0.7% | 16.28% |

|
3.9%±1.5% | 38.94% | 9.7%±4.6% | 47.91% | 0.04%±0.01% | 33.24% |
|
|
0.3%±0.2% | 55.42% | 1.9%±0.5% | 25.18% | – | – |

|
3.1%±1.0% | 33.02% | – | – | – | – |
|
|
5.4%±0.1 | 2.62% | – | – | – | – |

|
1.5%±0.7% | 43.81% | – | – | – | – |

|
0.10%±0.08% | 65.93% | – | – | – | – |
|
|
– | – | 1.0%±0.3% | 32.20% | – | – |
|
|
– | – | 1.3%±0.3% | 24.95% | – | – |

|
0.05%±0.01% | 31.53% | – | – | – | – |

|
– | – | 0.40%±0.09% | 23.32% | – | – |

|
0.06%±0.01% | 22.56% | – | – | – | – |

|
0.06%±0.04% | 65.24% | – | – | – | – |

|
– | – | 0.7%±0.1% | 14.86% | – | – |

|
– | – | 0.20%±0.02% | 10.09% | – | – |

|
– | – | 0.60%±0.07 | 11.64% | – | – |
|
|
23.4%±2.3% | 9.75% | – | – | 9.8%±1.9% | 19.60% |

|
3.8%±0.5% | 13.44% | – | – | – | – |

|
14.9%±2.9% | 19.32% | – | – | 12.1%±1.9% | 15.72% |

|
1.5%±0.2% | 9.84% | – | – | 7.0%±0.9% | 12.54% |
|
|
0.10%±0.03% | 21.08% | 4.1%±0.6% | 15.17% | 0.50%±0.02% | 3.66% |
|
|
3.0%±0.4% | 11.57% | 1.7%±0.7% | 39.74% | 14.1%±1.5% | 10.48% |

|
0.20%±0.03% | 11.59% | – | – | – | – |
|
|
– | – | – | – | 0.3%±0.1% | 46.13% |
|
|
0.07%±0.01% | 16.75% | 0.4%±0.1% | 25.15% | 0.50%±0.02% | 4.39% |

|
0.09%±0.02% | 19.61% | – | – | – | – |
|
|
– | – | 0.40%±0.04% | 9.81% | – | – |

|
– | – | 4.5%±0.4% | 9.33% | – | – |
|
|
– | – | 1.1%±0.1% | 11.97% | – | – |
|
|
– | – | 9.7%±1.3% | 12.89% | – | – |
|
|
– | – | 0.09%±0.03% | 30.68% | – | – |

|
– | – | 0.10%±0.04% | 32.79% | – | – |

|
0.010%±0.002% | 27.27% | – | – | – | – |

|
– | – | 0.4%±0.1% | 31.48% | – | – |

|
– | – | 0.10%±0.04% | 32.81% | – | – |

|
– | – | 0.20%±0.03% | 13.60% | – | – |

|
– | – | 2.9%±1.2% | 41.49% | 14.00%±1.9% | 13.37% |

|
– | – | – | – | 0.07%±0.04% | 58.37% |

|
– | – | 0.30%±0.05% | 14.99% | – | – |

|
– | – | 2.6%±0.1% | 5.36% | – | – |

|
– | – | 1.4%±0.3% | 18.18% | – | – |

|
– | – | 5.9%±0.3% | 4.68% | – | – |

|
– | – | 1.0%±0.2% | 21.04% | – | – |

|
0.4%±0.3% | 88.04% | – | – | – | – |

|
– | – | 0.70%±0.07% | 10.36% | – | – |

|
– | – | 3.4%±0.8% | 24.23% | – | – |

|
– | – | 0.40%±0.05% | 10.75% | – | – |

|
– | – | 4.5%±1.0% | 21.12% | – | – |

|
– | – | 0.30%±0.04% | 14.51% | – | – |

|
– | – | 0.20%±0.05% | 25.36% | – | – |

|
– | – | 0.8%±0.1% | 11.87% | – | – |

|
– | – | 1.70%±0.07% | 4.33% | – | – |

|
– | – | 0.30%±0.05% | 20.81% | – | – |

|
– | – | 0.70%±0.08% | 11.44% | – | – |

|
– | – | 0.50%±0.09% | 20.25% | – | – |

|
– | – | 1.9%±0.3% | 15.29% | – | – |

|
– | – | 0.06%±0.04% | 68.59% | – | – |

|
– | – | 0.19%±0.16% | 84.82% | – | – |

|
– | – | 0.20%±0.04% | 17.83% | – | – |

|
– | – | 0.30%±0.09% | 36.50% | – | – |
Human Milk
Bovine Milk
Goat Milk
Standard deviation (N = 3, see experimental section)
Relative Standard deviation (standard deviation divided by relative abundances)
Cells with dashes indicate structures were not detected.
3.3 Isomeric elucidation of permethylated free oligosaccharides on PGC column
Although permethylation increased ionization efficiency of glycans on RPLC-MS, partial isomeric separation is attained on RP column. Optimized separation on PGC column under high temperature (75°C) increased the efficiency of isomeric separation. The analysis on PGC column successfully provided informative profiling for both permethylated free oligosaccharides and permethylated N-glycans. As shown in Figure 4A, under 55°C, on C18 column, the separation of isomers for fucosylated Gal-GlcNAc-lactose was not effective. However, on PGC column at 75°C (Figure 4B), the two isomers with different fucose connectivity were separated into two peaks, their structures were confirmed by tandem MS. The characteristic peaks at m/z values of 638.40 and 842.55 in Figure 4C clearly illustrated that the connecting position of fucose was at GlcNAc. On the other hand, those two peaks cannot be observed as shown in Figure 4D, if the fucose residue was attached to the glucose in the core. These structures shared the same m/z value, but different fucose connectivity was clearly elucidated using PGC column. In comparison, the MS/MS spectrum (Figure 4A) we obtained on C18 column showed the characteristic peaks of both species, which means that the spectrum was a mixture of the two isomers. Thus, isomeric separation of permethylated free oligosaccharides is achieved on PGC column.
Figure 4.
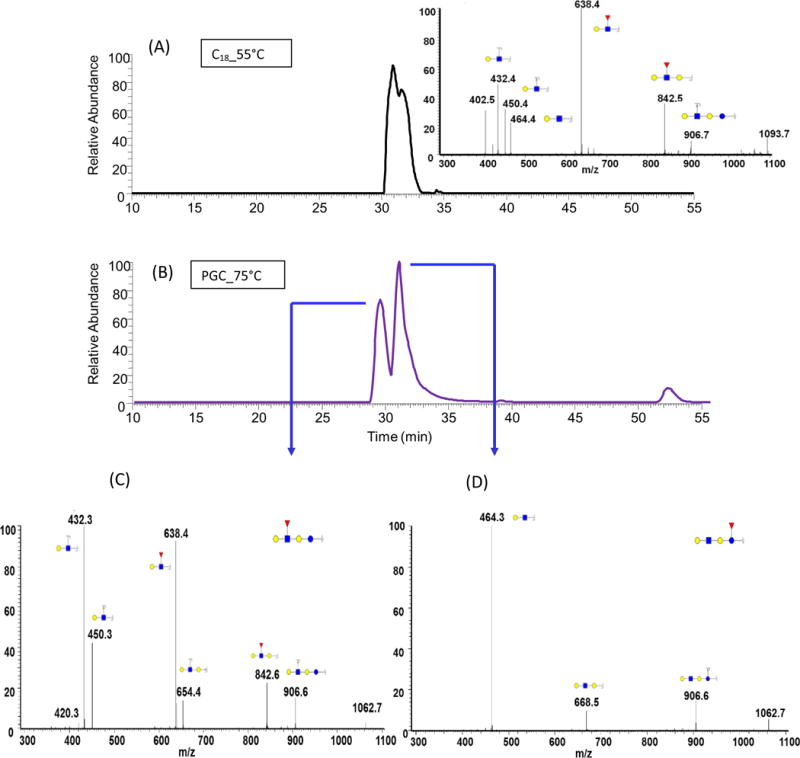
EIC of fucosylated Gal-GlcNAc-lactose isomers determined in human milk, using (A) C18 and (B) PGC columns. Tandem MS of the two isomers associated with this free oligosaccharide structures are depicted in C and D. Symbols: see Figure 2.
Interestingly, permethylation of N-glycans provided an easier to interpret tandem mass spectra. For example, Tandem mass spectrum of Gal-GlcNAc-(Fuc)-Gal-Glc structure contained a 450.3 m/z value representing Gal-GlcNAc fragment (Figure 4C) which is an internal fragment ion resulting from the cleavage of both glycosidic bonds linked to GlcNAc moiety. However, the tandem mass spectrum of Gal-GlcNAc-Gal-Glc-Fuc structure contained 464.31 m/z value representing Gal-GlcNAc fragment (Figure 4D) which originates from the cleavage of the glycosidic bond linking GlcNAc to internal Gal. Although the fragments have the same monosaccharide compositions, there was 14 Da difference, which was exactly the mass of CH2. This confirms the composition of the positional isomers with different fucose linkage. The fragment Gal-GlcNAc-Gal with m/z 654.40 in Figure 4C and the fragment Gal-GlcNAc-Gal with m/z 668.46 in Figure 4D also supported the presence of two structures. For native N-glycans or reducing end labeled N-glycans, this difference cannot be observed. Therefore, permethylation did permit not only the isomeric separation on PGC but also facilitate tandem MS interpretation.
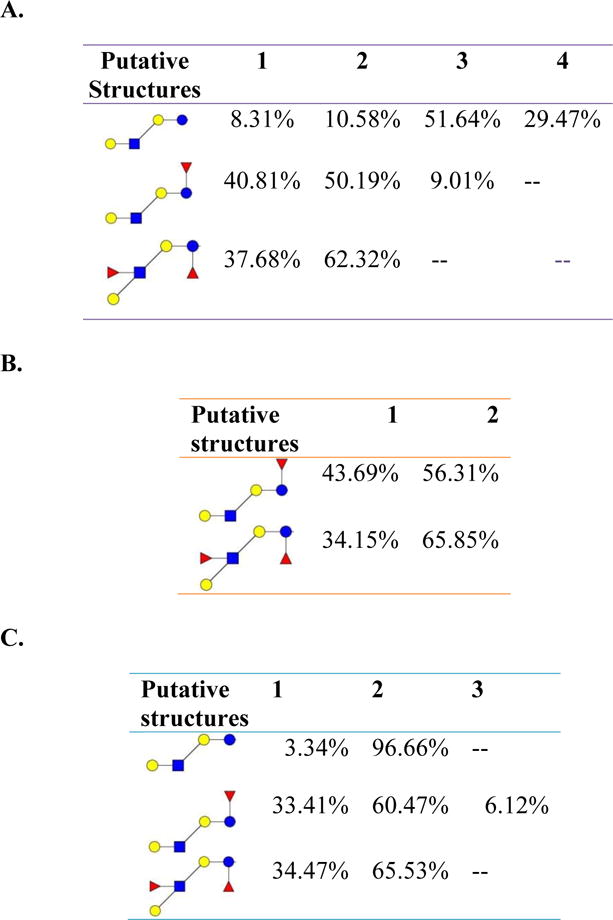
Table 2 lists the isomeric species and relative abundances of free oligosaccharides extracted from bovine milk, goat milk, and human milk. Different milk sources exhibited different isomeric distributions. For example, bovine milk GlcNAc1Gal3 structure had 4 positional isomers while human milk had only two positional isomers. On the other hand, goat milk only exhibited one structure.
Table 2.
Relative abundances of isomeric free oligosaccharides in (A) bovine, (B) goat and (C) human milk samples. 1, 2, 3, 4 stands for different isomers. Symbols as in Table 1.
|
3.4 Isomeric elucidation of permethylated N-glycans on PGC column
Since the glycosylation of proteins is a template-free process [48], different monosaccharide compositions, connectivity, linkage result in the extensive structural diversity of glycans. Based on composition and branching difference, N-glycans may be classified as high mannose, which is composed of only GlcNAc and mannose; complex, and hybrid. Additionally, N-glycan isomeric structures are the result of (i) positions of monosaccharides, (ii) branching, (iii) fucose moiety position and linkage, and (iii) sialic acid moiety linkage [26]. Isomeric structural elucidation is helpful to understand better the biological role of glycoproteins [26].
High temperature (75°C) separations on PGC column prompt isomeric separation of permethylated N-glycans. Based on tandem MS and the unique fragment ions associated with permethylated N-glycans, isomeric structures resulting from fucose position are readily identified. Fucose rearrangement in the gas phase is commonly observed for native glycans [56] but not for permethylated glycans. Figure 5A depicts the extracted ion chromatogram of (GlcNAc4Man3Gal2Fuc1NeuAc1, m/z 1322.1546) structure detected in human milk. Two peaks were observed in the EIC, thus indicating the presence of two isomers. Figure 5B and Figure 5C are MS2 spectra corresponding to retention times at 28 min and 38min, respectively. In Figure 5B, m/z values of 660.43, 1003.94, 1176.00, and 1219.55 represent fragment ions originating from a structure with fucose moiety attached to the branch GlcNAc. In Figure 5C, fragment ions with m/z values of 490.36 and 1090.98 suggested that fucose moiety was connected to the GlcNAc in the core structure.
Figure 5.
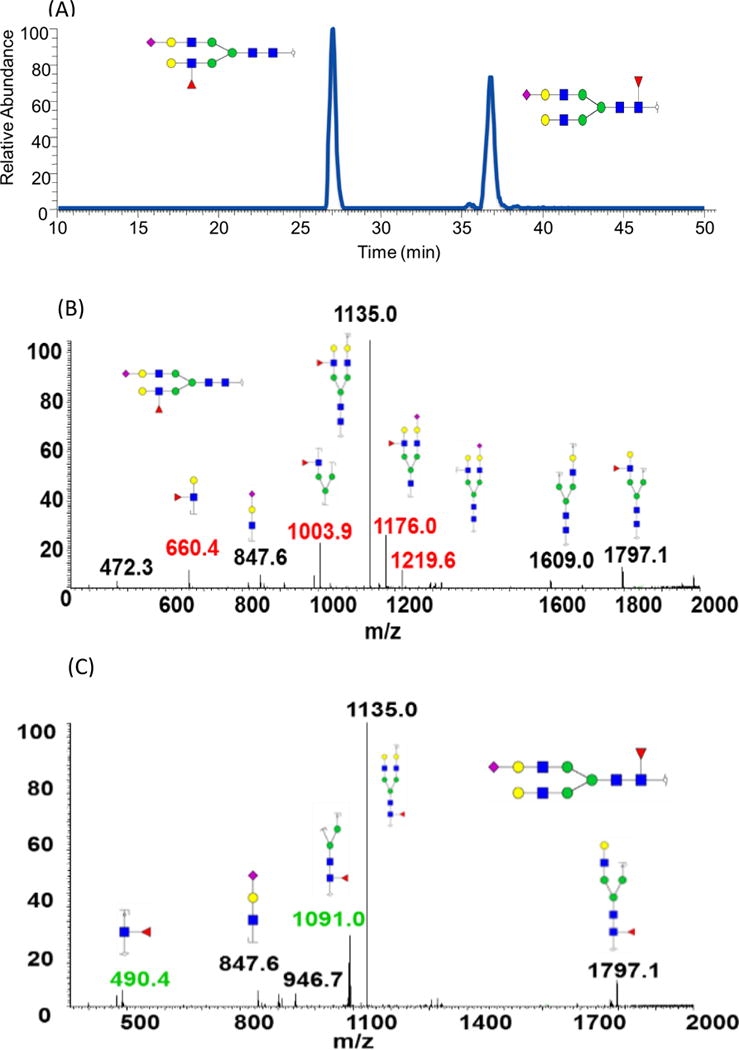
EIC of GlcNAc4Man3Gal2Fuc1NeuAc1 isomers determined in human milk, using PGC. Tandem MS of the two isomers associated with this structure is illustrated in B and C. Symbols: see Figure 2.
A glycan structure with GlcNAc4Man3Gal1Fuc1 composition has potentially two positional isomers originating from terminal Gal moiety attachment to GlcNAc on the α6 branch or α3 branch. Since the two structures had very similar hydrophobicity, it is impossible to separate them on C18 columns. However, optimized separation on PGC column facilitated the efficient separation of the two isomers. The EIC of these isomers is shown in Figure 6A while their tandem mass spectra are depicted in Figures 6B and C. Although the fragment ions observed in both spectra were identical, the ratio of some of these fragment ions was unique to each isomer. For example, the ratio of the fragment ion at m/z 1103.7 to m/z 1307.8 in MS/MS spectra was different in the two spectra. With Galactose connected to an α3 branch, the peak height of m/z 1103.7 was obviously much higher than the peak at m/z 1307.8. While in α6 branch structure, the height of the two peaks was quite close. This structural elucidation evidence has already been confirmed by analyzing standards of the two isomers tandem MS of one of them is shown in Figure S2.
Figure 6.
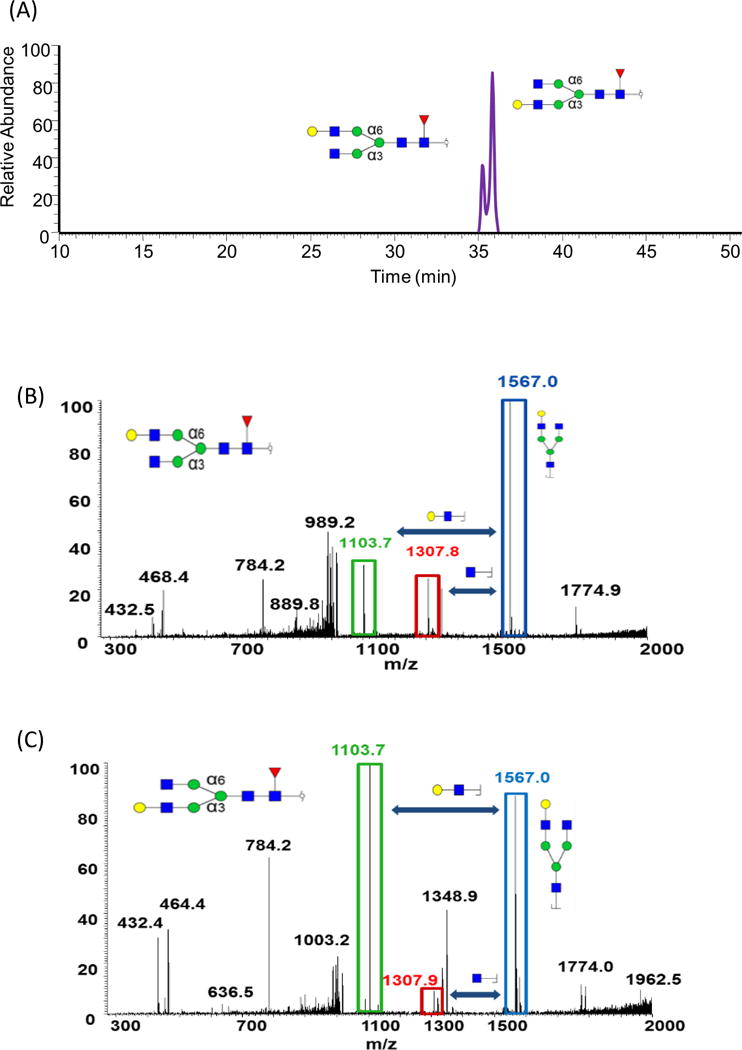
EIC GlcNAc4Man3Gal1Fuc1 isomers determined in human milk, using PGC. Tandem MS of the two isomers associated with this structure is illustrated in B and C. Symbols: see Figure 2.
Figures 7A, B, and C, summarize all the assigned positional isomeric structures of N-glycans identified from bovine, goat and human milk samples, respectively. In bovine milk, fucose linkage to the core or branch resulted in two isomeric structure of GlcNAc4Man3Gal2Fuc1NeuAc1 and GlcNAc5Man3Gal1Fuc1 (Figure 7A). Tandem mass spectra of these isomers are shown in supplementary information Figures S3 and S4, respectively. In goat milk, GlcNAc4Man3Gal1Fuc1 and GlcNAc5Man3Gal1Fuc1 structures exhibited several structural isomers (Figure 7B). In human milk, GlcNAc4Man3Gal1Fuc1 and GlcNAc5Man3Gal1Fuc1 exhibited the same isomers observed in the other two milk samples as well as additional isomers (Figure 7C). Two isomeric compositions of GlcNAc4Man3Gal2Fuc2 (tandem mass spectra are depicted in Figure S5 and S6) and GlcNAc4Man3Gal2Fuc1 were observed.
Figure 7.
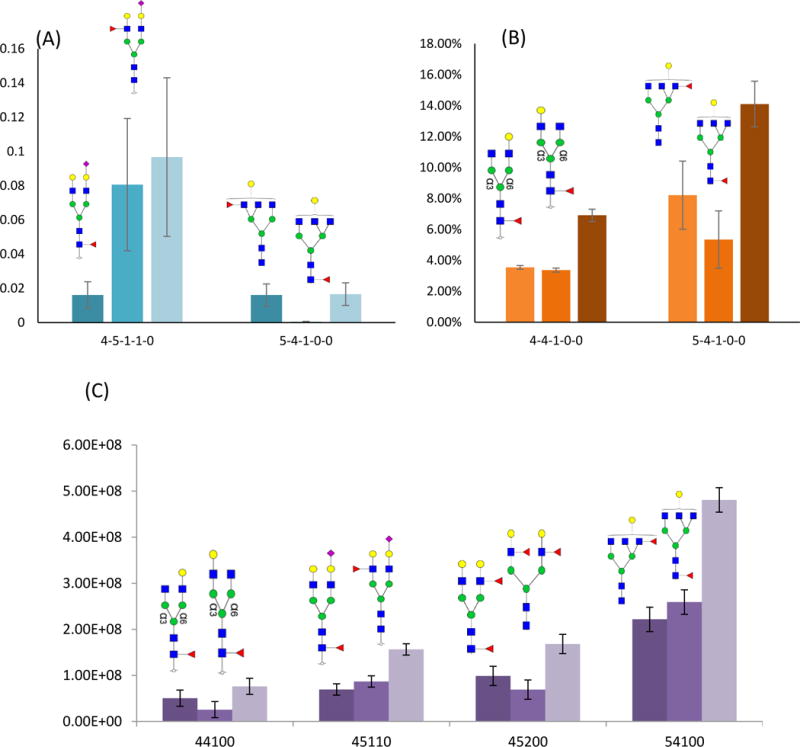
Bar graphs of the relative intensities of N-glycan isomers in whey proteins isolated from (A) bovine, (B) goat and (C) human milk samples. The error bars represent the standard deviation of the three performed analyses (N= 3, please see experimental for more details). Glycan composition on the x-axis was named in the same order as in Figure 3. Symbols: see Figure 2.
4 Conclusion
In this study, we investigated the compositions of permethylated free oligosaccharides and N-glycans derived from bovine, goat and human milk. Quantitation profile of free oligosaccharides and N-glycans were illustrated. The LC-MS/MS analyses revealed (without isomeric consideration) the presence of 11, 8 and 11 free oligosaccharide compositions in bovine, goat and human milk samples, respectively. Human milk had more complex free oligosaccharides structures relative to the other two milk sources. On the other hand, LC-MS/MS analyses of permethylated N-glycans derived from whey proteins extracted from the different milk sources disclosed a more complex profile than the free oligosaccharides. Totally 58, 21 and 43 N-glycan structures were identified in the whey proteins extracted from bovine goat and human milk samples. N-glycans in bovine milk were more sialylated than fucosylated while N-glycans in goat and human milk were highly fucosylated.
The distribution of isomeric free oligosaccharides and N-glycans in milk samples analyzed in this study was attained using PGC column at elevated temperatures. Identification of many of the isomers observed in this study was facilitated by permethylation and tandem MS. Permethylated oligosaccharides and N-glycans separated on PGC column provided richer fragmentation information in MS/MS than native glycans or reducing end labeling method. Accordingly, tandem MS of permethylated sugars showed an advantage in distinguishing linkage and branching isomers.
Supplementary Material
Acknowledgments
This work was supported by NIH grant (1R01GM112490-01)
References
- 1.Zivkovic AM, German JB, Lebrilla CB, Mills DA. Proceedings of the National Academy of Sciences of the United States of America. 2011;108:4653–4658. doi: 10.1073/pnas.1000083107. [DOI] [PMC free article] [PubMed] [Google Scholar]
- 2.Ruhaak LR, Lebrilla CB. Adv Nutr. 2012;3:406s–414s. doi: 10.3945/an.112.001883. [DOI] [PMC free article] [PubMed] [Google Scholar]
- 3.German JB, Freeman SL, Lebrilla CB, Mills DA. Personalized Nutrition for the Diverse Needs of Infants and Children. 2008;62:205–222. doi: 10.1159/000146322. [DOI] [PMC free article] [PubMed] [Google Scholar]
- 4.Zopf D, Roth S. Lancet. 1996;347:1017–1021. doi: 10.1016/s0140-6736(96)90150-6. [DOI] [PubMed] [Google Scholar]
- 5.Morrow AL, Ruiz-Palacios GM, Jiang X, Newburg DS. Journal of Nutrition. 2005;135:1304–1307. doi: 10.1093/jn/135.5.1304. [DOI] [PubMed] [Google Scholar]
- 6.Newburg DS, Ruiz-Palacios GM, Morrow AL. Annual Review of Nutrition. 2005;25:37–58. doi: 10.1146/annurev.nutr.25.050304.092553. [DOI] [PubMed] [Google Scholar]
- 7.Harmsen HJM, Wildeboer-Veloo ACM, Raangs GC, Wagendorp AA, Klijn N, Bindels JG, Welling GW. Journal of Pediatric Gastroenterology and Nutrition. 2000;30:61–67. doi: 10.1097/00005176-200001000-00019. [DOI] [PubMed] [Google Scholar]
- 8.Ninonuevo MR, Ward RE, LoCascio RG, German JB, Freeman SL, Barboza M, Mills DA, Lebrilla CB. Analytical Biochemistry. 2007;361:15–23. doi: 10.1016/j.ab.2006.11.010. [DOI] [PubMed] [Google Scholar]
- 9.van Leeuwen SS, Schoemaker RJ, Gerwig GJ, van Leusen-van Kan EJ, Dijkhuizen L, Kamerling JP. Glycobiology. 2014;24:728–739. doi: 10.1093/glycob/cwu036. [DOI] [PubMed] [Google Scholar]
- 10.Coppa GV, Gabrielli O, Pierani P, Catassi C, Carlucci A, Giorgi PL. Pediatrics. 1993;91:637–641. [PubMed] [Google Scholar]
- 11.Thurl S, Henker J, Siegel M, Tovar K, Sawatzki G. Glycoconjugate Journal. 1997;14:795–799. doi: 10.1023/a:1018529703106. [DOI] [PubMed] [Google Scholar]
- 12.Bode L, Rudloff S, Kunz C, Strobel S, Klein N. Journal of Leukocyte Biology. 2004;76:820–826. doi: 10.1189/jlb.0304198. [DOI] [PubMed] [Google Scholar]
- 13.Coppa GV, Gabrielli O, Zampini L, Galeazzi T, Ficcadenti A, Padella L, Santoro L, Soldi S, Carlucci A, Bertino E, Morelli L. Journal of Pediatric Gastroenterology and Nutrition. 2011;53:80–87. doi: 10.1097/MPG.0b013e3182073103. [DOI] [PubMed] [Google Scholar]
- 14.Moro GE, Stahl B, Fanaro S, Jelinek J, Boehm G, Coppa GV. Acta Paediatrica. 2005;94:27–30. doi: 10.1111/j.1651-2227.2005.tb02151.x. [DOI] [PubMed] [Google Scholar]
- 15.Marino K, Lane JA, Abrahams JL, Struwe WB, Harvey DJ, Marotta M, Hickey RM, Rudd PM. Glycobiology. 2011;21:1317–1330. doi: 10.1093/glycob/cwr067. [DOI] [PubMed] [Google Scholar]
- 16.Wu SA, Grimm R, German JB, Lebrilla CB. Journal of Proteome Research. 2011;10:856–868. doi: 10.1021/pr101006u. [DOI] [PMC free article] [PubMed] [Google Scholar]
- 17.Wu SA, Tao NN, German JB, Grimm R, Lebrilla CB. Journal of Proteome Research. 2010;9:4138–4151. doi: 10.1021/pr100362f. [DOI] [PMC free article] [PubMed] [Google Scholar]
- 18.Wuhrer M, Koeleman CAM, Hokke CH, Deelder AM. International Journal of Mass Spectrometry. 2004;232:51–57. [Google Scholar]
- 19.Asakuma S, Urashima T, Akahori M, Obayashi H, Nakamura T, Kimura K, Watanabe Y, Arai I, Sanai Y. European Journal of Clinical Nutrition. 2008;62:488–494. doi: 10.1038/sj.ejcn.1602738. [DOI] [PubMed] [Google Scholar]
- 20.Sumiyoshi W, Urashima T, Nakamura T, Arai I, Saito T, Tsumura N, Wang B, Brand-Miller J, Watanabe Y, Kimura K. British Journal of Nutrition. 2003;89:61–69. doi: 10.1079/BJN2002746. [DOI] [PubMed] [Google Scholar]
- 21.Leo F, Asakuma S, Fukuda K, Senda A, Urashima T. Bioscience Biotechnology and Biochemistry. 2010;74:298–303. doi: 10.1271/bbb.90614. [DOI] [PubMed] [Google Scholar]
- 22.Albrecht S, Schols HA, van den Heuvel EGHM, Voragen AGJ, Gruppen H. Electrophoresis. 2010;31:1264–1273. doi: 10.1002/elps.200900646. [DOI] [PubMed] [Google Scholar]
- 23.Albrecht S, Schols HA, van den Heuvel EGHM, Voragen AGJ, Gruppen H. Carbohydrate Research. 2011;346:2540–2550. doi: 10.1016/j.carres.2011.08.009. [DOI] [PubMed] [Google Scholar]
- 24.Aldredge DL, Geronimo MR, Hua S, Nwosu CC, Lebrilla CB, Barile D. Glycobiology. 2013;23:664–676. doi: 10.1093/glycob/cwt007. [DOI] [PMC free article] [PubMed] [Google Scholar]
- 25.Barile D, Marotta M, Chu C, Mehra R, Grimm R, Lebrilla CB, German JB. J Dairy Sci. 2010;93:3940–3949. doi: 10.3168/jds.2010-3156. [DOI] [PMC free article] [PubMed] [Google Scholar]
- 26.Nwosu CC, Aldredge DL, Lee H, Lerno LA, Zivkovic AM, German JB, Lebrilla CB. J Proteome Res. 2012;11:2912–2924. doi: 10.1021/pr300008u. [DOI] [PMC free article] [PubMed] [Google Scholar]
- 27.Mehra Raj, B D, Marotta Mariarosaria, Lebrilla Carlito B, Chu Caroline, German J Bruce. PLOS ONE. 2014;9 doi: 10.1371/journal.pone.0096040. [DOI] [PMC free article] [PubMed] [Google Scholar]
- 28.Ruhaak LR, Lebrilla CB. Adv Nutr. 2012;3:406S–414S. doi: 10.3945/an.112.001883. [DOI] [PMC free article] [PubMed] [Google Scholar]
- 29.Wu Shuai, G R, German J Bruce, Lebrilla Carlito B. Journal of Proteome Research. 2010:4138–4151. doi: 10.1021/pr100362f. [DOI] [PMC free article] [PubMed] [Google Scholar]
- 30.Smilowitz JT, Lebrilla CB, Mills DA, German JB, Freeman SL. Annu Rev Nutr. 2014;34:143–169. doi: 10.1146/annurev-nutr-071813-105721. [DOI] [PMC free article] [PubMed] [Google Scholar]
- 31.Tao N, DePeters EJ, Freeman S, German JB, Grimm R, Lebrilla CB. J Dairy Sci. 2008;91:3768–3778. doi: 10.3168/jds.2008-1305. [DOI] [PubMed] [Google Scholar]
- 32.Tao N, Wu S, Kim J, An HJ, Hinde K, Power ML, Gagneux P, German JB, Lebrilla CB. J Proteome Res. 2011;10:1548–1557. doi: 10.1021/pr1009367. [DOI] [PMC free article] [PubMed] [Google Scholar]
- 33.Wu S, Salcedo J, Tang N, Waddell K, Grimm R, German JB, Lebrilla CB. Anal Chem. 2012;84:7456–7462. doi: 10.1021/ac301398h. [DOI] [PMC free article] [PubMed] [Google Scholar]
- 34.Ciucanu I, Kerek F. Carbohydrate Research. 1984;131:209–217. [Google Scholar]
- 35.Kang P, Mechref Y, Klouckova I, Novotny MV. Rapid Communications in Mass Spectrometry. 2005;19:3421–3428. doi: 10.1002/rcm.2210. [DOI] [PMC free article] [PubMed] [Google Scholar]
- 36.Liu Z, Moate P, Cocks B, Rochfort S. J Agric Food Chem. 2014;62:11568–11574. doi: 10.1021/jf5037849. [DOI] [PubMed] [Google Scholar]
- 37.Alley WR, Jr, Vasseur JA, Goetz JA, Svoboda M, Mann BF, Matei DE, Menning N, Hussein A, Mechref Y, Novotny MV. J Proteome Res. 2012;11:2282–2300. doi: 10.1021/pr201070k. [DOI] [PMC free article] [PubMed] [Google Scholar]
- 38.Desantos-Garcia JL, Khalil SI, Hussein A, Hu Y, Mechref Y. Electrophoresis. 2011;32:3516–3525. doi: 10.1002/elps.201100378. [DOI] [PMC free article] [PubMed] [Google Scholar]
- 39.Devakumar A, Mechref Y, Kang P, Novotny MV, Reilly JP. J Am Soc Mass Spectrom. 2008;19:1027–1040. doi: 10.1016/j.jasms.2008.03.005. [DOI] [PMC free article] [PubMed] [Google Scholar]
- 40.Hu Y, Zhou S, Khalil SI, Renteria CL, Mechref Y. Anal Chem. 2013;85:4074–4079. doi: 10.1021/ac400106x. [DOI] [PMC free article] [PubMed] [Google Scholar]
- 41.Hu Y, Zhou S, Yu CY, Tang H, Mechref Y. Rapid Commun Mass Spectrom. 2015;29:135–142. doi: 10.1002/rcm.7093. [DOI] [PMC free article] [PubMed] [Google Scholar]
- 42.Huang Y, Mechref Y, Novotny MV. Carbohydr Res. 2000;323:111–125. doi: 10.1016/s0008-6215(99)00254-2. [DOI] [PubMed] [Google Scholar]
- 43.Jmeian Y, Hammad LA, Mechref Y. Anal Chem. 2012;84:8790–8796. doi: 10.1021/ac301855v. [DOI] [PubMed] [Google Scholar]
- 44.Kyselova Z, Mechref Y, Al Bataineh MM, Dobrolecki LE, Hickey RJ, Vinson J, Sweeney CJ, Novotny MV. J Proteome Res. 2007;6:1822–1832. doi: 10.1021/pr060664t. [DOI] [PMC free article] [PubMed] [Google Scholar]
- 45.Kyselova Z, Mechref Y, Kang P, Goetz JA, Dobrolecki LE, Sledge GW, Schnaper L, Hickey RJ, Malkas LH, Novotny MV. Clin Chem. 2008;54:1166–1175. doi: 10.1373/clinchem.2007.087148. [DOI] [PubMed] [Google Scholar]
- 46.Mechref Y, Ma W, Hao G, Novotny MV. Biochem Biophys Res Commun. 1999;255:451–455. doi: 10.1006/bbrc.1999.0176. [DOI] [PubMed] [Google Scholar]
- 47.Mitra I, Zhuang Z, Zhang Y, Yu CY, Hammoud ZT, Tang H, Mechref Y, Jacobson SC. Anal Chem. 2012;84:3621–3627. doi: 10.1021/ac203431s. [DOI] [PMC free article] [PubMed] [Google Scholar]
- 48.Plasencia MD, Isailovic D, Merenbloom SI, Mechref Y, Novotny MV, Clemmer DE. J Am Soc Mass Spectrom. 2008;19:1706–1715. doi: 10.1016/j.jasms.2008.07.020. [DOI] [PMC free article] [PubMed] [Google Scholar]
- 49.Segu ZM, Hussein A, Novotny MV, Mechref Y. J Proteome Res. 2010;9:3598–3607. doi: 10.1021/pr100129n. [DOI] [PubMed] [Google Scholar]
- 50.Tang Z, Varghese RS, Bekesova S, Loffredo CA, Hamid MA, Kyselova Z, Mechref Y, Novotny MV, Goldman R, Ressom HW. J Proteome Res. 2010;9:104–112. doi: 10.1021/pr900397n. [DOI] [PMC free article] [PubMed] [Google Scholar]
- 51.Tsai TH, Wang M, Di Poto C, Hu Y, Zhou S, Zhao Y, Varghese RS, Luo Y, Tadesse MG, Ziada DH, Desai CS, Shetty K, Mechref Y, Ressom HW. J Proteome Res. 2014;13:4859–4868. doi: 10.1021/pr500460k. [DOI] [PMC free article] [PubMed] [Google Scholar]
- 52.Wildburger NC, Zhou S, Zacharias LG, Kroes RA, Moskal JR, Schmidt M, Mirzaei P, Gumin J, Lang FF, Mechref Y, Nilsson CL. J Proteome Res. 2015;14:3932–3939. doi: 10.1021/acs.jproteome.5b00549. [DOI] [PMC free article] [PubMed] [Google Scholar]
- 53.Zhou S, Hu Y, DeSantos-Garcia JL, Mechref Y. J Am Soc Mass Spectrom. 2015;26:596–603. doi: 10.1007/s13361-014-1054-1. [DOI] [PMC free article] [PubMed] [Google Scholar]
- 54.Wu Shuai, G R, German J Bruce, Lebrilla Carlito B. Journal of Proteome Research. 2011:856. doi: 10.1021/pr101006u. [DOI] [PMC free article] [PubMed] [Google Scholar]
- 55.Albrecht S, Lane JA, Marino K, Al Busadah KA, Carrington SD, Hickey RM, Rudd PM. Br J Nutr. 2014;111:1313–1328. doi: 10.1017/S0007114513003772. [DOI] [PubMed] [Google Scholar]
- 56.Harvey DJ, Mattu TS, Wormald MR, Royle L, Dwek RA, Rudd PM. Analytical Chemistry. 2002;74:734–740. doi: 10.1021/ac0109321. [DOI] [PubMed] [Google Scholar]
Associated Data
This section collects any data citations, data availability statements, or supplementary materials included in this article.


