

Abstract
LC-MS/MS is one of the most powerful tools for N-glycan structure elucidation; however, it is still challenging to identify some glycan structures with low abundance. In this study, we investigated the chromatographic behavior of permethylated N-glycans. The relationship between retention times vs. molecular weight of dextran, dextrin and model glycans was investigated. Also, the non-polar surface area (NPSA) of glycans was calculated and compared to their experimental retention time. The two trends are similar when the intermolecular interaction is included in the calculation. Moreover, the retention time corresponds to glycan types and branch types. The N-glycans analysis model, which combines high mass accuracy and retention time, was applied to confirm serum N-glycans. In total, there were 78 N-glycan compositions identified. A linear relationships between retention times and molecular weights were observed for each subgroup of glycan structures, for example, R2 > 0.98 for complex N-glycans. Moreover, the retention time could be further applied to distinguish between structural isomers as well as linkage isomers. MS/MS data was used to confirm the structural isomers.
Keywords: Glycans, Glycoproteins, Permethylation, LC-MS, LC-MSMS
Introduction
Glycosylation is one of the most common posttranslational modifications of proteins; protein glycosylation functions in many biological processes such as protein folding, transport, and targeting.[1] Moreover, aberrant glycosylation has been linked to the development of many human diseases, including cancer, inflammation, and many immune diseases.[2, 3] Therefore, glycans could be utilized as biomarkers for disease diagnosis and prognosis. As such, the characterization of protein glycosylation is a research area that has recently attracted much attention.
Among the various analytical methods routinely employed for glycomics analysis, mass spectrometry (MS) has proven to be one of the most powerful tools because of its ability to produce a wealth of reliable data, allowing for the analysis of glycans associated with complex biological samples. MS has been recently employed to elucidate glycan structures and their roles in disease progression.[4–7] However, structural elucidation remains a challenge in glycomics studies. Currently, the most reliable analytical tool for structural elucidation is tandem MS (MS2 and MSn) analysis, which provides structural information resulting in unequivocal glycan structural assignment.[8–13] Despite the wealth of information provided by MS2 analysis, it is still challenging to identify some glycan structures, as there are not enough fragments produced to prompt effective identification. This ambiguity can be somewhat resolved through MS3, or in some cases through MSn analysis; however, MSn analysis is not attainable in cases where the abundances of glycans are very low. Additionally, the glycan concentration dynamic range within one sample can extend over several orders of magnitude, prompting detector bias, which severely limits tandem MS capabilities. For glycans existing at low concentrations, chromatographic or electrophoretic separations overcome such limitations and generate reliable MSn acquisitions.
Glycans from complex samples are effectively identified and characterized by combining liquid chromatography (LC) and MS. Recently, an LC method employing amide based columns was devised to analyze heterogeneous glycan mixtures.[14] The retention times of fluorescently labeled glycans were initially correlated to the retention times of dextran (linear oligosaccharides) to determine glucose unit (GU) values. Such values were subsequently employed to deduce the structures of unknown glycans. Amide-modified nanocolumns have also been used to separate underivatized N-glycans for MS analysis.[15] Additionally, porous graphitic carbon columns interfaced to MS have been applied to separate and identify N-glycan isomeric structures.[16–18] Most of the recent studies employing this chromatography medium focused on structural identification of native glycans. However, one issue encountered when using mass spectrometry for the analysis of native glycans is the low ionization efficiency of such structures, especially in the case of sialylated glycans. The simultaneous detection of both acidic and neutral glycans in positive-ion mode MS is also analytically challenging. The permethylation of N-glycans[19–21] results in the detection of all glycans in the positive mode as well an increase in the ionization efficiency; the stability of sialylated glycans improves substantially after permethylation.
In this study, we separated permethylated N-glycans using a C18 nanocolumn that is interfaced to an Orbitrap mass spectrometer to investigate the relationship between retention time and glycan structure. The chromatographic separation allowed for the identification of glycan structures by their specific retention times. Also, the chromatographic separation allowed for the confirmation of the majority of glycan structures commonly observed in human blood serum (HBS). A comprehensive 2-D map was generated and subsequently employed to determine the glycan structures associated with different samples. The above described LC-MS method permitted a simplified characterization and unequivocal structural assignments of glycan structures associated with complex biological samples such as HBS.
Experimental
Materials
Dextran, dextrin, model glycoprotein (including ribonuclease B (RNase B), fetuin, HBS, neuraminidase from Clostridium perfringens, borane-ammonium complex, sodium hydroxide beads, dimethylsulfoxide, methyl iodide, trifluoroacetic acid, chloroform, and MS-grade formic acid were acquired from Sigma-Aldrich (St. Louis, MO). Microspin columns and graphitized carbon and C18 microspin columns were purchased from Harvard Apparatus (Holliston, MA). Acetic acid and HPLC-grade solvents, including methanol and isopropanol, were procured from Fisher Scientific (Pittsburgh, PA) while acetonitrile was obtained from JT Baker (Phillipsburg, NJ). HPLC grade water was acquired from Mallinckrodt Chemicals (Phillipsburg, NJ). Endoglycosidase purified from Flavobacteriummeningosepticum (PNGase F, 500,000 units/ml) was obtained from New England Biolabs Inc (Ipswich, MA).
Methods
N-glycans Released from Model Glycoproteins
Aqueous stock solutions of model glycoproteins (10 μg/μL concentrations), including RNase B and fetuin, were prepared. A 1-μL aliquot of each of the model glycoprotein stock solutions was mixed with a 9-μL aliquot of G7 buffer (50 mM sodium phosphate buffer, pH 7.5) provided by the vendor. Next, a 1-μL aliquot of a diluted PNGase F solution (prepared by diluting the vendor stock solution 10-times with G7 buffer) was added to each of the model glycoprotein solutions. The unit concentration of the diluted PNGase F solution is 50 units/μL. The reaction mixtures were then incubated for 18 hours at 37°C in a water bath (Thermo Scientific, Pittsburgh, PA). Upon enzymatic digestion completion, samples were dried under vacuum (Labconco, Kansas City, MO).
N-glycans Released from HBS Glycoproteins
A 90-μL aliquot of denaturing phosphate buffered saline (PBS, consisting of 10 mM sodium phosphate, 10 mM sodium chloride, 4 mM dithiothreitol (DTT), 0.5% sodium dodecyl sulfate (SDS), pH 7.5) was added to a 10-μL aliquot of HBS. The sample was then incubated at 60°C for 45 minutes and allowed to reach room temperature; this results in the prompt partial denaturation of glycoproteins allowing for the efficient enzymatic release of N-glycans. A 5-μL aliquot of 10% aqueous NP-40 solution was added to consume free SDS. Next, a 2.4-μL aliquot of PNGase F (120 units) was added followed by placing the sample in a 37°C water bath for 18 hours. Next, a 690-μL aliquot of 5% acetonitrile (0.1% trifluoroacetic acid) was added to the enzymatically released glycans and centrifuged at 10K rpm for 30 min. The samples were then purified with charcoal microspin columns. First, the charcoal spin columns were washed with 100% ACN. Next, the column was washed with a 400-μL aliquot of 85% aqueous ACN solution. This step was repeated twice. The columns were conditioned with 400 μL of a 5% aqueous ACN solution twice. The samples were then applied to the columns, and the columns were washed five times with 5% aqueous ACN solution. Finally, glycans were eluted from the column using 200 μL of 40% aqueous ACN solution. This elution step was repeated twice, prior to combining all eluant in a clean vial and drying under vacuum.
Desialylation of N-glycans from fetuin
N-glycans released from fetuin were also desialylated as described here. A 5-μL aliquot of enzymatically released fetuin was adjusted to pH 6.5 with 0.1 M hydrochloric acid. Next, a 1-μL aliquot of neuraminidase (1 μg/μL, 0.01 unit) was added to the sample and incubated at 37°C for 4 hours. This neuraminidase treatment generated non-sialylated complex-type N-glycans.
Reduction of N-glycans
A 10-μL aliquot of aqueous borane-ammonium complex (10 μg/μL) was added to dextran, dextrin and the N-glycans enzymatically released from fetuin, RNase B, HBS, and neuraminidase treated fetuin. This step was needed to eliminate glycan anomers. Each sample was then incubated in a 60°C water bath for 1 hour followed by the addition of 10 μL of 5% acetic acid. Samples were then dried under vacuum. Next, a 100-μL aliquot of HPLC-grade methanol was added to form volatile methyl borate. The samples were then dried under vacuum. These two steps were repeated at least 5-times to ensure effective elimination of excess borate introduced through the reduction reaction.
Solid-Phase Permethylation of N-glycans
Reduced glycans were permethylated using solid-phase permethylation according to the previously published method.[19–21] First, microspin columns were filled to 3 cm depth with sodium hydroxide beads and washed twice with 50 μL aliquots of DMSO. The dried and reduced glycan samples were resuspended in 1.2 μL water and 30 μL DMSO. A 20 μL aliquot of methyl iodide was then added to the sample followed by the application of the sample to the sodium hydroxide packed microspin column. The samples were allowed to react for 30 minutes before the addition of another 20-μL aliquot of methyl iodide. The samples were then allowed to incubate for an additional 20 minutes before centrifugation at 200g for 1 min. This centrifugation speed was employed for all subsequent experimental steps. Finally, the sodium hydroxide columns were washed with 50 μL ACN twice to elute all permethylated glycans.
Solid-phase Purification of Permethylated N-Glycans
Solid-phase C18 cartridges were used for purification of permethylated N-glycans prior to LC-MS/MS analyses. A 400-μL aliquot of 80% aqueous ACN solution were applied to C18 columns and centrifuged; this was repeated twice. The cartridges were then washed with 400 μL of 100% ACN. Next, the cartridges were washed with a 5% aqueous ACN solution. Permethylated samples were suspended in 690 μL aliquots of 5% aqueous ACN solution prior to loading into the cartridges. The columns were then washed three times with 400 μL aliquots of 5% aqueous ACN solutions. The cartridges were placed in clean Eppendorf tubes before elution with a 200 μL aliquot of 80% aqueous ACN solution; this step was repeated twice, and the eluents were combined into one vial and dried under vacuum. The dried samples were resuspended in a 100-μl aliquot of 20% aqueous ACN solution containing 0.1% formic acid before MS analyses.
LC-MS and LC-MSMS
A Dionex 3000 Ultimate nano-LC system (Dionex, Sunnyvale, CA) was used for LC-MS analysis. The LC separation was attained under gradient conditions from 38%–45% solvent B over 32 min at a flow rate of 350 nL/min. Solvent A consisted of 2% acetonitrile and 98% water with 0.1% formic acid while solvent B consisted of 100% acetonitrile and 0.1% formic acid. Acclaim® PepMap capillary column (150 mm × 75 μm i.d) packed with 100 Å C18 bonded phase (Dionex) was used for sample separation while C18 pre-column (3 μm particle size, 100 Å pore size, 75 μm i.d., 2 cm length) was used for sample loading and purificatio. The equivalent of 0.5 μg of protein/glycoprotein was injected. Samples were loaded to the trap and washed for 10 min at 3 μl/min using a loading buffer consisting of 0.1% formic acid prepared in water. The columns were conditioned with 10% solvent B for 10 min prior to the next injection. Velos LTQ Orbitrap hybrid mass spectrometer (Thermo Scientific, San Jose, CA) was used for detection. Nano ESI source was used at 1.6kV. Data-dependent acquisition mode was used in which the scan mode switched between MS full scan (m/z from 500–2000) and CID MS/MS scan that was performed on the 8 most abundant ions. Instrument MS resolution was set to 15,000. CID MS/MS was acquired using a 0.250 Q-value, 20 ms activation time, and 35% normalized collision energy.
Data evaluation
High mannose permethylated glycans were observed as ([M+H+NH4]2+ while other permthylated glycans were observed as doubly and tiply proteonated ions. Xcalibur Qual Browser (Thermo Fisher Scientific) was used for LC/ESI-MS data processing. Retention times of glycans were determined from the extracted ion chromatograms, generated using the monoisotopic masses of glycans with a 10 ppm mass tolerance. A seven-point boxcar smoothing was utilized to improve chromatographic peak quality. Chromatographic peak height was used to represent the abundance of a glycan structure.
Results and Discussion
The nonpolar surface area (NPSA) is the surface sum over all nonpolar atoms, primarily carbon and hydrogen (see detailed discussion of NPSA in supporting information). Nonpolar driving forces, aka the hydrophobic effect, of proteins, have been well studied for fundamental insights into protein folding and protein binding reactions.[22, 23] Due to the hydrophilic property of native glycans, the nonpolar surface area, is not well understood. Hydrophobic tagging of glycans, including hydrazone formation, permethylation, and peracetylation, has shown enhanced mass spectrometric ionization and detection.[24, 25] The calculation adopted here were similar to what was described by Muddiman and co-workers.24,25 Permethylation transforms glycans from a hydrophilic molecule to a hydrophobic one, thus allowing separation on a C18 column. In this study, we correlated NPSA value to experimental retention time to better understand the chromatographic behavior of permethylated N-glycans. NPSA values of glycans were calculated to determine the optimal chromatography condition and subsequently applied to estimate the retention time of unknown glycans and aid in the identification of structural isomers.
Dextrin is a branched glucan (α1–4, and α1–6 linkages) composed of chains of varying lengths while dextran is a linear low-molecular-weight carbohydrate (α1–6 linkage). Here, we use dextran and dextrin as model glucans to study the relationship between molecular weight and retention time as well as glucose unit with retention time. To further study how the branching of N-glycans influences the retention time, we mixed the reduced permethylated glycans from fetuin and desialylated fetuin samples to evaluate the chromatographic behavior of the different glycans present in such a mixture. Figure 1 illustrates the relationship between retention time and glucose unit as well as the relationship between estimated NPSA and glucose unit for dextran and N-glycans derived from fetuin. The estimated NPSA of a glycan is calculated using the assumption that the additional intermolecular forces that arise with glycan branching results in the loss of available functional groups that would otherwise be able to interact with the C18 column.[25] An increase of the glucose unit resulted in a linear increase of both the retention time and the NPSA. Moreover, the retention time and NPSA values are inversely related to the branch of glycans; as the branch increases, the retention time and NPSA value decreased. Table S1 summarizes the intensity and retention time of dextran, dextrin, and the mixed fetuin glycans.
Figure 1.
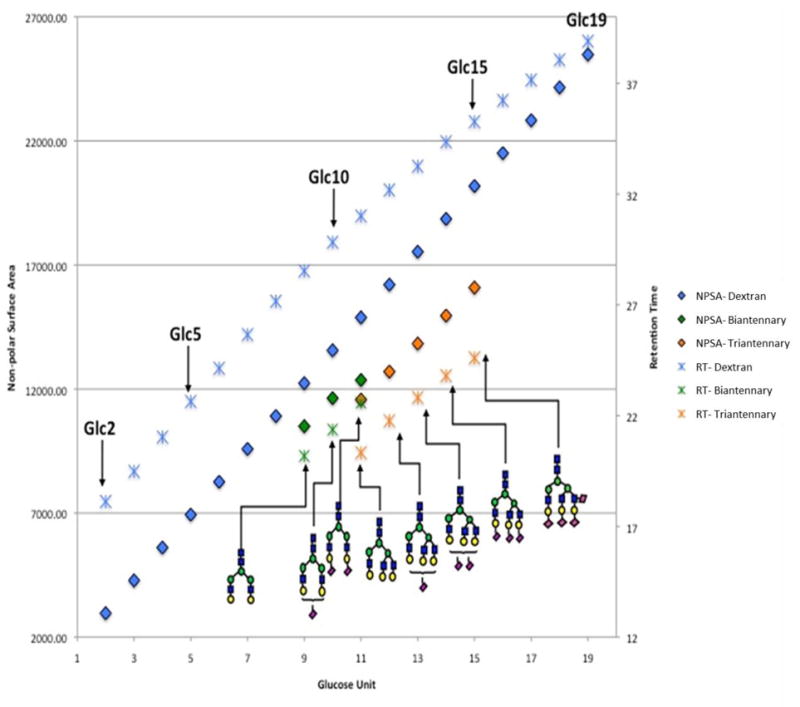
Plots of retention time (y-axis) vs. glucose unit (x-axis) and NPSA (y-axis) vs. glucose unit (x-axis) of dextran and N-glycans derived from fetuin in which the retention times of fetuin glycans is different from the retention times of linear and partially linear glycans. Symbols:
 , N-acetylglucosamine (GlcNAc);
 , Galactose (Gal);
 , Fucose (Fuc);
 , Mannose (Man);
 , Glucose (Glc);
 , N-acetylneuraminic acid (NeuAc/Sialic Acid).
A plot of the retention time vs. the molecular weight (Figure S1a) or the retention time vs. glucose unit (Figure S1b) demonstrated a linear-like relationship. As shown in Figure S1 and Table S1, the retention times of linear glucans are lower than those of branched glucans for the same molecular weights; this might be due to the chain conformation of dextran and dextrin, both of which can be regarded as helical in various states of extension [26]. Thus, for linear carbohydrates such as dextran, the methyl groups inside the helix are not available for hydrophobic interaction with the C18 column. However, the hydrophobicity of dextrin increased with the increase in the number of branch glucose units outside and inside the helix. For fetuin, the retention times of triantennary glycans are sooner than those of biantennary glycans for the same glucose unit or molecular weight. The interaction between the branched glucose units resulted in a decrease of the glycan hydrophobicity. Moreover, the retention times of fetuin glycans appear to be substantially shorter than their dextran or dextrin counterpart, even when the molecular weight is the same. The methyl groups associated with the permethylated fetuin N-glycans are not completely available for interacting with the chromatographic media, which results in a shorter retention on the C18 column. In contrast, the methyl groups on the linear (dextran) and partially linear (dextrin) structures appeared to be more available for interaction with the C18 column resulting in a longer retention time.
N-glycans derived from RNase B were further used as N-glycan models to demonstrate the possibility of using the retention time as a structural indicator. Figure S2 compared the retention time and glucose unit as well as the relationship between estimated NPSA and glucose unit for dextran and high mannose glycans. The retention time, as well as NPSA, increased with the increase of glucose unit. Figure S3 depicts the extracted ion chromatograms of RNase B. Five unique compositions of RNase B (Man5, Man6, Man7, Man8, Man9) were observed and their intensities varied. The retention time and the molecular weight have a linear relationship, as evidenced by an R2 value of 0.998; a similar trend was discussed in a previous publication with R2 value of 0.993.[27]
We applied our N-glycan analysis model, which is based on high mass accuracy and retention time, to identify serum N-glycans. First, MS full scan was analyzed, and all possible N-glycans were extracted based on accurate mass (Figure 2). The total compositions determined by mass accuracy (less than 2 ppm) were 78 (Table S2). Our method resulted in the identification of more common and unique compositions than previously published work by several groups[28–32] (Table S3). N-glycan structures in this study were also confirmed by MS/MS. Among the total detected glycans, 52 had sufficient MS/MS data for structural confirmation. Thus, identifying other compositions based on retention time and accurate mass is of great importance. The glycan structure, degree of branching (antennary), and molecular weight all contribute to the retention time as evidenced by the data obtained from dextrin, dextran, and N-glycans extracted from model glycoproteins. To investigate the relationship between retention time and molecular weight, N-glycans identified in serum were classified into several groups based on glycan type and antennary (Figure 2). In the case of mannose type glycans derived from HBS, a linear fit of the retention time resulted in an R2 value of 0.996 (Figure 2b), which is comparable to that obtained for RNase B glycans. Although Man 9 derived from HBS has no MS/MS data for structural confirmation, the structure can be elucidated with retention time and mass accuracy measurements. Complex N-glycans were further classified into biantennary, triantennary tetraantennary and multiantennary subclasses; each subclass can be further divided into several subgroups based on the galactose (Gal) moieties. An increase in the number of Gal moieties results in an increase in intermolecular interactions and a decrease in the interaction between the methyl groups and C18 column. These observed changes support our prediction of the intermolecular interactions affecting the retention times of biantennary, triantennary and tetraantennary complex-type N-glycans. The retention times of these structures increase as the molecular weights increase, with a good linear relationship within each subclass. For example, the R2 values of biantennary glycans with one and two Gal moieties are 0.987 and 0.994 (Figure 2c). The triantennary glycans with one, two and three Gal moieties have an R2 value of 0.999, 0.998 and 0.994, respectively (Figure 2d).
Figure 2.
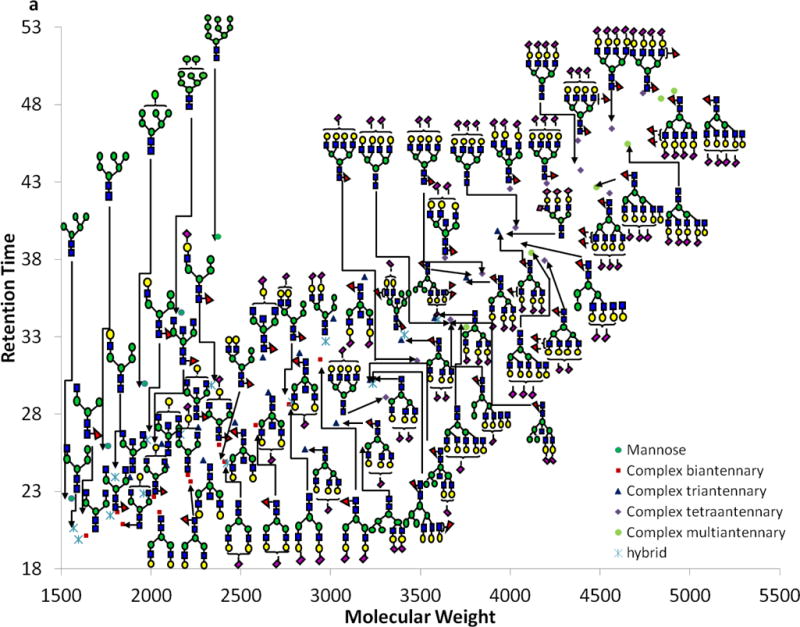

Glycomic mapping of N-glycans derived from HBS (a). Linear fitting of the retention times of (b) high mannose, (c) complex-type biantennary, (d) complex-type triantennary; and (e) complex-type tetraantennary. Symbols: see Figure 1. Coefficient of determination (R2) is listed for each linear fit.
The influence of fucosylation on the retention time is subtle when there are two or less fucosylated sites; however, the multi-fucosylated glycans have lower retention time compared to their antennary group (Figure 2e). This observation is explained by the stereo-hindrance effect, where fewer methyl groups are available for interaction with the C18 column. A similar phenomenon is observed with sialic acid. As the sialic acid units increase to four, the retention times decreased (Figure 2e).
The hybrid type N-glycans can also be subdivided based on the antennarity. Biantennary hybrid glycans and multiantennary glycans also demonstrate a linear relationship between glucose unit and retention time (R2 = 0.990, R2 = 0.953). The different branches identified in one of the subgroups is also attributed to lowering the R2 value of the multiantennary glycans. For example as shown in Figure 3, both H6N3 and H6N4F1 could be triantennary hybrid glycans (H, hexose; N, HexNAc, F, fucose and S, sialic acid). H6N3 has two mannose-type branches while H6N4F1 has two complex-type branches. Therefore, these two structures do not fit on the same line.
Figure 3.
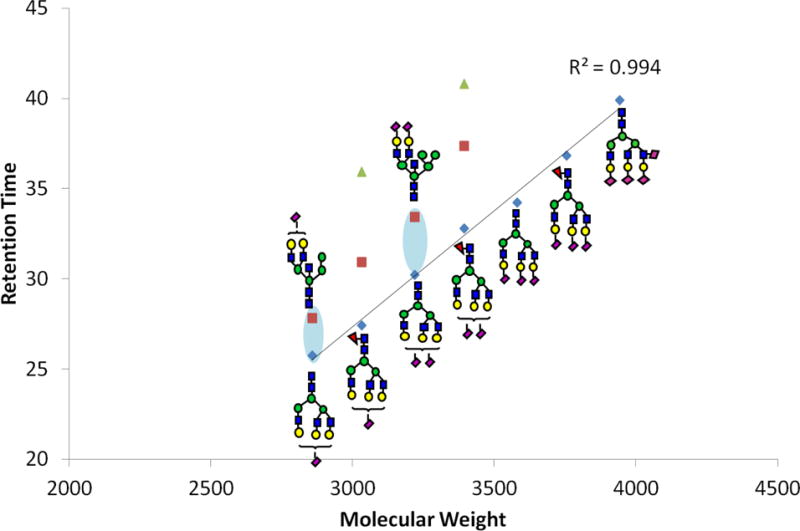
Linear plot of different glycan structures with each of the m/z values detected at two different retention times suggesting structural differences. Symbols: see Figure 1.
According to the above discussion, retention time can be used to predict N-glycans structure. For example, the composition of H6N5S1 and H6N5S2 are two isobaric peaks extracted from the chromatogram at different times. H6N5S1 elutes at 25.93 min and fits the triantennary subgroup line while the peak eluting at 27.5 min is more consistent with the hybrid glycan subgroup line. Similar to H6N5S1, H6N5S2 also has two isobaric peaks extracted from the chromatogram. The lower retention time peak fit the line of the triantennary subgroup. MS/MS data was interpreted for structural elucidation (Figure 4) but there are few diagnostic peaks to allow for structure confirmation. This difference in conformation can be elucidated from the expected relationship between the estimated NPSA and retention time of the glucan models. The N-glycans with the composition of H6N5F1S1 and H6N5F1S2 each have three peaks, which can be attributed to multiple positional and linkage attachments. The specific structures cannot be discerned from tandem MS/MS due to the lack of high collision energy to prompt diagnostic cross ring fragments. In the case of permethylated glycans derived from HBS sample, 78 m/z values were detected with a potential over 117 isomeric structures, suggested by retention times and molecular weight. Although the linear relationships described here is effectively applied to determine glycan structures without tandem MS, we believe that validations of the linear relationships described above are needed in each laboratory prior to implementation.
Figure 4.

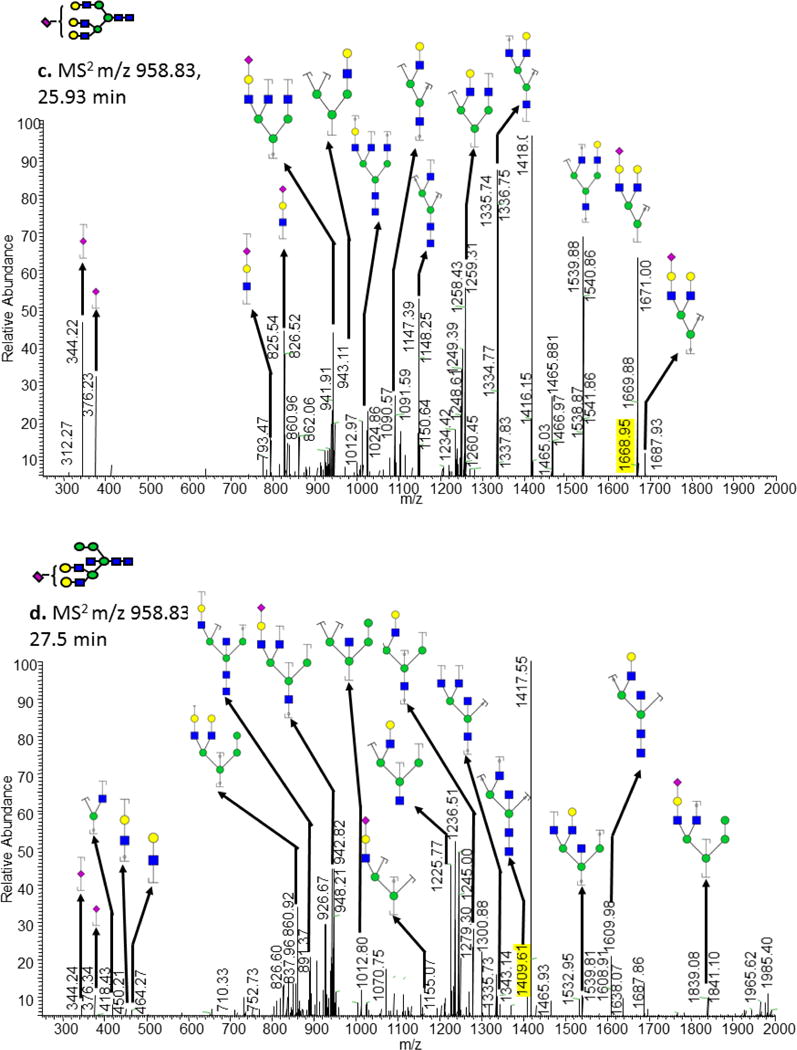
Tandem mass spectra of the ion observed at m/z value of 1079.22 at retention times of (a) 31.95 min, and (b) 33.76 min. Tandem mass spectra of the ion at m/z value of 959.16 at retention times of (c) 25.93 min and (d) 27.5 min. Symbols: see Figure 1. Y-ion fragments are designated with a bracket and a dot while B-ion fragments are designated with a bracket.
Conclusions
In this study, a new method was developed for identifying permethylated N-glycans based on their retention time and molecular weight. Previous studies were mostly based on MS/MS, but as a result of the variability of glycan structure, MS/MS data must be interpreted manually, which increases the complexity and throughput of glycomic studies. In this newly developed method, MS/MS data interpretation is not required for structure identification; all structural identification is based on precursor mass, retention time, and estimated NPSA. Dextrin, dextran and model glycans extracted from RNase B and Fetuin were used to determine the chromatographic behavior of permethylated N-glycans. Next, the glycans from HBS, a complex biological sample, were enzymatically released, reduced, permethylated, and purified by LC-MS. In total, 78 compositions were identified with a mass accuracy less than 2 ppm with the majority of the identified HBS-derived N-glycans falling on a linear line corresponding to their group. Also, when compared to estimated NPSAs, retention time can be used to predict N-glycan compositions, which can be used to differentiate between groups of structures with identical molecular weights. As these LC-MS procedures are further applied to glycomics studies, biomarker discovery will become largely simplified.
Supplementary Material
Acknowledgments
This work was supported by an NIH grant (1R01GM112490).
References
- 1.Helenius A, Aebi M. Science. 2001;291:2364–2369. doi: 10.1126/science.291.5512.2364. [DOI] [PubMed] [Google Scholar]
- 2.Rudd PM, Elliott T, Cresswell P, Wilson IA, Dwek RA. Science. 2001;291:2370–2376. doi: 10.1126/science.291.5512.2370. [DOI] [PubMed] [Google Scholar]
- 3.Dube DH, Bertozzi CR. Nat Rev Drug Discovery. 2005;4:477–488. doi: 10.1038/nrd1751. [DOI] [PubMed] [Google Scholar]
- 4.Chen C, Schmilovitz-Weiss H, Liu X, Pappo O, Halpern M, Sulkes OJ, Braun M, Cohen M, Barak N, Tur-Kaspa R, Vanhooren V, Vlierberghe HV, Libert C, Contreras R, Ben-Ari Z. J Proteome Res. 2009;8 doi: 10.1021/pr800656e. [DOI] [PubMed] [Google Scholar]
- 5.Goetz JA, Mechref Y, Kang P, Jeng M, Novotny MV. Glycoconj J. 2009;26:117–131. doi: 10.1007/s10719-008-9170-4. [DOI] [PubMed] [Google Scholar]
- 6.Mechref Y, Hussein A, Bekesova S, Pungpapong V, Zhang M, Dobrolecki LE, Hickey RJ, Hammoud ZT, Novotny MV. J Proteome Res. 2009;8:2656–2666. doi: 10.1021/pr8008385. [DOI] [PMC free article] [PubMed] [Google Scholar]
- 7.Stanta JL, Sadova R, Struwe WB, Byrne JC, Leweke FM, Rothermund M, Rahmoune H, Levin Y, Guest PC, Bahn S, Rudd PM. J Proteome Res. 2010;9:4476–4489. doi: 10.1021/pr1002356. [DOI] [PubMed] [Google Scholar]
- 8.Mechref Y, Novotny MV. Anal Chem. 2003;75:4895–4903. doi: 10.1021/ac0341968. [DOI] [PubMed] [Google Scholar]
- 9.Mechref Y, Kang P, Novotny MV. Rapid Commun Mass Spectrom. 2006;20:1381–1389. doi: 10.1002/rcm.2445. [DOI] [PMC free article] [PubMed] [Google Scholar]
- 10.Reinhold VN, Reinhold BB, Costello CE. Anal Chem. 1995;67:1772–1784. doi: 10.1021/ac00107a005. [DOI] [PubMed] [Google Scholar]
- 11.Babu P, North SJ, Jang-Lee J, Chalabi S, Mackerness K, Stowell SR, Cummings RD, Rankin S, Dell A, Haslam SM. Glycoconj J. 2009;26:975–986. doi: 10.1007/s10719-008-9146-4. [DOI] [PMC free article] [PubMed] [Google Scholar]
- 12.Wang X, Emmett MR, Marshall AG. Anal Chem. 2010;82 doi: 10.1021/ac1008833. [DOI] [PubMed] [Google Scholar]
- 13.Paschinger K, Razzazi-Fazeli E, Furukawac K, Wilsona IBH. J Mass Spectrom. 2011;46 doi: 10.1002/jms.1925. [DOI] [PMC free article] [PubMed] [Google Scholar]
- 14.Rudd PM, Colominas C, Royle L, Murphy N, Hart E, Merry AH, Hebestreit HF, Dwek RA. Proteomics. 2001;1:285–294. doi: 10.1002/1615-9861(200102)1:2<285::AID-PROT285>3.0.CO;2-G. [DOI] [PubMed] [Google Scholar]
- 15.Wuhrer M, Koeleman CAM, Deelder AM, Hokke CH. Anal Chem. 2004;76:833–838. doi: 10.1021/ac034936c. [DOI] [PubMed] [Google Scholar]
- 16.Karlsson NG, Schulz BL, Packer NH, Whitelock JM. J Chromatogr B. 2005;824:139–147. doi: 10.1016/j.jchromb.2005.07.014. [DOI] [PubMed] [Google Scholar]
- 17.Wuhrer M, Geyer H, Ohe M, Gerardy-Schahn R, Schachner M, Geyer R. Biochimie. 2003;85:207–218. doi: 10.1016/s0300-9084(03)00043-9. [DOI] [PubMed] [Google Scholar]
- 18.Pabst M, Bondili JS, Stadlmann J, Mach L, Altmann F. Anal Chem. 2007;79:5051–5057. doi: 10.1021/ac070363i. [DOI] [PubMed] [Google Scholar]
- 19.Kang P, Mechref Y, Klouckova I, Novotny MV. Rapid Commun Mass Spectrom. 2005;19:3421–3428. doi: 10.1002/rcm.2210. [DOI] [PMC free article] [PubMed] [Google Scholar]
- 20.Kang P, Mechref Y, Novotny MV. Rapid Commun Mass Spectrom. 2008;22:721–734. doi: 10.1002/rcm.3395. [DOI] [PubMed] [Google Scholar]
- 21.Mechref Y, Kang P, Novotny MV. Methods Mol Biol. 2009;534:53–64. doi: 10.1007/978-1-59745-022-5_4. [DOI] [PubMed] [Google Scholar]
- 22.Nicholls A, Sharp KA, Honig B. Proteins. 1991;11:281–296. doi: 10.1002/prot.340110407. [DOI] [PubMed] [Google Scholar]
- 23.Spolar RS, Livingstone JR, Record MTJ. Biochemistry. 1992;31:3947–3955. doi: 10.1021/bi00131a009. [DOI] [PubMed] [Google Scholar]
- 24.Walker SH, Papas BN, Comins DL, Muddiman DC. Anal chem. 2010;82:6636–6642. doi: 10.1021/ac101227a. [DOI] [PMC free article] [PubMed] [Google Scholar]
- 25.Walker SH, Lilley LM, Enamorado MF, Comins DL, Muddiman DC. J Am Soc Mass spectrom. 2011;22:1309–1317. doi: 10.1007/s13361-011-0140-x. [DOI] [PMC free article] [PubMed] [Google Scholar]
- 26.Rundle RE, Edwards FC. J Am Chem Soc. 1943;65:2200–2203. [Google Scholar]
- 27.Alley JWR, Madera M, Mechref Y, Novotny MV. Anal Chem. 2010;82:5095–5106. doi: 10.1021/ac100131e. [DOI] [PMC free article] [PubMed] [Google Scholar]
- 28.Chu CS, Niñonuevo MR, Clowers BH, Perkins PD, An HJ, Yin H, Killeen K, Miyamoto S, Grimm R, Lebrilla CB. Proteomics. 2009;9:1939–1951. doi: 10.1002/pmic.200800249. [DOI] [PMC free article] [PubMed] [Google Scholar]
- 29.Bereman MS, Young DD, Deiters A, Muddiman DC. J Proteome Res. 2009;8:3764–3770. doi: 10.1021/pr9002323. [DOI] [PMC free article] [PubMed] [Google Scholar]
- 30.Bereman MS, Williams T, Muddiman DC. Anal Chem. 2009;81:1130–1136. doi: 10.1021/ac802262w. [DOI] [PMC free article] [PubMed] [Google Scholar]
- 31.Ruhaak LR, C H, Waterreus WJ, de Boer AR, C N, Hokke CH, Deelder AM, Wuhrer M. Anal Chem. 2008;80:6119–6126. doi: 10.1021/ac800630x. [DOI] [PubMed] [Google Scholar]
- 32.Stumpo KA, Reinhold VN. J Proteome Res. 2010;9:4823–4830. doi: 10.1021/pr100528k. [DOI] [PMC free article] [PubMed] [Google Scholar]
Associated Data
This section collects any data citations, data availability statements, or supplementary materials included in this article.