Abstract
Glycans have numerous functions in various biological processes and participate in the progress of diseases. Reliable quantitative glycomic profiling techniques could contribute to the understanding of the biological functions of glycans, and lead to the discovery of potential glycan biomarkers for diseases. Although LC-MS is a powerful analytical tool for quantitative glycomics, the variation of ionization efficiency and MS intensity bias are influencing quantitation reliability. Internal standards can be utilized for glycomic quantitation by MS-based methods to reduce variability. In this study, we used stable isotope labeled IgG2b monoclonal antibody, iGlycoMab, as an internal standard to reduce potential for errors and to reduce variabililty due to sample digestion, derivatization, and fluctuation of nanoESI efficiency in the LC-MS analysis of permethylated N-glycans released from model glycoproteins, human blood serum, and breast cancer cell line. We observed an unanticipated degradation of isotope labeled glycans, tracked a source of such degradation, and optimized a sample preparation protocol to minimize degradation of the internal standard glycans. All results indicated the effectiveness of using iGlycoMab to minimize errors originating from sample handling and instruments.
Keywords: Glycomics, iGlycoMAb, LC-MS/MS, Internal Standard, Permethylation
1. Introduction
Glycomics is an important aspect in bioanalysis because glycosylation is a frequent and biologically relevant post-translation modification (PTM) of proteins. Ongoing research on the structure and function of protein glycosylation has revealed that glycan presence and variations in structures influence and modify multiple biological processes, such as protein folding [1–3], cell-cell and cell-matrix recognition and interaction [4–6], and host-pathogen interactions[7, 8]. Precise and rapid means to quantify different glycan structures could accelerate gaining an understanding of biosynthesis, structural variation, and biological impact of these structures. Separate from gaining a clearer understanding of the underlying biology, glycomic analysis can potentially define novel biomarkers for various diseases, including cancers [9–12].
Many methods have been utilized in glycomic profiling, including, LC-UV/fluorescence, lectin microarrays [13–15], and mass spectrometry (MS) based approaches. Comprehensive and sensitive glycomic quantitation can be achieved by MS-based analysis strategies. High-resolution MS enables precise identification of glycan composition based on molecular weight. Detailed glycan structure information can also be obtained by tandem MS. MS-based quantitation methods are inherently more complex than optical detection methods. The generation of ions for analysis is a complex process, subject to variables that can be difficult to exactly control. MS signal intensity is directly linked to the ionization efficiency of the analyte. Matrix-assisted laser desorption ionization (MALDI) and electrospray ionization (ESI) are the two most commonly used ionization methods for biomolecule MS analysis. The ion abundance generated by MALDI is significantly influenced by the quality of sample spot crystal and positions hit by laser beam [16]. Similarly, ESI ionization efficiency is also influenced by the quality of the electrospray; changes of ESI needle condition, sheath gas flow, and solvent composition could all result in the fluctuation of the signal. Moreover, ESI is often utilized in interfacing separation instruments to MS, in which case the analysis would last from 10 minutes to 2 hours per sample. Extended analysis time makes it difficult to keep consistent ionization efficiency from sample to sample, batch to batch. The second aspect is from the change of intensities from the MS detector after calibrations, which would influence the comparison of sample runs in the extended time range. Despite all those uncertainties, MS-based analysis strategy is still the most powerful quantitation method in glycomic profiling. Developing reliable MS-based quantitative glycomic profiling method is essential to biomarker discovery.
Several efforts have been undertaken to improve the reliability of glycomic quantitation by MS [17–20]. The most straightforward method is to spike a known internal standard into samples; this is especially effective in MALDI-MS analysis because all glycans and internal standards are simultaneously ionized and analyzed. Maltoheptaose and several other carbohydrates consisting of repeating units of monosaccharides are usually utilized as an internal standard for glycan quantitation because maltoheptaose has a similar mass to the average mass of N-linked glycans and close chemical property to glycans [21–24]. Multiplex analysis using stable-isotope-labeled derivatization reagents is another strategy for reliable glycomic quantitative analysis. In the MS-based glycomic analysis, glycans are usually derivatized to improve ionization efficiency in positive ion mode and to stabilize sialic acids in glycan. Reported methods included isotopic labeling through “heavy” and “light” permethylation [25–28] and specialized reducing end labeling such as P2GPN, INLIGHT™ and the like [24, 29–37]. The isotope can also be introduced into glycan through metabolic incorporation or via water incorporation during the catalytic cycle of PNGase F digestion [38, 39]. Isobaric tags (TMT [40, 41], iARTs[42]) were developed to allow quantitative comparison of glycans from different samples through fragment reporter ion ratios in MS2. All these methods can contribute to reducing analytical variation due to instrumentation contributions, including ionization efficiency variance and MS bias.
Valid glycomic biomarker discovery relies on sufficiently large sample sizes to represent sample populations (often more than one hundred samples). Large sample numbers also challenge efficient and reproducible preparation, particularly when data collection can occur a cross distant sites, or through multiple operators. Although high-throughput methods have been developed for simultaneous handling of 96 samples, many glycomic sample preparation protocols split individual samples into batches. Thus, it is important to maintain consistency among different batches. Meanwhile, quantitation of released N-glycans is also influenced by PNGase F digestion efficiency [43–45], which may be affected by sample matrix or other operational variables (time, temperature, protein sequence, etc.). Here, we are more focusing on the PNGase F digestion efficiency fluctuation results from user’s bias. Development of an internal standard that could normalize for possible variations due to enzymatic release, sample preparation and LC-MS is necessary to improve quantitation accuracy and precision.
In this study, we investigated the ability of iGlycoMab, which is a highly purified murine IgG2b monoclonal antibody, with attached glycans that are labeled with the stable isotope (15N), to reduce variations in LC-MS quantitative analysis of permethylated N-glycans. We observed a potential limitation in formation or recovery of isotope labeled glycan, relative to quantities of native glycans when improper sample procedures are used. Experiments were conducted to verify conditions that would avoid loss or conversion of 15N labeled IgG glycan to appear as native glycan.
2. Experiment Methods
2.1 Reagents and Instruments
HPLC grade acetonitrile, methanol, acetic acid and water were purchased from Fisher Scientific (Pittsburgh, PA). Dimethyl sulfoxide (DMSO, >99.9%), sodium hydroxide beads (20–40 mesh), iodomethane, borane-ammonia complex ribonuclease B and bovine fetuin were purchased from Sigma-Aldrich (St. Louis, MO), IgG standard was from Waters (Milford, MA), iGlycoMab was provided by GlycoScientific (Athens, GA), cell line HTB-131 was purchased from ATCC (Manassas, VA), PNGase F was obtained from New England Biolabs (Ipswich, MA) and Trypsin MS grade was procured from Promega (Madison, WI). Empty micro spin column with 5 μm frit was from Harvard Apparatus (Holliston, MA). Centrifugal filter (10k MWCO) was purchased from Millipore (Billerica, MA). UltiMate 3000 nanoLC system and LTQ Orbitrap Velos mass spectrometer (Thermo Scientific, Sunnyvale, CA) were utilized for LC-MS analysis of glycans. C18 trapping column (3μm particle size, 2 cm length) and Acclaim Pepmap RSLC C18 column (2μm particle size, 75 μm i.d., 15 cm length) were used for online purification and reverse phase nanoLC separation of permethylated glycans.
2.2 Sample Preparation
We spiked 2 μg iGlycoMab into a solution of mixed model glycoproteins, which is composed of 5 μg of ribonuclease B and 5 μg of fetuin. Then mixed glycoproteins with PBS buffer (pH 7.5) were thermally denatured in 60 °C water bath for 1 hour. After that, about 60 units of PNGase F was added to denatured sample and 18 hours enzymatic digestion was conducted in a 37°C water bath. iGlycoMab was also spiked into human blood serum and denatured and digested with different protocols, including thermal denaturation at 60 °C and 90 °C, purify proteins or tryptic digest proteins prior to PNGase F treatment. All released glycans were reduced by ammonium borane complex and permethylated using the solid-phase permethylation method. The permethylation protocol is as following; dried reduced glycans were resuspended with 1.2 μL of water, 30 μL of DMSO and 20 μL of iodomethane, and then the mixture was loaded to a spin column freshly packed with sodium hydroxide beads. Next, the derivatization is allowed to proceed for 45 minutes. An additional 20-μL aliquot of iodomethane was added in the middle of incubation. The final product was eluted with 100 μL acetonitrile and dried in a speed vacuum.
2.3 LC-MS/MS Conditions
Derivatized samples were directly subjected to LC-MS analysis. Samples were first online purified in the C18 trapping column and flushed by loading solution (water with 0.1% formic acid) for 10 minutes. Analytes were separated on the C18 column with the following gradient; the percentage of mobile phase B (acetonitrile with 0.1% formic acid) increased from 38 to 60% in 35 min. Mobile phase B was then elevated to 90% over 3 min and maintained at that percentage for 5 min. Finally, B was set to 20% to equilibrate the system for the next run. Full MS resolution was set to 15,000 to ensure a confident precursor glycan identification within 5 ppm mass accuracy. Four data-dependent acquisition (DDA) MS2 were acquired following full MS event. MS2 spectra were generated by collision-induced dissociation (CID, settings) and higher energy collisional dissociation (HCD, settings). Glycan structures can be verified by MS2 spectrum (reference). LC-MS data was analyzed both manually by calculating the peak areas in extracted ion chromatograms (EIC) and MultiGlycan [46, 47]. The peak area was used to represent the intensity of the corresponding glycan.
3. Results and Discussion
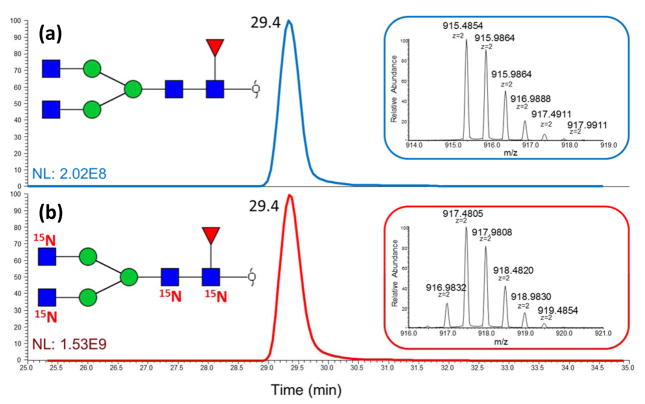
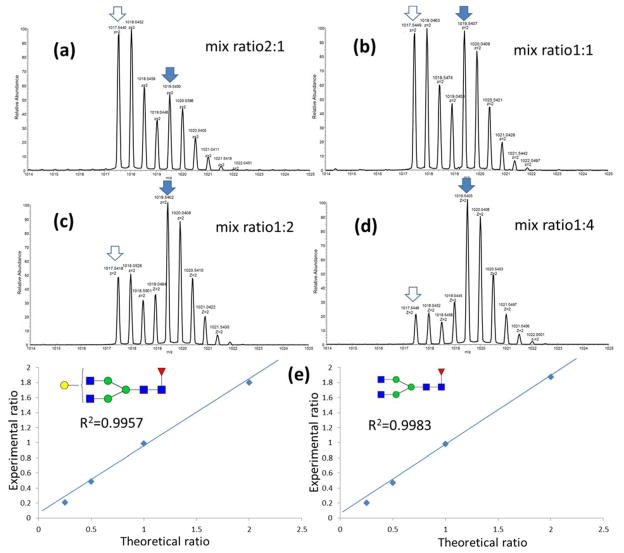
Initially, iGlycoMab glycans were analyzed to evaluate the 15N labeling efficiency. Glycan F1A2, which contains 4 N-acetylglucosamines, was examined as a representative of iGlycoMab glycans. The predicted monoisotopic mass should be incremented by 3.9882 Da, which matches the spectrum exhibiting the major isotopic m/z peak of fully 15N labeled F1A2. The incremented mass of 2.9911 is also observed in the spectrum (Figure 1 insert), which corresponds to 15N labeling efficiency on each site of 94.8%. During the comparison between IgG standard and iGlycoMab in RPLC-MS analysis, it can be concluded that the 15N isotope on N-acetylglucosamines has no influence on the retention time on the C18 column (Figure 1). This can be an advantage, indicating that including iGlycoMab internal standard would not complicate LC-MS; meanwhile, it can be a disadvantage because 15N labeled glycans are overlapped with normal glycans both in LC retention time and MS spectrum. In this case, the interference of isotopic peak from normal glycans would possiblly influence the first monotopic peak of iGlycoMab glycans, resulting in errors of internal standard intensity calculation when analyte glycan intensity is substantially higher than iGlycoMab glycans. Hence, it is necessary to ensure that adequate iGlycoMab internal standard is spiked into the sample. Permethylated glycans released from native IgG standard and iGlycoMab were mixed with 2:1, 1:1, 1:2 and 1:4 ratios. The spectrum for [M+2H]2+ of glycan F1A2G1 is shown in Figure 2 a–d. The ratio of the first monoisotopic peak at 1017.5449 and 1019.5407 precisely matches the synthetic mix ratio. The intensities of glycans from both sources were determined by EIC peak area. The R-square value for linear fitting between theoretical mix ratio and experimental intensity ratio is 0.9957 and 0.9983 for glycan F1A2 and F1A2G1, versus 0.9685 and 0.9722 when normalization was not employed. This test verified the capability of improving quantitation reliability by spiking 15N labeled glycans into analytes before LC-MS analysis.
Figure 1.
Extracted ion chromatograms (EIC) and MS spectra of N-glycans released from (a) IgG standard and (b) iGlycoMab. Glycowork Bench was used to draw glycan structures. Symbols:
 , N-acetylglucosamine (GlcNAc);
 , Galactose (Gal);
 , Fucose (Fuc);
 , Mannose (Man);
 , Glucose (Glc);
 , N-acetylneuraminic acid (NeuAc/Sialic Acid).
Figure 2.
MS spectra of mixing native IgG glycans with isotope labeled IgG glycans in the ratios of a) 2:1, b) 1:1, c) 1:2 and d) 1:4. Panel e) illustrates the linearity of theoretical ratios vs. experimental ratios. Symbols: as in Figure 1.
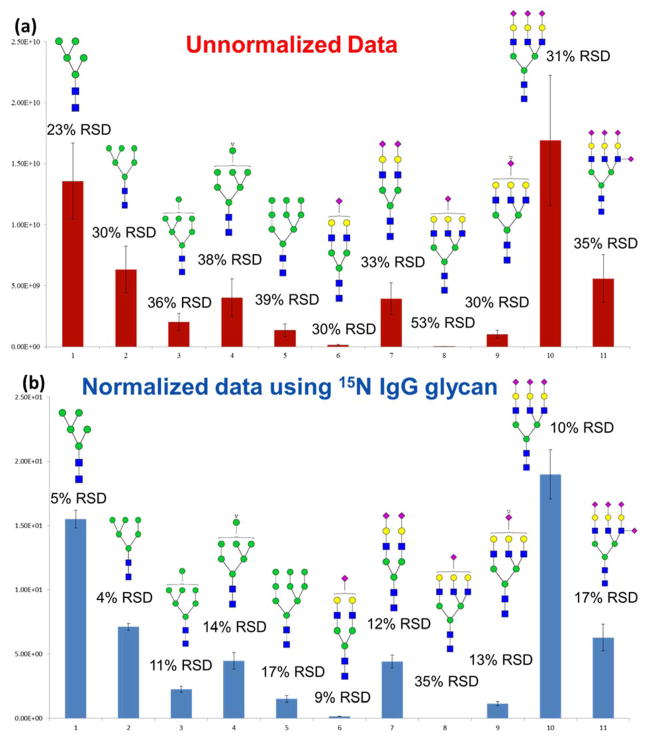
The iGlycoMab was spiked into a model glycoprotein mixture consisting of ribonuclease B and fetuin, and the protein mixture was processed together through the entire sample preparation and analysis procedure, with the following steps; denaturation, PNGase F digestion, purification, reduction, permethylation and LC-MS analysis. This procedure was perfromed in triplicates to evaluate the variation originating from both sample preparation and LC-MS analysis. In this case, the introduction of iGlycoMab could normalize the errors originating from all these analytical steps. The intensity of 5 high mannose glycans from ribonuclease B and 6 sialylated glycans from fetuin among independent triplicates were plotted as shown in Figure 3a. The relative standard deviation (RSD) of the high mannose structures ranged from 23% to 39%, while for sialylated structures, the RSD varied between 30% to 53%. The RSD is affected by the abundance of the glycan. For example, the most abundant structure in ribonuclease B, Man5, has lowest RSD and the least abundant structure in fetuin, A3G3S, has the highest RSD. Then the intensity is normalized by the intensity of 15N labeled glycans. The absolute value of intensities was divided by intensity of 15N F1A2G1. After normalization, the RSD of Man5 and Man6 decreased to less than 5% (Figure 3b). The RSD of sialylated glycans also decreased to half or one-third of the RSD without normalization. These results indicate that the precision of analysis can be improved by spiking iGlycoMab from the very first step of sample preparation. A significant reduction of RSD is noted when the glycan elution time is close to the elution time of 15N F1A2G1. This observation suggests that fluctuation of nanoESI could be a source of variation for glycan analysis.
Figure 3.
Bar graphs representing intensity variation of biological (n = 3) analyses of N-glycans released from model glycoprotein mixtures a) without normalization and b) with normalization using 15N-glycans derived from iGlycoMab. Symbols: as in Figure 1.
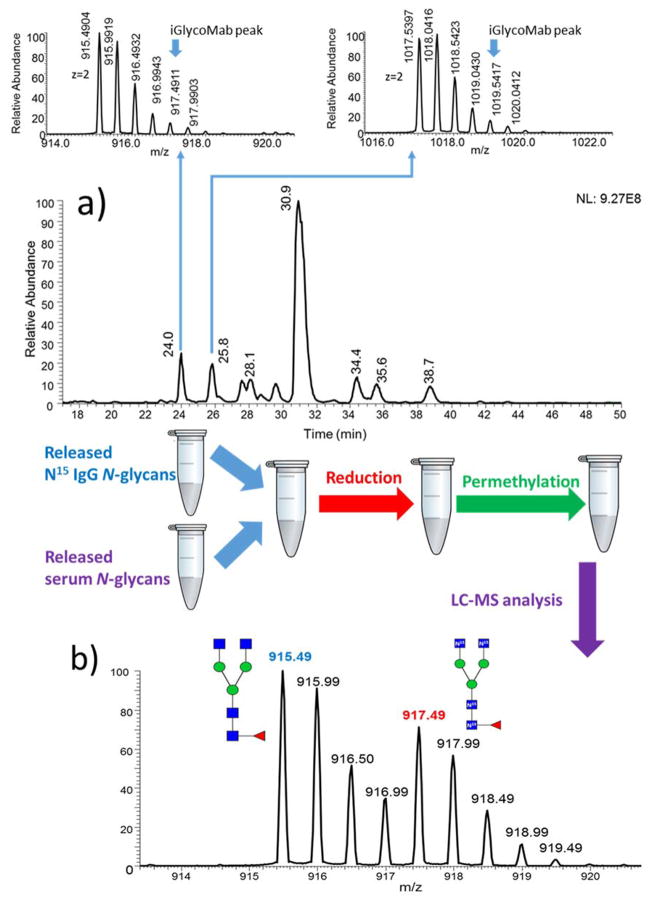
The utility of iGlycoMab to normalize analyses was further tested with a more complex sample, human blood serum. 5μg of iGlycoMab was spiked into 1 μL of human blood serum at the beginning of sample preparation. However, after the same sample handling and analysis procedure, the 15N labeled glycan peaks cannot be found in the spectrum, as shown in Figure 4a. We can only see the native F1A2 and F1A2G1 peaks from IgG in human serum. The first possible explanation for the missing 15N labeled glycan peaks is that the abundance of iGlycoMab is much lower than the IgG in human serum, therefor the 15N labeled glycan signal is masked by IgG glycan in blood serum. When we mixed separately prepared 1 μL blood serum and 5 μg iGlycoMab in 1:1 ratio and analyzed by LC-MS, isotope labeled F1A2 and F1A2G1 were observed in the spectrum at an intensity comparable to that of glycans derived from human serum IgG. Hence, the missing 15N isotope labeled glycan peak does not result from the insufficient iGlycoMab spiking amount. A more likely explanation is that the sample digestion and derivatization processes are prompting the loss of 15N glycans.
Figure 4.
a) Base peak intensity (BPI) chromatograms and MS spectra for F1A2 and F1A2G1 glycans subjected to thermal denaturation at 60 °C. b) Combine blood serum glycan with iGlycoMab glycan after PNGase F digestion. Symbols: as in Figure 1.
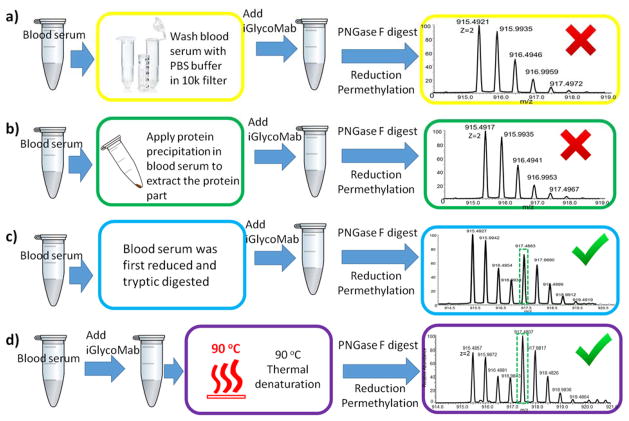
To examine this possibility, and to establish the step at which the disappearance of 15N glycans occurs, human serum and iGlycoMab were mixed together; a) before themal denaturation and PNGase F digestion; b) before glycan reducing end reduction, and c) before solid-phase permethylation. From the MS spectral analyses, 15N glycan from iGlycoMab is apparent when it is spiked before reduction and permethylation (Figure 4b). The results indicate that the loss of the isotope label occurs during denaturation and PNGase F digestion. Compared with the model glycoprotein samples we tested above, human blood serum is a more sophisticated mixture with complex sample matrix. There is a possibility that the sample matrix is causing the loss of 15N glycan. To test this possibility, different methods to purify the sample matrix before denaturation and PNGase F digestion were examined. First, ice-cold 90% ethanol was employed to precipitate proteins, the supernatant was discarded, and precipitated blood serum protein and iGlycoMab were resuspended and subjected to the same sample preparation protocol described above. The second purification method utilized involved the use of a 10k MWCO spin filter to recover blood serum proteins, in this case, impurities smaller than 10k Da are eliminated. However, in both purification methods isotope labeling were lost (Figure 5a, b). Accordingly it appears that blood serum proteins are prompting the loss of 15N glycan, and possibly the result of an enzymatic process. To test this hypothesis, we used harsher denaturation to ensure that all proteins in the sample matrix have lost their bioactivity. The high-temperature denaturation was conducted at 90 °C and lasted for 20 minutes rather than our routine one-hour denaturation protocol with 60 °C water bath. The expectation is that PNGase F release and glycan recovery would not vary between the thermal denaturation at 60 °C for 1 hour and 90 °C for 20 minutes. The result shown in Figure 5c demonstrates that the glycans from iGlycoMab are present after the whole preparation and analysis processes. We repeated the experiments with different denaturation conditions side by side, with the result that 15N labeled glycans can be consistently detected and EICs reproducibly obtained across many replicates, when appropriate conditions are employed. For example, the intensity of native F1A2 in 60 °C denaturation protocol is higher than the native F1A2 in 90 °C denaturation protocol, and the sum of the intensities of native F1A2 and 15N F1A2 prepared at 90 °C denaturation protocol is close to the intensity of native F1A2 at 60 °C denaturation protocol. This result suggests that 15N glycans are converted to non-isotope labeled glycans when the denaturation is incomplete. We also tried to reduce, alkylate and tryptic digest human serum iGlycoMab mixture before PNGase F digestion. In this case, isotope labeled glycans do not appear to be converted to native glycans (Figure 5d). This further supports that 15N glycan degradation can be prevented by completely inhibiting the bioactivity of proteins in human blood serum. The various sample preparation protocols and results are summarized in Table 1.
Figure 5.
A schematic representative of the different experiments performed, including a) purifying proteins by filteration, b) purifying proteins by precipitation and c) tryptic digestion before deglycosylation and d) denature sample mixture at 90 °C. Symbols: as in Figure 1.
Table 1.
Summary for different sample preparation protocols and whether 15N glycan peaks can be picked.
| Mix iGlycoMab with blood serum | Pre-treatment | Denaturation condition | 15N glycan identified |
|---|---|---|---|
| Before denaturation and PNGase F digestion | None | 60°C, 1hour | No |
| after digestion, before reduction | None | 60°C, 1hour | Yes |
| after reduction, before permethylation | None | 60°C, 1hour | Yes |
| Before denaturation and PNGase F digestion | Protein precipitation | 60°C, 1hour | No |
| Before denaturation and PNGase F digestion | wash though 10k MWCO filter | 60°C, 1hour | No |
| Before denaturation and PNGase F digestion | None | 90°C, 20 minutes | Yes |
| Before denaturation and PNGase F digestion | Tryptic digestion | 60°C, 1hour | Yes |
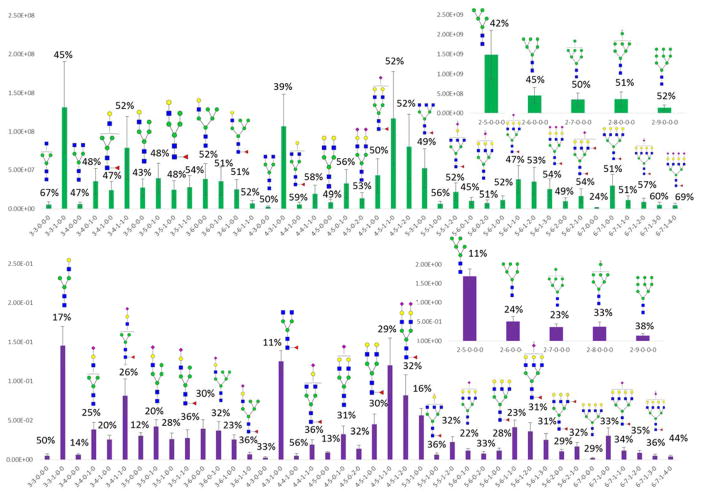
We additionally tested the use of iGlycoMab in the biological replicates analyses of N-glycans released form breast cancer cell line HTB-131. 1μg of iGlycoMab was added to 100 μg of extracted cell line protein. Figure 6a exhibits the glycan intensities, or normalized ratio results (Figure 6b), for three biological triplicates. The normalized results exhibit greatly decreased variance, with RSDs below 10% most of the released glycans measure in these cell line proteins. The quantitative glycomic profiling of cell line is much more reliable after normalization by the iGlycoMab internal standard.
Figure 6.
Bar graph of the relative intensities of the N-glycans released from a HTB-131 cell line (biological triplicate; n = 3) a) without normalization and b) with normalization using 15N glycans derived from iGlycoMab. Error bars are reflective of the standard error of the mean values (SEM). Symbols: as in Figure 1.
4. Conclusion
In this study, we applied iGlycoMab in the quantitative LC-MS analysis of permethylated N-glycans released from model glycoproteins, human blood serum, and breast cancer cell lines. The results highlighted the advantage of including an internal standard for quantitation, and the utility of the 15N labeled iGlycoMab to reduce variations originating from sample preparation and LC-MS analysis. We observed an unanticipated degradation of isotope labeled glycan when iGlycoMab is denatured and digested with blood serum. The degradation can be avoided by increasing the denaturation temperature or by tryptic digesting of samples prior to the addition of iGlycoMab internal standard.
Acknowledgments
This work was funded in part by financial support from the NIH (YM, 1R01GM112490-01, RO 1R41GM113666-01).
References
- 1.Molinari M. Nature Chemical Biology. 2007;3:313–320. doi: 10.1038/nchembio880. [DOI] [PubMed] [Google Scholar]
- 2.Parodi AJ. Annual Review of Biochemistry. 2000;69:69–93. doi: 10.1146/annurev.biochem.69.1.69. [DOI] [PubMed] [Google Scholar]
- 3.Kleizen B, Braakman I. Current Opinion in Cell Biology. 2004;16:597–597. doi: 10.1016/j.ceb.2004.06.012. [DOI] [PubMed] [Google Scholar]
- 4.Kleene R, Schachner M. Nature Reviews Neuroscience. 2004;5:195–208. doi: 10.1038/nrn1349. [DOI] [PubMed] [Google Scholar]
- 5.Krenn EC, Wille I, Gesslbauer B, Poteser M, van Kuppevelt TH, Kungl AJ. Biochemical and Biophysical Research Communications. 2008;375:297–302. doi: 10.1016/j.bbrc.2008.07.144. [DOI] [PubMed] [Google Scholar]
- 6.Liang PH, Wu CY, Greenberg WA, Wong CH. Current Opinion in Chemical Biology. 2008;12:86–92. doi: 10.1016/j.cbpa.2008.01.031. [DOI] [PMC free article] [PubMed] [Google Scholar]
- 7.Schaible UE, Kaufmann SHE. Trends in Microbiology. 2005;13:373–380. doi: 10.1016/j.tim.2005.06.009. [DOI] [PubMed] [Google Scholar]
- 8.van Kooyk Y, Rabinovich GA. Nature Immunology. 2008;9:593–601. doi: 10.1038/ni.f.203. [DOI] [PubMed] [Google Scholar]
- 9.Packer NH, von der Lieth CW, Aoki-Kinoshita KF, Lebrilla CB, Paulson JC, Raman R, Rudd P, Sasisekharan R, Taniguchi N, York WS. Proteomics. 2008;8:8–20. doi: 10.1002/pmic.200700917. [DOI] [PubMed] [Google Scholar]
- 10.An HJ, Kronewitter SR, de Leoz ML, Lebrilla CB. Current Opinion in Chemical Biology. 2009;13:601–607. doi: 10.1016/j.cbpa.2009.08.015. [DOI] [PMC free article] [PubMed] [Google Scholar]
- 11.Lebrilla CB, An HJ. Mol Biosyst. 2009;5:17–20. doi: 10.1039/b811781k. [DOI] [PubMed] [Google Scholar]
- 12.Arnold JN, Saldova R, Galligan MC, Murphy TB, Mimura-Kimura Y, Telford JE, Godwin AK, Rudd PM. J Proteome Res. 2011;10:1755–1764. doi: 10.1021/pr101034t. [DOI] [PubMed] [Google Scholar]
- 13.Chen S, LaRoche T, Hamelinck D, Bergsma D, Brenner D, Simeone D, Brand RE, Haab BB. Nat Methods. 2007;4:437–444. doi: 10.1038/nmeth1035. [DOI] [PubMed] [Google Scholar]
- 14.Angeloni S, Ridet JL, Kusy N, Gao H, Crevoisier F, Guinchard S, Kochhar S, Sigrist H, Sprenger N. Glycobiology. 2005;15:31–41. doi: 10.1093/glycob/cwh143. [DOI] [PubMed] [Google Scholar]
- 15.Rosenfeld R, Bangio H, Gerwig GJ, Rosenberg R, Aloni R, Cohen Y, Amor Y, Plaschkes I, Kamerling JP, Maya RB. J Biochem Biophys Methods. 2007;70:415–426. doi: 10.1016/j.jbbm.2006.09.008. [DOI] [PubMed] [Google Scholar]
- 16.Chen H, He M. J Am Soc Mass Spectrom. 2005;16:100–106. doi: 10.1016/j.jasms.2004.09.024. [DOI] [PubMed] [Google Scholar]
- 17.Miura Y, Shinohara Y, Furukawa JI, Nagahori N, Nishimurara S. Chem-Eur J. 2007;13:4797–4804. doi: 10.1002/chem.200601872. [DOI] [PubMed] [Google Scholar]
- 18.Kyselova Z, Mechref Y, Kang P, Goetz JA, Dobrolecki LE, Sledge GW, Schnaper L, Hickey RJ, Malkas LH, Novotny MV. Clin Chem. 2008;54:1166–1175. doi: 10.1373/clinchem.2007.087148. [DOI] [PubMed] [Google Scholar]
- 19.Miura Y, Hato M, Shinohara Y, Kuramoto H, Furukawa JI, Kurogochi M, Shimaoka H, Tada M, Nakanishi K, Ozaki M, Todo S, Nishimura SI. Mol Cell Proteomics. 2008;7:370–377. doi: 10.1074/mcp.M700377-MCP200. [DOI] [PubMed] [Google Scholar]
- 20.Kang P, Mechref Y, Kyselova Z, Goetz JA, Novotny MV. Anal Chem. 2007;79:6064–6073. doi: 10.1021/ac062098r. [DOI] [PubMed] [Google Scholar]
- 21.Snovida SI, Rak-Banville JM, Perreault H. J Am Soc Mass Spectrom. 2008;19:1138–1146. doi: 10.1016/j.jasms.2008.04.033. [DOI] [PubMed] [Google Scholar]
- 22.Szabo Z, Guttman A, Rejtar T, Karger BL. Electrophoresis. 2010;31:1389–1395. doi: 10.1002/elps.201000037. [DOI] [PMC free article] [PubMed] [Google Scholar]
- 23.Bereman MS, Comins DL, Muddiman DC. Chemical Communications. 2010;46:237–239. doi: 10.1039/b915589a. [DOI] [PubMed] [Google Scholar]
- 24.Walker SH, Budhathoki-Uprety J, Novak BM, Muddiman DC. Anal Chem. 2011;83:6738–6745. doi: 10.1021/ac201376q. [DOI] [PMC free article] [PubMed] [Google Scholar]
- 25.Atwood JA, Cheng L, Alvarez-Manilla G, Warren NL, York WS, Orlando R. J Proteome Res. 2008;7:367–374. doi: 10.1021/pr070476i. [DOI] [PubMed] [Google Scholar]
- 26.Alvarez-Manilla G, Warren NL, Abney T, Atwood J, Azadi P, York WS, Pierce M, Orlando R. Glycobiology. 2007;17:677–687. doi: 10.1093/glycob/cwm033. [DOI] [PubMed] [Google Scholar]
- 27.Aoki K, Perlman M, Lim JM, Cantu R, Wells L, Tiemeyer M. Journal of Biological Chemistry. 2007;282:9127–9142. doi: 10.1074/jbc.M606711200. [DOI] [PubMed] [Google Scholar]
- 28.Hu YL, Desantos-Garcia JL, Mechref Y. Rapid Communications in Mass Spectrometry. 2013;27:865–877. doi: 10.1002/rcm.6512. [DOI] [PMC free article] [PubMed] [Google Scholar]
- 29.Yuan J, Hashii N, Kawasaki N, Itoh S, Kawanishi T, Hayakawa T. J Chromatogr A. 2005;1067:145–152. doi: 10.1016/j.chroma.2004.11.070. [DOI] [PubMed] [Google Scholar]
- 30.Hitchcock AM, Costello CE, Zaia J. Biochemistry. 2006;45:2350–2361. doi: 10.1021/bi052100t. [DOI] [PMC free article] [PubMed] [Google Scholar]
- 31.Hitchcock AM, Yates KE, Shortkroff S, Costello CE, Zaia J. Glycobiology. 2006;17:25–35. doi: 10.1093/glycob/cwl046. [DOI] [PMC free article] [PubMed] [Google Scholar]
- 32.Prien JM, Prater BD, Qin Q, Corckrill SL. Anal Chem. 2010;82:1498–1508. doi: 10.1021/ac902617t. [DOI] [PubMed] [Google Scholar]
- 33.Walker SH, Carlisle BC, Muddiman DC. Anal Chem. 2012;84:8198–8206. doi: 10.1021/ac3012494. [DOI] [PMC free article] [PubMed] [Google Scholar]
- 34.Walker SH, Lilley LM, Enamorado MF, Comins DL, Muddiman DC. J Am Soc Mass Spectrom. 2011;22:1309–1317. doi: 10.1007/s13361-011-0140-x. [DOI] [PMC free article] [PubMed] [Google Scholar]
- 35.Walker SH, Muddiman DC. Nanomedicine and Cancer. 2011:307.
- 36.Walker SH, Taylor AD, Muddiman DC. J Am Soc Mass Spectrom. 2013;24:1376–1384. doi: 10.1007/s13361-013-0681-2. [DOI] [PMC free article] [PubMed] [Google Scholar]
- 37.Walker SH, Taylor AD, Muddiman DC. Rapid Communications in Mass Spectrometry. 2013;27:1354–1358. doi: 10.1002/rcm.6579. [DOI] [PMC free article] [PubMed] [Google Scholar]
- 38.Orlando R, Lim JM, Atwood JA, Angel PM, Fang M, Aoki K, Alvarez-Manilla G, Moremen KW, York WS, Tiemeyer M, Pierce M, Dalton S, Wells L. J Proteome Res. 2009;8:3816–3823. doi: 10.1021/pr8010028. [DOI] [PMC free article] [PubMed] [Google Scholar]
- 39.Xue XD, Sun YJ, Liu Y, Zhang P, Wang ZF, Huang LJ. Acta Chimica Sinica. 2014;72:220–226. [Google Scholar]
- 40.Hahne H, Neubert P, Kuhn K, Etienne C, Bomgarden R, Rogers JC, Kuster B. Anal Chem. 2012;84:3716–3724. doi: 10.1021/ac300197c. [DOI] [PubMed] [Google Scholar]
- 41.Zhong XF, Chen ZW, Snovida S, Liu Y, Rogers JC, Li LJ. Anal Chem. 2015;87:6527–6534. doi: 10.1021/acs.analchem.5b01835. [DOI] [PMC free article] [PubMed] [Google Scholar]
- 42.Yang S, Yuan W, Yang W, Zhou J, Harlan R, Edwards J, Li S, Zhang H. Anal Chem. 2013;85:8188–8195. doi: 10.1021/ac401226d. [DOI] [PMC free article] [PubMed] [Google Scholar]
- 43.Huang JF, Wan H, Yao YT, Li JN, Cheng K, Mao JW, Chen J, Wang Y, Qin HQ, Zhang WB, Ye ML, Zou HF. Anal Chem. 2015;87:10199–10204. doi: 10.1021/acs.analchem.5b02669. [DOI] [PubMed] [Google Scholar]
- 44.Weng YJ, Sui ZG, Jiang H, Shan YC, Chen LF, Zhang S, Zhang LH, Zhang YK. Sci Rep-Uk. 2015;5 doi: 10.1038/srep09770. [DOI] [PMC free article] [PubMed] [Google Scholar]
- 45.Fan JQ, Lee YC. J Biol Chem. 1997;272:27058–27064. doi: 10.1074/jbc.272.43.27058. [DOI] [PubMed] [Google Scholar]
- 46.Hu Y, Zhou S, Yu CY, Tang H, Mechref Y. Rapid communications in mass spectrometry: RCM. 2015;29:135–142. doi: 10.1002/rcm.7093. [DOI] [PMC free article] [PubMed] [Google Scholar]
- 47.Yu CY, Mayampurath A, Hu Y, Zhou S, Mechref Y, Tang H. Bioinformatics. 2013;29:1706–1707. doi: 10.1093/bioinformatics/btt190. [DOI] [PMC free article] [PubMed] [Google Scholar]


