

Abstract
We report the influence of catalyst loading on rates of platinum degradation in acidic electrolyte at room temperature. A piezoelectric printer is used to deposit spotted arrays of a commercially available catalyst comprised of Pt nanoparticles on a porous carbon support. The kinetically controlled oxygen reduction reaction (ORR) activity at different loadings is measured using an electrochemical scanning flow cell (SFC), and found to be quite stable over the range of loadings studied. This behaviour, however, contrasts sharply with rates of both transient and quasi‐steady‐state platinum dissolution. These are shown using downstream inductively coupled plasma mass spectrometry (ICP‐MS) analytics, to increase as loading becomes lower. This dichotomy between activity and stability has direct implications for the development of improved catalyst materials, as well as for the achievement of current targets for reduced loadings of noble metals for fuel cells and other energy storage devices.
Keywords: activity, fuel cells, oxygen reduction, platinum, stability
The instability of proton exchange membrane fuel cell (PEMFC) components is one of the primary obstacles to the viability of these devices.1 Economic constraints have given impetus to the study and development of catalyst materials which require minimal loading of precious metal, while still having acceptable operational lifetimes. Due to their high activity and stability, carbon‐supported platinum nanoparticles, and alloys thereof, are seen as the best available catalysts for the sluggish oxygen reduction reaction (ORR) at PEMFC cathodes.2 However, the harsh operating conditions used in fuel cells and other energy conversion devices mean that even platinum is susceptible to dissolution, particularly during the formation and reduction of platinum oxides.3 Moreover, we have recently demonstrated4 that quasi‐steady‐state Pt dissolution can occur during polarisation at potentials as low as 0.85 V with respect to the reversible hydrogen electrode (RHE). Rates of noble‐metal dissolution, of course, are relatively low, but they are significant over the long periods (years) these appliances are needed for. Indeed, they can become critical when real‐world economic targets are considered, such as those laid out by the United States Department of Energy.5
In order to enhance our fundamental understanding of degradation processes as a platform for the development of viable mitigation strategies, we have developed a unique experimental setup which combines an electrochemical scanning flow cell (SFC) with downstream inductively coupled plasma mass spectrometry (ICP‐MS) analytics. This arrangement permits the time‐resolved quantification of even small traces of dissolved platinum and other elements, and we have used it to investigate Pt dissolution, predominantly from model polycrystalline surfaces.6 In contrast, the stability of high‐surface‐area catalysts used in real appliances has not been thoroughly investigated.7 In this communication, the fundamental influence of catalyst loading on platinum stability, as an essential basis for any further material studies, is presented for the first time in a time‐resolved manner. A commercially available catalyst is deposited as arrays of small spots using a drop‐on‐demand piezoelectric printer, enabling high‐throughput, reproducible screening with the combined SFC/ICP‐MS setup. The results indicate that this variable, hitherto largely overlooked, is of pivotal importance with respect to the application of Pt‐based electrocatalysts in fuel cells and other devices.
The catalyst was printed on a glassy carbon plate as shown in Figure 1 a, with four rows consisting of five spots, each row containing different numbers of layers. The spots are separated by a distance of 2 mm, enough to enable a comfortable approach using the scanning flow cell. It can be seen in the optical profilometry image in Figure 1 b that the initial layer spreads out to a diameter of 700–800 μm, whereas subsequent layers are confined to a significantly smaller diameter. Such deposits can be easily encompassed by the opening in the SFC, which is around 1 mm in diameter. Both the initial deposit, and those that follow, show a pronounced coffee‐ring effect caused by the different rates at which the solvent evaporates at the edge of a drop.8 Further evidence of this can be seen in Figure 1 c, which contains typical cross‐sectional profiles for each thickness. For the lowest loading, there is virtually no material present in the middle of the spot. As loading increases, the majority of the deposited catalyst accumulates at the perimeter of the inner region, resulting in a deposit which more closely resembles a donut than a perfectly flat disc.
Figure 1.

a) Printed array of catalyst spots consisting of four rows containing 2, 4, 6 and 8 layers. Scale bar 2 mm. b) Profilometry image of an 8‐layer spot. c) Profilometry cross‐sections of 2‐(black), 4‐(red), 6‐(green) and 8‐(blue)layer spots.
The scanning flow cell was brought into contact with the desired catalyst spot, and cyclic voltammetry was carried out in argon‐saturated 0.1 m perchloric acid. In Figure 2 a, typical voltammetric responses are shown for the different catalyst loadings, clearly indicating an increase in electrochemical surface area (ESA) as more layers are deposited. Assuming a value of 210 μC cm−2 of platinum,9 the ESA was calculated for each spot by integration of the observed hydrogen desorption peaks with correction for double‐layer charging to give the charge of underpotential‐deposited hydrogen (HUPD). The inset shows that this area increased linearly with the number of printed catalyst layers, indicating that 1) all of the porous material was accessible to the electrolyte on the timescale of the experiment, and 2) each deposited layer contained the same quantity of catalyst. The points on this plot are the average of three different spots measured for each thickness. Despite the inhomogeneity of the deposits, standard deviations were too small (1–7 %) to be shown in the plot, but it is reasonable to assume an uncertainty of at least 10 % when using HUPD to estimate surface area.10 Note the range of surface areas shown in Figure 2 a corresponds to Pt loadings of roughly 10–70 μgPt cm−2 geo.
Figure 2.
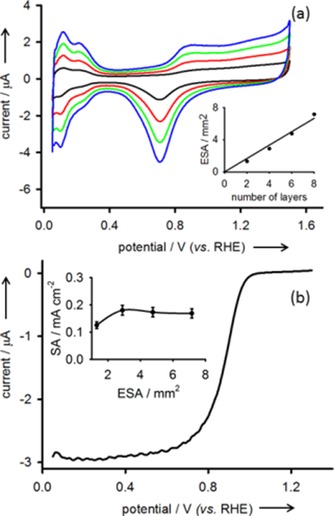
a) Voltammograms recorded using spots of increasing loading. Colour scheme as in Figure 1 c. The inset shows the variation of the calculated electrochemical surface area (ESA) with the number of deposited catalyst layers. b) Oxygen reduction voltammogram recorded using a 4‐layer catalyst spot at 10 mV s−1 in 0.1 m HClO4. The curve represents the background‐corrected anodic sweep. The inset shows the variation of specific activity (SA) with electrochemical surface area.
Voltammetry was also performed in the presence of oxygen, in order to determine catalyst activity for the oxygen reduction reaction. Shown in Figure 2 b is a typical background‐corrected voltammogram. The onset of a large irreversible cathodic current was observed at approximately 1 VRHE. Note the fluctuations in the diffusion‐limited region are caused by the peristaltic pump which draws the electrolyte through the cell. The kinetic current is calculated using this voltammogram and the Koutecky–Levich equation,11 which additionally corrects for limited diffusion at high current densities. The specific activity (SA) of the catalyst at 0.9 VRHE, normalised to electrochemical surface area for each loading, is shown in the inset. Standard deviations were again found to be reasonably small (3–9 %), but in the plot each value is given an error bar of ±10 % in light of the error in surface area calculation already mentioned. The values for specific activity are independent of loading, as expected when there is full utilisation (wetting) of the catalyst. Schmidt et al.2a also found this when studying hydrogen oxidation at thin catalyst films cast on a rotating disc electrode. Only the activity found for the lowest loading is slightly lower than the others, probably due to the deleterious effect of electrolyte impurities at low loadings12 and, as already discussed, the fact that these catalyst deposits are non‐ideal thin rings with virtually no material in the middle.
In order to study catalyst stability, the potential profile illustrated in Figure 3 a was applied. This included 40 cycles at 200 mV s−1 to clean the surface, followed by a slow (10 mV s−1) scan. Also shown in Figure 3 a is a typical example of a platinum dissolution profile simultaneously measured downstream using ICP‐MS analytics. Significant dissolution can be observed during cleaning, and when the scan rate is decreased, anodic and cathodic dissolution can be deconvoluted, and separate peaks are observed for the two processes. Note cathodic dissolution is by far the more dominant of the two, as we have reported previously.4, 6a,6b Note also the dissolution profile is a plot of concentration against time. Units of concentration arise from the ICP–MS calibration procedure performed each day, which consists of measuring counts for standard platinum solutions. Figure 3 b shows typical data obtained during the slow cycle for the four loadings studied. It can be seen that, as loading increases, there is some increase in the amount of dissolved platinum detected downstream. The latter may be calculated by integration of the dissolution peaks. This was done for each loading, and the mass of dissolved Pt was normalised to the calculated ESA, yielding values for specific dissolution (SD). The inset shows how this quantity varies with electrochemical surface area. Crucially, at low catalyst loadings, there is a clear increase in area‐specific dissolution, in agreement with the findings of Nagai et al.,13 who used accelerated stress tests on different catalyst loadings deposited on a rotating disc electrode. This phenomenon is attributed to the increased likelihood that platinum ions remain trapped in the porous catalyst deposit when loading is higher, rather than diffusing out into bulk solution. As a consequence, the competitive re‐deposition of Pt becomes enhanced compared to dissolution, particularly at low potentials. Moreover, assuming a local equilibrium, the Nernst equation predicts that a higher concentration of Pt2+ in the pores causes a shift in the equilibrium potential for both cathodic and anodic dissolution. The result is that, at any given potential, the rate of degradation is lower when more catalyst is present. Conversely, specific dissolution increases when less catalyst is present, having an upper limit similar to that of polycrystalline Pt, which we have measured as 0.36 pg mm−2. Note this phenomenon is not confined to transient experiments at low scan rates. The same trend was found for quasi‐steady‐state dissolution at 1 VRHE, and also for the platinum that dissolves during cleaning cycles (Figure S1 and S2).
Figure 3.

a) Profile of the applied potential during platinum dissolution measurements, along with a resulting dissolution profile. b) Dissolution profiles recorded at 10 mV s−1 using spots of increasing catalyst loading. Colour scheme as in Figure 1 c. The inset shows the variation of specific dissolution (SD) with electrochemical surface area.
These findings are indispensable in terms of further development directions in this field, in that they show loading must be taken into account when evaluating and comparing different catalyst materials. Specifically, they demonstrate the stabilising effect of mass‐transport limitations within porous support structures of a certain thickness. The result is that low catalyst loadings are less stable, even when dissolution rates are normalised to accessible surface area. This presents a new challenge in the quest to meet economic targets. It may be foolhardy to focus exclusively on minimising the amount of noble metal used in fuel cell electrodes, as it is now clear that, at low loadings, the catalyst actually degrades at a higher rate than it would if used less sparingly.
In conclusion, a drop‐on‐demand printer has been used to create reproducible arrays of commercially available platinum catalyst. These matrices are suitable for the high‐throughput screening of extremely low rates of Pt dissolution employing a combination of ICP‐MS and an electrochemical scanning flow cell. Using oxygen reduction as a typical sample reaction, it has been shown, for the first time, that, while activity is largely independent of the amount of material used, decreased loading gives rise to a significant loss of stability. There are two important consequences of this: 1) loading is an essential consideration in the evaluation of catalyst stability, and 2) the development of improved catalyst materials and layers for achieving low and ultra‐low noble‐metal loading in fuel cells and energy conversion devices has to be reconsidered.
Experimental Section
All electrochemical and spectrometric measurements were performed at room temperature using a scanning flow cell (flow rate 193 μL min−1) coupled with ICP‐MS (NexION 300X, PerkinElmer), as described previously.4, 6a,6b The internal standard employed was 7.5 mg L−1 rhenium (187Re), which was added to the electrolyte after it had passed through the cell. A Gamry 600 potentiostat was used to perform electrochemical experiments. A graphite rod and Ag/AgCl (Metrohm, Germany) served as counter and reference electrodes, respectively. The electrolyte in all measurements was 0.1 m perchloric acid, freshly prepared each day by diluting Merck Suprapur 70 % HClO4 with ultra‐pure water (PureLab Plus system, Elga, 18 MΩ, total organic carbon <3 ppb). Prior to measurements, the electrolyte was saturated with either oxygen or argon. In the latter case, the cell was externally blanketed using an argon stream in order to prevent the diffusion of air beneath the silicone sealing and into the electrolyte. Profilometry was performed using a confocal microscope (µsurf, NanoFocus Messtechnik GmbH, Germany). The working electrodes used in this work consisted of a catalyst comprising platinum nanoparticles supported on carbon black (4.8 nm Pt 50.8 %, Tanaka Kikinzoku Intl., Japan). Circular deposits of this catalyst were printed onto glassy carbon plates using a drop‐on‐demand printer (Nano‐PlotterTM 2.0, GeSim). For this purpose, a catalyst ink was prepared (1 mg cm−3 in a mixture of water, ethanol and Nafion), and this was printed to the desired loading. Each layer consisted of 100 drops of volume 150–200 pL, dropped onto the plate in rapid succession using a piezoelectric pipette. Each layer was allowed to dry before adding another.
Supporting information
As a service to our authors and readers, this journal provides supporting information supplied by the authors. Such materials are peer reviewed and may be re‐organized for online delivery, but are not copy‐edited or typeset. Technical support issues arising from supporting information (other than missing files) should be addressed to the authors.
Supplementary
Acknowledgements
The authors thank Jan‐Tobias Walter for performing profilometry measurements, along with Miss Andrea Mingers for providing technical assistance.
G. P. Keeley, S. Cherevko, K. J. J. Mayrhofer, ChemElectroChem 2016, 3, 51.
Contributor Information
Dr. Gareth P. Keeley, Email: keeley@mpie.de
Dr. Karl J. J. Mayrhofer, Email: mayrhofer@mpie.de, FAX: +49 211 6792 218
References
- 1. Kocha S. S., in Polymer Electrolyte Fuel Cell Degradation (Eds.: M. M. Mensch, E. C. Kumbur, T. N. Veziroglu), Academic Press, Boston: 2012, 89–214. [Google Scholar]
- 2.
- 2a. Schmidt T. J., Gasteiger H. A., Stäb G. D., Urban P. M., Kolb D. M., Behm R. J., J. Electrochem. Soc. 1998, 145, 2354–2358; [Google Scholar]
- 2b. Srivastava R., Mani P., Hahn N., Strasser P., Angew. Chem. Int. Ed. 2007, 46, 8988–8991; [DOI] [PubMed] [Google Scholar]; Angew. Chem. 2007, 119, 9146–9149; [Google Scholar]
- 2c. Strasser P., Koh S., Anniyev T., Greeley J., More K., Yu C., Liu Z., Kaya S., Nordlund D., Ogasawara H., Toney M. F., Nilsson A., Nat. Chem. 2010, 2, 454–460; [DOI] [PubMed] [Google Scholar]
- 2d. Katsounaros I., Cherevko S., Zeradjanin A. R., Mayrhofer K. J. J., Angew. Chem. Int. Ed. 2014, 53, 102–121; [DOI] [PubMed] [Google Scholar]; Angew. Chem. 2014, 126, 104–124; [Google Scholar]
- 2e. Maillard F., Bonnefont A., Micoud F., Electrochem. Commun. 2011, 13, 1109–1111. [Google Scholar]
- 3.
- 3a. Johnson D. C., Napp D. T., Bruckenstein S., Electrochim. Acta 1970, 15, 1493–1509; [Google Scholar]
- 3b. Yadav A. P., Nishikata A., Tsuru T., J. Electrochem. Soc. 2009, 156, 253–258; [Google Scholar]
- 3c. Xing L., Hossain M. A., Tian M., Beauchemin D., Adjemian K. T., Jerkiewicz G., Electrocatalysis 2014, 5, 96–112. [Google Scholar]
- 4. Cherevko S., Keeley G. P., Geiger S., Zeradjanin A. R., Hodnik N., Kulyk N., Mayrhofer K. J. J., ChemElectroChem 2015, 2, 1471–1478. [DOI] [PMC free article] [PubMed] [Google Scholar]
- 5. Hydrogen, Fuel Cells and Infrastructure Technologies Program: Multiyear Research, Development and Demonstration Plan, US DoE, 2011, http://www.eere.energy.gov/hydrogenandfuelcells/mypp/.
- 6.
- 6a. Topalov A. A., Katsounaros I., Auinger M., Cherevko S., Meier J. C., Klemm S. O., Mayrhofer K. J. J., Angew. Chem. Int. Ed. 2012, 51, 12613–12615; [DOI] [PMC free article] [PubMed] [Google Scholar]; Angew. Chem. 2012, 124, 12782–12785; [DOI] [PubMed] [Google Scholar]
- 6b. Cherevko S., Zeradjanin A. R., Keeley G. P., Mayrhofer K. J. J., J. Electrochem. Soc. 2014, 12, 822–830. [Google Scholar]
- 7.
- 7a. Hodnik N., Zorko M., Jozinović B., Bele M., Dražič G., Hočevar S., GaberŠček M., Electrochem. Commun. 2013, 30, 75–78; [Google Scholar]
- 7b. Jovanovič P., PavliŠič A., Šala V. S., Hodnik N., Bele M., Hočevar S., GaberŠček M., ChemCatChem ChemCatChem. 2014, 6, 449–453. [Google Scholar]
- 8. Deegan R. D., Bakajin O., Dupont T. F., Huber G., Nagel S. R., Witten T. A., Nature 1997, 389, 827–829. [Google Scholar]
- 9. Bett J., Kinoshita K., Routsis K., Stonehart P., J. Catal. 1973, 29, 160–168. [Google Scholar]
- 10. Mayrhofer K. J. J., Strmcnik D., Blizanac B. B., Stamenkovic V., Arenz M., Markovic N. M., Electrochim. Acta 2008, 53, 3181–3188. [Google Scholar]
- 11. Mount A. R., in Encyclopedia of Electrochemistry (Eds.: A. J. Bard, M. Stratmann), Wiley, Weinheim, Germany: 2007, 137–138. [Google Scholar]
- 12. Katsounaros I., Meier J. C., Mayrhofer K. J. J., Electrochim. Acta 2013, 110, 790–795. [Google Scholar]
- 13. Nagai T., Murata H., Morimoto Y., J. Electrochem. Soc. 2014, 161, 789–794. [Google Scholar]
Associated Data
This section collects any data citations, data availability statements, or supplementary materials included in this article.
Supplementary Materials
As a service to our authors and readers, this journal provides supporting information supplied by the authors. Such materials are peer reviewed and may be re‐organized for online delivery, but are not copy‐edited or typeset. Technical support issues arising from supporting information (other than missing files) should be addressed to the authors.
Supplementary