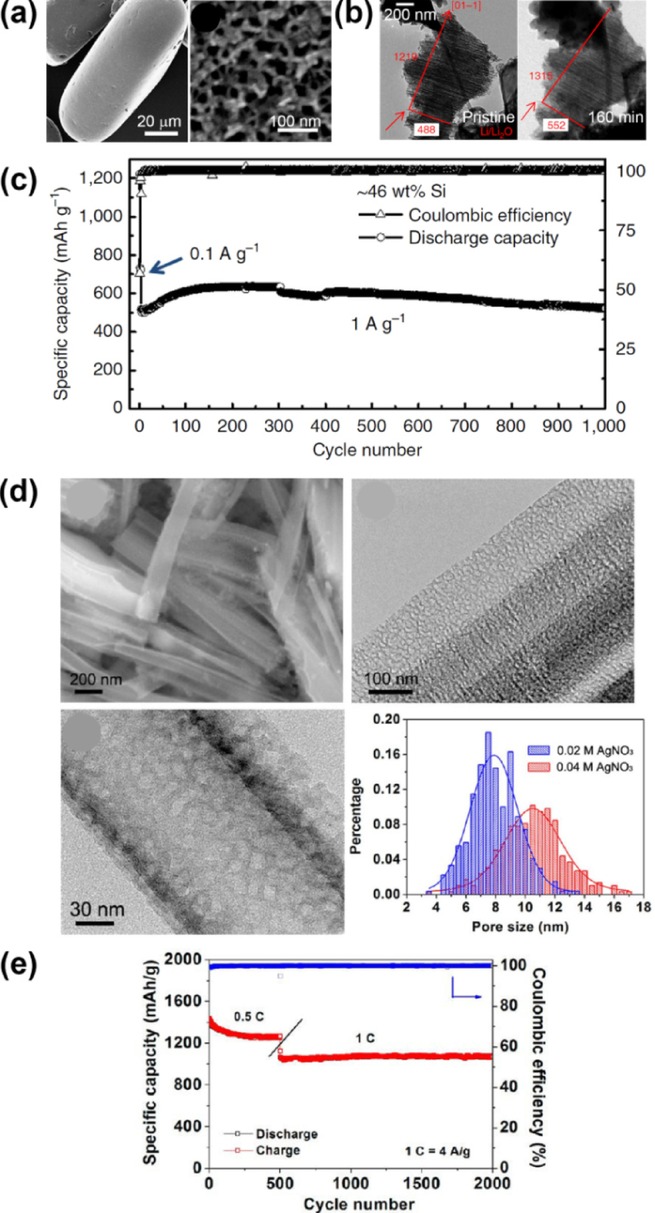
Figure 2.

Mesoporous silicon sponge (MSS) (a–c)[26] and porous boron-doped silicon nanowires (d,e).[27] a) SEM images of MSS in low magnification and high magnification. b) In situ TEM images of MSS before lithiation (left) and after 160 min of lithiation (right). c) Cycle performance of MSS for 1000 cycles. d) Morphological investigation of porous boron-doped silicon nanowires with SEM (upper left), TEM analysis and pore-size distribution. e) Cycle performance of the porous boron-doped silicon nanowire. Reprinted with permission from Refs. [26,27]]. Copyright 2014, Macmillan Publishers Ltd; Copyright 2012, American Chemical Society.
