

Abstract
One of the most important practical issues in low‐temperature fuel‐cell catalyst degradation is platinum dissolution. According to the literature, it initiates at 0.6–0.9 VRHE, whereas previous time‐ and potential‐resolved inductively coupled plasma mass spectrometry (ICP–MS) experiments, however, revealed dissolution onset at only 1.05 VRHE. In this manuscript, the apparent discrepancy is addressed by investigating bulk and nanoparticulated catalysts. It is shown that, given enough time for accumulation, traces of platinum can be detected at potentials as low as 0.85 VRHE. At these low potentials, anodic dissolution is the dominant process, whereas, at more positive potentials, more platinum dissolves during the oxide reduction after accumulation. Interestingly, the potential and time dissolution dependence is similar for both types of electrode. Dissolution processes are discussed with relevance to fuel‐cell operation and plausible dissolution mechanisms are considered.
Keywords: electrochemistry, energy conversion, fuel cells, mass spectrometry, platinum
1. Introduction
The durability of proton exchange membrane fuel cell (PEMFC) components is one of the main challenges to be overcome to clear the pathway for the successful deployment of fuel cells.1 Requirements for the operational lifetime are currently considered to be 5000 h or 10 years of operation2 for cars, and even more for buses or stationary applications.3 This target must be achieved, not only for the typical catalyst loadings used so far, but also when employing electrodes with extremely low amounts of platinum or with alternative catalysts for a reduction in the overall production cost. Traditionally, carbon‐supported platinum nanoparticles, and alloys thereof, are considered to best catalyze the sluggish oxygen reduction reaction (ORR) on the PEMFC cathode.4 In a highly corrosive acidic environment and at positive potentials during operation, however, platinum dissolves, which is well documented in the fuel‐cell literature.5 Nevertheless, the exact onset potential of dissolution, the amount under various operation conditions, as well as the mechanism of the dissolution process are still under debate.
Recently, the utilization of inductively coupled plasma mass spectrometry (ICP–MS) in the on‐line analysis of platinum dissolution has shed new light on the issue.6 Based on the time‐ and potential‐resolved experimental data, some of the previously reported results and conclusions, such as the predominating dissolution during potential perturbations, were unambiguously confirmed, whereas others were rejected. Examples of the former include work reported by Johnson et al.,7 in which the major extent of platinum dissolution during reductive potential treatment, observed in a rotating ring‐disk‐electrode (RRDE) setup, was quantified. It should be noted that the existence of platinum dissolution from platinum‐oxide reduction was known even earlier, as reported, for instance, in Russian literature8 or in a communication by Frumkin to Mituya and Obayashi,9 where the latter claimed platinum disintegration to be rather exclusively an anodic process.10 Similarly, the simple applicability of anodic and cathodic charge imbalance for the quantification of dissolved noble metals, which was suggested at the same time, can now be considered as erroneous.11 One particular finding in the on‐line ICP–MS studies was that the onset potential of platinum anodic dissolution in a transient experiment (depending on the electrolyte, values of 1.0–1.1 VRHE were found, as can be seen in Table 1 in Ref. 12) coincides well with the initiation of platinum bulk oxidation, usually ascribed to an interfacial place‐exchange process at approximately 1.1–1.2 VRHE.13 The appearance of platinum in the electrolyte during cathodic treatment was correlated with oxide reduction and, thus, with the reverse of the oxidation process. Based on these findings, several dissolution mechanisms were suggested and discussed.6b, 12 These results emphasized the importance of detrimental start/stop events during fuel‐cell operation, where potentials of more than 1.0 VRHE can arise.14 In contrast, during potentiodynamic treatments of a polycrystalline platinum electrode in acidic electrolytes at potentials lower than 1.05–1.10 VRHE, the dissolution rate was always negligibly small (below the detection limit of the ICP–MS of approximately 3 pg cm−2 s−1).6a Moreover, the dissolution rate in potentiostatic experiments was, independent of the potential, always minor after a short time of polarization, confirming the predominating transient nature of platinum dissolution.6a
Table 1.
Summary on the effect of potential treatments on platinum dissolution in perchloric acid solutions (RT=room temperature).
| Pt form | Potential mode | Potential [V vs. RHE] | Electrolyte [mol L−3 HClO4] | T [°C] | Dissolution rate [×10−14 g cm−2 s−1] | Dissolution amount [10−9 g cm−2 cycle−1] | Monolayer dissolution | Refs. |
|---|---|---|---|---|---|---|---|---|
| Pt sheet | steady | 0.95 | 0.1 | ≈23 | 3.6 | 3050 h | this work | |
| Pt wire | steady | 0.914 | 0.57 | 23 | 1.7 | 6500 h | 34, 37b | |
| Pt film | steady | 0.95 | 1 | 60 | 1.5 | 7350 h | 35 | |
| 1.9 nm Pt/C | steady | 0.95 | 0.57 | RT | 5.9 | 1850 h | 38 | |
| 2.6 nm Pt/C | steady | 0.914 | 0.57 | 23 | 1.4 | 7850 h | 34, 37b | |
| 3.2 nm Pt/C | steady | 0.95 | 0.57 | RT | 1.3 | 8450 h | 38 | |
| 3.5 nm Pt/C | steady | 0.95 | 0.57 | RT | 1.3 | 8450 h | 37a | |
| 4.8 nm Pt/C | steady | 0.95 | 0.1 | ≈23 | 2.2 | 5000 h | this work | |
| 6.7 nm Pt/C | steady | 0.95 | 0.57 | RT | 0.9 | 12 200 h | 37a | |
| 7.1 nm Pt/C | steady | 0.95 | 0.57 | RT | 0.8 | 13 750 h | 38 | |
| Pt sheet | cycle | 0.05–1.15 | 0.1 | ≈23 | 0.3 | ≈1350 cycles | 12 | |
| Pt sheet | cycle | 0.05–1.30 | 0.1 | ≈23 | 1.8 | ≈200 cycles | 12 | |
| Pt disk | cycle | 0.4–1.40 | 0.1 | RT | 3.3 | ≈110 cycles | 7, 22a | |
| Pt sheet | cycle | 0.05–1.50 | 0.1 | ≈23 | 3.8 | ≈95 cycles | 12 | |
| 2.2 nm Pt/C | cycle[a] | 0.60–1.0 | 0.57 | RT | 0.0014 | ≈2.9×10⁵ cycles | 37a | |
| 5.0 nm Pt/C | cycle[a] | 0.60–1.0 | 0.57 | RT | 0.00033 | ≈1.23×10⁶ cycles | 37a | |
| 4.8 nm Pt/C | ramp[b] | 0.95→0.05 | 0.1 | ≈23 | 0.04 | 10 000 ramps | this work |
[a] Averaged over 50 cycles. [b] Prior to the ramp electrode was polarized for 120 min at E=0.95 VRHE.
These results of the time‐resolved measurements are, however, in clear contrast to a huge body of literature on platinum dissolution at lower potentials (below 1.0 VRHE), which is the important potential range of steady fuel‐cell operation. Incontrovertible evidence of platinum dissolution in this potential range is the formation of the so‐called “platinum band” in polymer electrolyte (typically Nafion). Platinum ions, dissolved from the cathode, diffuse through the membrane until they are reduced by hydrogen that diffuses through the membrane from the anode side. Experimental results on the formation of the platinum band at open‐circuit voltage (OCV) indicate that platinum dissolution occurs at 0.95–1.00 V.15 Similar results were found by cycling up to 1.0 and 1.2 VRHE, with higher dissolution at the more positive potential, or applying a cathodic square‐wave potential that alternated between 0.87 and 1.2 VRHE.16 However, no precipitated platinum particles were found in the membrane when the upper potential limit (UPL) was 0.8 VRHE.16a The discrepancy regarding the dissolution onset potential between fuel‐cell studies and the findings from on‐line ICP–MS studies could be attributed to the difference in the platinum dimensions, namely, extended bulk platinum versus nanoparticles. According to Tang et al.,17 nanoparticles dissolve through an electrochemical process, whereas extended bulk surfaces degrade through the formation of a slightly soluble oxide. The transition between mechanisms is supposed to occur for nanoparticles of approximately 4 nm in diameter.17, 18 Similar results on the enhanced dissolution for particles less than 3 nm were also reported by other authors.19 Instead of a change in the mechanism, a difference in the thermodynamics could also be considered when going to small nanoparticles. The thermodynamic standard free energy of formation of Pt2+ from polycrystalline, bulk Pt is considered to be 54.8 kcal mol−1.20 It should be noted that other suggested values of, for example, 44.4 and 61.6 kcal mol−1 give rise to different standard potentials of E 0(Pt/Pt2+)=0.963 and 1.335 V at standard conditions, respectively.17, 21 The lower value has been cited in fuel‐cell‐oriented literature,22 although, as discussed by Sassani and Shock, it is most likely erroneous.21a Numbers presented by Sassani and Shock, on the other hand, are also questionable.23 Regardless of its absolute value, the potential decreases with particle size, due to the Gibbs–Thomson effect. For instance, the decrease is −0.028 V for 5 nm platinum nanoparticles.1b According to the Nernst equation, the shift in E 0(Pt/Pt2+) with particle size, particularly below 4 nm, leads to an increase in the equilibrium concentration of dissolved platinum at a given potential, which could explain the enhanced dissolution.24 Nevertheless, evidence for platinum dissolution at lower potentials was also found by other means in more fundamental studies, as, for instance, shown in the early reports of Chemodanov et al.25 and other more recent works.26, 27, 28, 29, 30, 31, 32 In these works, the onset of dissolution (sometimes specified as anodic dissolution) varies between approximately 0.6 and 1.0 VRHE, which is significantly lower than that observed in the on‐line ICP–MS studies when using similar bulk electrodes.6a, 6b, 6f, 12, 33 In some of these works (e.g. Ref. 28), the difference in the dissolution in oxygen‐free and oxygen‐saturated solutions was shown, which, however, was not found for transient dissolution.33b Considering all of this, it seems that the observed dissolution below 1.0 VRHE is not merely an effect of the particle size, but that it is rather a general fact for Pt‐based materials.
Owing to the importance of Pt dissolution for many applications, even beyond fuel cells, and to the ambiguous literature on the topic, we have continued our efforts towards resolving dissolution at potentials below 1.2 VRHE with ICP–MS coupled directly to an electrochemical cell. As the reported literature values for platinum dissolution at 0.9 V are two orders of magnitude lower than the ICP–MS detection limit in time‐resolved measurements, a special approach is utilized that enables accumulation of dissolved platinum species in the scanning flow cell (SFC) before the detection of dissolved species. As a consequence, the steady‐state and the transient dissolution behavior of bulk polycrystalline platinum and of a high‐surface‐area carbon‐supported 4.8 nm platinum catalyst at low potentials can be evaluated and compared quantitatively.
2. Results
To verify the proposed experimental approach, a platinum‐foil electrode was polarized at E=0.95 VRHE in “flowing” and “stagnant” modes. The resulting ICP–MS platinum dissolution profiles are presented in Figure 1. For the sake of clarity, the segment of the mass spectrum corresponding to platinum dissolution during the activation treatment (as for instance in Figure 5 b in Ref. 12) is omitted. Prior to the polarization step, the electrode was held at a potential of 0.4 VRHE, at which dissolution of metallic platinum in oxygen‐free electrolyte is assumed to be negligibly small. The change of the potential to E=0.95 VRHE is marked by the first pair of arrows at approximately 800 s. One can clearly see that, for the cell operation in stagnant mode, there is no significant change in the signal intensity, as no detectable amount of platinum exists in the 0.1 mol dm−3 HClO4 pumped to the ICP–MS inlet from the additional electrolyte reservoir. On the other hand, a minor initial enhancement in the signal can be observed in the flowing mode (especially when smoothed by using the Savitzky–Golay method in OriginPro). The signal intensity decreases with time, though, it is impossible to define the time at which dissolution stops or becomes negligible. As shown in the graph, the signal is always below the detection limit (here estimated as ca. 3 ng L−1 or 1 pg cm−2 s−1). The reason is simply the dilution of the dissolved Pt at the used flow rate of 200 μL min−1 in a total volume of 6 mL over 30 min. Hence, one can, at best, use this approach to obtain qualitative information on platinum dissolution. Integration of the dissolution signal for information on the amount of dissolved platinum in a given time interval does not seem to be feasible.
Figure 1.

ICP–MS recorded in stagnant (upper) and flowing (lower) operational modes. Grey and black lines present original and smoothed signals, respectively. Polarization at 0.95 VRHE was performed over 30 min (+3 min required to wash out dissolved species from the cell) after an initial polarization at 0.4 VRHE. The time at which the electrode potential was changed is marked by the arrows at approximately 800 s. The dashed line represents the detection limit estimated as a threefold signal‐to‐noise ratio.
In stagnant mode, however, dissolved species are preconcentrated in a relatively small electrolyte volume [a rough estimation based on the change of diffusion layer thickness (δ) with time (t) as δ≈(Dt)0.5, where D is the diffusion coefficient for the dissolved species, taken as 10−5 cm2 s−1, gives ca. 4 mm3 for 120 min of polarization]. When the SFC blocking valve is opened, indicated by the arrow at approximately 2700 s in Figure 1, the accumulated dissolved Pt is washed out of the SFC for ICP–MS. This results in a clearly discernable Pt peak with a narrow width, confirming the relatively small dispersion of the dissolved species within the cell. Unlike the dissolution signal during the flowing mode, integration of this peak can be performed with confidence, as the signal is now well above the detection limit. It should be noted that, although the dissolved species are removed from the SFC, the potential was kept at the same value so the dissolution process was not altered. The stagnant mode is, thus, a valuable approach for the detection of low amounts of dissolved species, and will be used in the following to determine Pt dissolution in the operational range of fuel cells.
Previously, we have shown that the predominant process in transient dissolution experiments is cathodic dissolution, which occurs during the reduction of the oxide formed at potentials more positive than 1.1 VRHE.6a, 6b, 6f, 12, 33 To investigate both the expected low amounts of anodic and cathodic dissolution at lower potentials, the experimental procedure shown in Figure 1 was modified slightly. Namely, at the end of the experiment, a reductive ramp was additionally applied to investigate whether some oxide was formed during the polarization and if this causes dissolution of platinum during reduction. Both dissolution processes are shown in Figure 2 a for various potentials, accompanied with a magnification of the dissolution profiles obtained below 0.95 VRHE in Figure 2 b. Only the mass‐spectrum segments corresponding to the washing out of accumulated Pt and oxide reduction are shown for clarity. Most interestingly, polarization of the electrode at potentials as low as 0.85 VRHE results in significant platinum dissolution over 30 min of accumulation. The dissolved amount over this timeframe increases from below 0.1 ng cm−2 at 0.85 VRHE to 1.25 ng cm−2 at 1.2 VRHE, where it seems to reach a plateau (Figure 2 c). This is not in line with a pure electrochemical dissolution process, where the increase is expected to be exponential with overpotential. The deviation from this behavior is most likely caused by the competition of the dissolution process with a potential‐dependent surface oxidation, which can lead to passivation, thus lowering dissolution at more positive potentials. The cathodic dissolution during the potential ramp following the accumulation experiment was negligible for electrodes polarized at relatively low anodic potentials (see Figure 2 d). Only after polarization at potentials more positive than 0.95–1.00 VRHE, for 30 min, could a discernable amount of dissolved Pt be found during the reductive ramp. In contrast to the anodic dissolution during the accumulation measurements at constant potentials, however, Pt dissolution during the reduction ramp steadily increases with potential. This is in line with previous time‐resolved transient experiments to more positive potentials. The results of identical experiments on a 4.8 nm Pt/C catalyst are presented in grey in Figures 2 c and d for comparison. The trends of the potential‐dependent increase in anodic and cathodic dissolution are similar in both cases. Interestingly, however, the electrochemical surface area normalized values of platinum dissolution from nanoparticles are slightly lower than that from a polycrystalline electrode.
Figure 2.

a) ICP–MS recorded in the stagnant operational mode of the SFC at different potentials applied to a platinum foil for 30 min. Notations presented on the top in grey and black indicate the time at which the valve for the electrolyte flow from the SFC cell was opened to wash out dissolved platinum, and when the ramp to negative potentials was started, respectively. b) A magnified view of the lower three profiles from (a). Grey and black lines represent original and smoothed signals, respectively. Integrated amounts of dissolved platinum from a platinum foil (black) and comparable experiments with a 4.8 nm Pt/C (grey) electrode originating from anodic polarization and from the subsequent cathodic ramps are shown in (c) and (d), respectively. Error bars for some experiments were estimated from 3–4 identical experiments.
Note that this cannot be simply attributed to the experimental error of the measurements, as the error bars obtained from repetitive experiments are much lower than the difference in dissolution rate for both electrodes. Although similar results on the enhanced dissolution of bulk electrode were reported by Wang et al.34 and by Dam and de Bruijin,35 more efforts are still necessary to determine whether the minor differences in rates are significant or simply an artefact of the measurement approach for thin catalyst films in flow‐type cells.36 Nevertheless, comparing the general trend of Pt dissolution over 30 min of polarization and during fast reductive ramps, it can be concluded that, for both electrodes, the anodic process dominates up to approximately 1.00 VRHE, whereas, at more positive potentials, cathodic dissolution becomes more influential.
The results presented above indicate an obvious effect of the experiment timescale on anodic platinum dissolution. As an example, in previous simple potential cycles to 1.05 VRHE, platinum dissolution was found to be negligibly small,12 whereas a significant amount of platinum is found in the electrolyte after polarization, even at lower potentials over 30 min. To demonstrate this time dependence for the current system, Figure 3 presents the dependence of anodic and cathodic dissolution on the anodization time for nanoparticles and bulk platinum electrodes. Once again, the dissolution of polycrystalline platinum foil is higher at an applied potential of 0.95 VRHE. Moreover, the anodic dissolution rate decreases with time for platinum bulk electrodes, whereas the rate of platinum nanoparticle dissolution seems to be constant. In line with this observation, the cathodic dissolution during oxide reduction also shows enhanced Pt signals for the foil after each polarization time. One reason for this effect could be that the system is approaching equilibrium between dissolved species and metallic and/or oxidized platinum. Owing to the threefold higher electrochemical surface area of the Pt/C catalyst and, thus, the higher absolute concentration of dissolved platinum, dissolution could be inhibited, which is in line with the theoretical prediction of the dependence of equilibrium Pt2+ concentration on particle size.24 However, the almost linear increase in platinum concentration with time for nanoparticulated electrodes suggests that this interface is far from equilibrium. Moreover, this does not explain the lower dissolution of Pt/C during oxide reduction in the nonequilibrium, transient cathodic ramp. As it is not possible to fully explain the difference in dissolution between the two types of sample with the current understanding, more fundamental work is necessary in the future.
Figure 3.

Amounts of dissolved platinum from a platinum foil (black) and a 4.8 nm Pt/C catalyst (grey) polarized over varied periods during a) anodic polarization and b) subsequent cathodic ramps. The applied potential was 0.95 VRHE.
To obtain an accurate and quantitative estimation of the dissolution rates for the Pt/C sample below 1.0 VRHE, experiments with dissolution close to the detection limit (shown in Figure 2 b) were additionally performed with 120 min of accumulation (Figure 4). As a consequence, the anodic dissolution becomes clearly discernable even at potentials as low as 0.85 VRHE.
Figure 4.
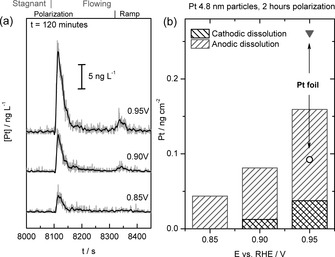
a) ICP–MS recorded on the 4.8 nm Pt/C electrode at different potentials during 120 min of polarization. The markers on top of the figures indicate the opening of the SFC for washing out of accumulated, dissolved Pt from the SFC after polarization (stagnant to flowing), and the start of the cathodic potential ramp. b) Amount of dissolved platinum obtained by integrating corresponding peaks from (a), including data from platinum foil for comparison.
Cathodic dissolution remains rather low, but increases somewhat at higher potentials, as shown in Figure 4 b. The average anodic dissolution rate can now be estimated for both samples by dividing the dissolved amount by the polarization time. The calculated dissolution rates for a platinum foil and the 4.8 nm Pt/C catalyst after 120 min at E=0.95 VRHE are approximately 3.6 and 2.2×10⁻¹⁴ g cm−2 s−1. As summarized in Table 1, these values are slightly higher than, but comparable to, 1.7 and 1.4 g cm−2 s−1 found by Wang et al.34 for a polycrystalline platinum wire and high‐surface‐area carbon‐supported platinum particles obtained after 72 h of polarization at E=0.9 VSHE (E=0.914 VRHE) in 0.57 mol L−1 HClO4. A similar dissolution rate of 1.5×10⁻¹⁴ g cm−2 s−1 was found by Dam and de Bruijin when using electrochemical quartz crystal microbalance (EQCM) gravimetric analysis for platinum thin‐film dissolution at T=60 °C, as estimated through the weight change after a number of hours of polarization at E=0.95 VRHE.35 The apparent discrepancy can be explained by the difference in potential, pH, temperature, polarization time, platinum particle size, and loading, as each of these parameters influence the dissolution of platinum.22a, 24a, 37 All sets of data, however, show much lower dissolution rates than those reported for platinum dissolution during repetitive cycling (see Table 1 in Ref. 34) or dissolution during the cleaning procedure (Figure 5 in Ref. 12), where often much higher anodic potential limits of 1.4 or 1.5 VRHE were used. In case, however, the anodic potential limit is not higher than 1.0 VRHE, the reported dissolution amounts are extremely small (See Table 1 and Ref. 37a). In an additional experiment (data not shown), in which the potential of the platinum foil electrode was cycled between 0.05 and 0.85 VRHE at a scan rate of 200 mV s−1 over 30 min in the stagnant operational mode, we could not detect any traces of dissolved platinum. This result is in accord with previous data obtained from experiments with a fuel‐cell cathode.16a
3. Discussion
The results presented in the current work and the extensive literature body on platinum degradation in both half cells and fuel cells at different experimental conditions show that, depending on the applied potential program, dissolution can be divided into quasi‐steady‐state (owing to the very slow process of platinum oxidation real steady‐state conditions are unlikely to be established in the studied time interval) and transient processes.6a, 6b, 6f, 27b, 33, 34 The relevance of these two processes for platinum catalyst degradation in fuel cells is discussed below.
3.1. Relevance of Quasi‐Steady‐State and Transient Dissolution on Platinum Catalyst Stability in PEMFCs
The results presented here allow us to make some comments on the dissolution of platinum in PEMFCs. In case that potential excursions during start/stop procedures are avoided, the highest anodic potential is the open‐circuit potential (OCP) in contact with air of approximately 1.0 VRHE, at which the quasi‐steady‐state dissolution rate of platinum is rather low. As shown in Figure 4, polarization of the 4.8 nm Pt/C catalyst over 120 min at 0.85 and 0.95 VRHE leads to dissolution of approximately 50 and 160 pg cm−2, respectively. Taking the value of approximately 400 ng cm−2 for the weight of a platinum monolayer and assuming a constant dissolution rate (this is a very rough first approximation, as the dissolution rate mostly likely decreases with time), it would take 16 000 and 5000 h for the dissolution of one full monolayer at 0.85 and 0.95 VRHE, respectively. By dissolving a monolayer, the original diameter of the nanoparticles will decrease by less than half a nanometer from approximately 4.8 to 4.4 nm. Moreover, the total number of platinum atoms decreases by almost a quarter from approximately 3800 to 2900 atoms for 4.8 nm nanoparticles, assuming that nanoparticles are spherical and taking the density of platinum to be 21.45 g cm−3. In other words, on average, every 18 and 5.7 h, one atom of the 900 surface atoms dissolves from a nanoparticle at 0.85 and 0.95 VRHE, respectively. Note that dissolution during the operation of a fuel cell below 0.85 VRHE will be even smaller than these values. A similar estimation to that for the quasi‐steady‐state dissolution, above, can be made for transient dissolution of platinum during potential perturbations, which occur, for instance, during fuel‐cell startup, going from the OCP to an operative voltage or during uncontrolled potential excursions to more positive values than the OCP. As can be seen from Figure 4, the amount of platinum dissolved in a cathodic ramp after 120 min polarization at E=0.95 VRHE is approximately 40 pg cm−2. Thus, 10 000 ideal startups will result in the removal of a platinum monolayer, which is equivalent to an average dissolution of one atom from a nanoparticle after around 11 cycles. In contrast, significantly enhanced dissolution occurs during one potential cycle up to 1.3 VRHE, which is a reasonable value for a potential spike during a non‐ideal fuel‐cell startup or shutdown event,14 and during the subsequent reduction of the formed oxide. Taking approximately 2 ng cm−2 cycle−1 as a representative value (see Figure 5 d in Ref. 12), this results in 200 cycles for dissolution of a full monolayer or, in other words, the dissolution of four atoms from a nanoparticle in one cycle. It is expected that the dissolution process at low potential is accelerated at the higher temperatures at which PEMFCs usually operate. Transient dissolution, however, does not change much with temperature.6f Both processes accelerate with a decrease in pH value.
In summary, Pt dissolution occurring at the positive potentials found at the cathode of a fuel cell can be described by steady‐state (at low potential) and transient (oxide formation/reduction) processes. Their relative quantitative contribution to the overall degradation in applications like PEMFCs will depend, to a large extent, on the operating conditions in the field.
3.2. Possible Dissolution Mechanisms
Based on the results presented above, it can be concluded that, qualitatively, dissolution of platinum from bulk polycrystalline and high‐surface‐area carbon‐supported platinum samples is very similar. In our previous work, the main conclusion was that platinum dissolution at potentials above 1.05 VRHE is a transient process, and that it most likely involves chemical or electrochemical dissolution of short‐lived oxide or hydroxide species, which are formed during metal/stable‐oxide and stable‐oxide/metal transitions.12 Utilizing the accumulation technique in this work, we succeeded in breaking the detection limit of the time‐resolved measurements with coupled ICP–MS and, thus, also in quantifying the extent of dissolution below this critical potential. As it is well known that platinum oxidizes below 1.05 VRHE, as observed during positively going ramps with an onset of the oxidation current at ca. 0.8–0.85 VRHE, the formation of metastable intermediates may also explain the appearance of dissolved platinum in the electrolyte at such low potentials. The equilibrium potential for the underlying Pt/PtO transition (alternatively Pt/PtO2 can be considered) for the decisive step in dissolution can be described by Equation (1):
| (1) |
The forward and backward reaction are enforced in transient experiments when passing the critical potential window of 1.0–1.1 VRHE, leading to a complete change in the surface state and, thereby, to significant dissolution of intermediates.6b, 12 In contrast, under steady‐state conditions, the surface is in equilibrium and, thus, the average coverage with hydroxyl/oxides does not change. Nevertheless, the remaining minor exchange current density between the reduced and oxidized state leads to the formation of metastable intermediates that partially result in the low amount of dissolution detected. In both cases, the dissolution of the metastable state of Pt is always in concurrence with passivation of the surface, that is, formation of a stable oxide, which is favored at more positive potentials, and with reduction or re‐deposition preferentially occurring at more negative potentials. The complex kinetics of all of these processes and their dependence on the operation conditions are determining the rate and relative extent of steady‐state and transient dissolution.
Alternatively, different mechanisms for dissolution during oxide formation and reduction have also been suggested in the literature.31, 39 For instance, the electrochemical dissolution of Pt, as described by Equation (2), has been widely used to explain dissolution at low potentials, particularly in the simulation of platinum particle‐size growth, owing to dissolution/re‐deposition.24b, 30, 38, 40
| (2) |
Considering a Pt2+ concentration of 1 nmol dm−3, as estimated from the amount of dissolved platinum and the diffusion layer thickness, and assuming that the Nernst equation still holds,41 the equilibrium potentials would be approximately 0.92 VSHE. The lowest potential at which dissolution was detected in the current work was 0.85 VRHE or 0.79 VSHE, which is only 0.13 V more negative than the equilibrium potential and, thus, quite feasible. On the contrary, the macroscopically observed dissolution of several nanomoles per liter of Pt2+ would lead to a positive shift in the equilibrium potential and, thus, to an enhancement in re‐deposition, so that overall dissolution should rather cease with time and not remain constant. Moreover, the reaction in Equation (2) is pH independent, as described, which does not explain the practically observed dissolution process at various pH values.6b, 12 Only consideration of an intermediate pH‐dependent step in Equation (2), as in the case of iron dissolution,42 or the pH‐dependent formation of the (hydroxyl‐)oxide in Equation (1), can eventually explain all of the peculiarities of Pt dissolution.
Another possible explanation is the electrochemical reduction of PtO2 presented in Equation (3), which seems to be particularly interesting for the cathodic dissolution and its dependence on the amount of oxide (values for equilibrium potential taken from Pourbaix et al.20, 43).
| (3) |
Interestingly, this reaction could also explain transient anodic dissolution at potentials above 1.05 VRHE (also below, assuming that PtO2 forms at such low potentials), as well as its independence of the UPL of cycles to higher potentials (see, for example, Figure 2 c in Ref. 12). Namely, the concentration of Pt2+ in the electrolyte is negligibly small at the onset of PtO2 formation during anodic treatment, which shifts the dissolution potential of E 0(PtO2/Pt2+) to more positive values. As in Equation (2), however, this reaction can only be used to explain dissolution in acidic media, as the pH dependence of 118 mV decade−1 is not in line with the experimental results of a similar type of dissolution behavior in acidic and alkaline electrolytes.12
In summary, the dissolution of platinum during anodic polarization can be explained by assuming either formation and dissolution of a transient oxide, a direct electrochemical dissolution of a metal, or dissolution of an oxide. However, more efforts will be necessary in future to combine the proposed macroscopic models with microscopic theories (e.g. the mechanism of platinum oxidation suggested by You and Nagy et al. to explain X‐ray scattering results)44 for a more comprehensive consideration of platinum oxidation and dissolution. Additional in situ experiments and theoretical efforts (e.g. using density functional theory) must be undertaken to resolve the problem of platinum dissolution at different potentials from surfaces covered with different amount of (hydroxyl)‐oxide(s).
4. Conclusions
The extension of an SFC ICP–MS‐based setup for the quantification of extremely low rates of platinum dissolution at low anodic polarization has been successfully employed. With the help of the accumulation of dissolved species in a small volume of the cell, the amounts of platinum dissolved at potentials as low as 0.85 VRHE in comparably short times were quantified. Thus, when averaged over 120 min of polarization at E=0.95 VRHE, the dissolution rate was estimated to be approximately 3.6 and 2.2×10⁻¹⁴ g cm−2 s−1 for the two types of electrodes. The obtained results were discussed in terms of platinum dissolution in the operational potential range of fuel cells. It was estimated that 16 000 and 5000 h would be required for dissolution of a platinum monolayer at electrode potentials of 0.85 and 0.95 VRHE, respectively. In comparison, the same amount is already dissolved during only 200 potential cycles up to 1.3 VRHE followed by oxide reduction. The mechanism for the observed steady‐state Pt dissolution at low potentials most likely relies on the formation of metastable, soluble hydroxide/oxide species, similar to the transient dissolution reported earlier, and is the same for both extended Pt surfaces and Pt nanoparticles.
Experimental Section
The working electrodes used in the current work consisted of polycrystalline platinum foil (99.99 %, MaTecK) and a catalyst comprising 4.8 nm (as specified by supplier) platinum nanoparticles supported on carbon black (4.8 nm Pt 50.8 %, Tanaka Kikinzoku Intl., Japan). Prior to each measurement, the platinum foil was polished in 0.3 μm Al2O3 slurry followed by extensive washing in ultrapure water and drying in argon. An array of 5 nm Pt/C circular catalyst spots of approximately 0.5 mm in diameter was printed onto conductive glassy carbon plates with a drop‐on‐demand printer (Nano‐PlotterTM 2.0, GeSim). For this purpose, a catalyst ink was prepared (1 mg cm−3 catalyst in mixture of water, ethanol, and Nafion), which was printed with the desired loading. To achieve greater reproducibility of the data, each new measurement was started on a fresh catalyst location on the array. An electrochemical cleaning/activation (30 cycles up to 1.5 VRHE at 200 mV s−1) was utilized for both types of electrode before the actual measurement. The charge of underpotential‐deposited hydrogen (HUPD) was used to estimate the electrochemically active surface area, and all results in this work are normalized to this area. All electrochemical and spectrometric measurements were performed by using an SFC coupled with ICP–MS (NexION 300X, PerkinElmer), as described elsewhere.33a, 45 A slight modification to the earlier reported setup (see Scheme 1 in Ref. 6f) was made for efficient accumulation of dissolved species. Namely, an additional electrolyte vessel with 0.1 mol dm−3 HClO4 connected to the SFC outlet tube was added. In the normal operational mode of SFC–ICP–MS (flowing mode), the electrolyte flow from this vessel to the ICP–MS was blocked. In contrast, during the accumulation mode, the outlet from the SFC was closed and, thus, the electrolyte in the SFC was stagnant (stagnant mode), whereas the electrolyte flow from the additional reservoir was opened. Thus, the ICP–MS blank signal remained constant during the measurement. A graphite rod and Ag/AgCl (Metrohm, Germany) served as the counter and reference electrodes, respectively. The 0.1 mol L−3 HClO4 electrolyte solutions were always freshly prepared by diluting Merck Suprapur 70 % HClO4 in ultrapure water (PureLab Plus system, Elga, 18 MΩ, TOC<3 ppb). Prior to the measurements, the electrolyte was saturated with argon and during polarization the cell was shielded by argon purging to prevent oxygen from the air diffusing into the electrolyte. The on‐line detection of the concentration of dissolved platinum was performed by using ICP–MS (NexION 300X, PerkinElmer) with 7.5 mg L−1 187Re as an internal standard, which was added after the electrochemical cell to the electrolyte (mixing ratio 1:1).
Acknowledgements
The authors thank Dr. D. Myers (Argonne National Laboratory) for informative discussions and A. Mingers for experimental assistance. We acknowledge the BMBF (Federal Ministry of Education and Research, Germany) (Kz: 033RC1101A) for financial support.
S. Cherevko, G. P. Keeley, S. Geiger, A. R. Zeradjanin, N. Hodnik, N. Kulyk, K. J. J. Mayrhofer, ChemElectroChem 2015, 2, 1471.
Contributor Information
Dr. Serhiy Cherevko, Email: cherevko@mpie.de
Dr. Karl J. J. Mayrhofer, Email: mayrhofer@mpie.de, FAX: (+49) 211‐6792‐218
References
- 1.
- 1a. Franco A. A., Polymer Electrolyte Fuel Cells: Science Applications, and Challenges, Pan Stanford, 2013; [Google Scholar]
- 1b. Kocha S. S., in Polymer Electrolyte Fuel Cell Degradation (Eds.: M. M. Mench, E. C. Kumbur, T. N. Veziroglu), Academic Press, Boston, 2012, pp. 89–214. [Google Scholar]
- 2. Debe M. K., Nature 2012, 486, 43–51. [DOI] [PubMed] [Google Scholar]
- 3. Zhang S., Yuan X.-Z., Hin J. N. C., Wang H., Friedrich K. A., Schulze M., J. Power Sources 2009, 194, 588–600. [Google Scholar]
- 4. Katsounaros I., Cherevko S., Zeradjanin A. R., Mayrhofer K. J. J., Angew. Chem. Int. Ed. 2014, 53, 102–121; [DOI] [PubMed] [Google Scholar]; Angew. Chem. 2014, 126, 104–124. [Google Scholar]
- 5.
- 5a. Guilminot E., Corcella A., Charlot F., Maillard F., Chatenet M., J. Electrochem. Soc. 2007, 154, B96–B105; [Google Scholar]
- 5b. Kim L., Chung C. G., Sung Y. W., Chung J. S., J. Power Sources 2008, 183, 524–532; [Google Scholar]
- 5c. Péron J., Nedellec Y., Jones D. J., Rozière J., J. Power Sources 2008, 185, 1209–1217; [Google Scholar]
- 5d. Bi W., Fuller T., ECS Trans. 2007, 11, 1235–1246; [Google Scholar]
- 5e. Bi W., Fuller T. F., J. Electrochem. Soc. 2008, 155, B215–B221. [Google Scholar]
- 6.
- 6a. Topalov A. A., Katsounaros I., Auinger M., Cherevko S., Meier J. C., Klemm S. O., Mayrhofer K. J. J., Angew. Chem. Int. Ed. 2012, 51, 12613–12615; [DOI] [PMC free article] [PubMed] [Google Scholar]; Angew. Chem. 2012, 124, 12782–12785; [DOI] [PubMed] [Google Scholar]
- 6b. Topalov A. A., Cherevko S., Zeradjanin A., Meier J., Katsounaros I., Mayrhofer K. J. J., Chem. Sci. 2014, 5, 631–638; [Google Scholar]
- 6c. Schmickler W., ChemPhysChem 2013, 14, 881–883; [DOI] [PubMed] [Google Scholar]
- 6d. Jovanovič P., Pavlišič A., Šelih V. S., Šala M., Hodnik N., Bele M., Hočevar S., Gaberšček M., ChemCatChem 2014, 6, 449–453; [Google Scholar]
- 6e. Pavlisic A., Jovanovic P., Selih V. S., Sala M., Hodnik N., Hocevar S., Gaberscek M., Chem. Commun. 2014, 50, 3732–3734; [DOI] [PubMed] [Google Scholar]
- 6f. Cherevko S., Topalov A. A., Zeradjanin A. R., Keeley G. P., Mayrhofer K. J. J., Electrocatalysis 2014, 5, 235–240. [Google Scholar]
- 7. Johnson D. C., Napp D. T., Bruckenstein S., Electrochim. Acta 1970, 15, 1493–1509. [Google Scholar]
- 8.
- 8a. Frumkin A. N., Zh. Fiz. Khim. 1960, 34, 931; [Google Scholar]
- 8b. Chemodanov A. N., Kolotyrkin Ya. M., Dem′rovskii M. A., Kudryavina T. V., Doklady. Akad. Nauk. SSSR 1966, 171, 1384. [Google Scholar]
- 9. Frumkin A. N., J. Res. Inst. Catal. Hokkaido Univ. 1960, 8, 10–11. [Google Scholar]
- 10. Mituya A., Obayashi T., J. Res. Inst. Catal. Hokkaido Univ. 1959, 7, 10–18. [Google Scholar]
- 11. Rand D. A. J., Woods R., J. Electroanal. Chem. 1972, 35, 209–218. [Google Scholar]
- 12. Cherevko S., Zeradjanin A. R., Keeley G. P., Mayrhofer K. J. J., J. Electrochem. Soc. 2014, 161, H822–H830. [Google Scholar]
- 13. Jerkiewicz G., Vatankhah G., Lessard J., Soriaga M. P., Park Y.-S., Electrochim. Acta 2004, 49, 1451–1459. [Google Scholar]
- 14.
- 14a. Rabis A., Rodriguez P., Schmidt T. J., ACS Catal. 2012, 2, 864–890; [Google Scholar]
- 14b. Tang H., Qi Z., Ramani M., Elter J. F., J. Power Sources 2006, 158, 1306–1312; [Google Scholar]
- 14c. Reiser C. A., Bregoli L., Patterson T. W., Yi J. S., Yang J. D., Perry M. L., Jarvi T. D., Electrochem. Solid-State Lett. 2005, 8, A273–A276. [Google Scholar]
- 15. Zhang J., Litteer B. A., Gu W., Liu H., Gasteiger H. A., J. Electrochem. Soc. 2007, 154, B1006–B1011. [Google Scholar]
- 16.
- 16a. Yasuda K., Taniguchi A., Akita T., Ioroi T., Siroma Z., Phys. Chem. Chem. Phys. 2006, 8, 746–752; [DOI] [PubMed] [Google Scholar]
- 16b. Bi W., Gray G. E., Fuller T. F., Electrochem. Solid-State Lett. 2007, 10, B101–B104. [Google Scholar]
- 17. Tang L., Han B., Persson K., Friesen C., He T., Sieradzki K., Ceder G., J. Am. Chem. Soc. 2010, 132, 596–600. [DOI] [PubMed] [Google Scholar]
- 18. Tang L., Li X., Cammarata R. C., Friesen C., Sieradzki K., J. Am. Chem. Soc. 2010, 132, 11722–11726. [DOI] [PubMed] [Google Scholar]
- 19.
- 19a. Garbarino S., Pereira A., Hamel C., Irissou E., Chaker M., Guay D., J. Phys. Chem. C 2010, 114, 2980–2988; [Google Scholar]
- 19b. Holby E. F., Sheng W., Shao-Horn Y., Morgan D., Energy Environ. Sci. 2009, 2, 865–871. [Google Scholar]
- 20.M. Pourbaix, Atlas of electrochemical equilibria in aqueous solutions, National Association of Corrosion Engineers, 1974.
- 21.
- 21a. Sassani D. C., Shock E. L., Geochim. Cosmochim. Acta 1998, 62, 2643–2671; [Google Scholar]
- 21b. Lee J. B., Corrosion 1981, 37, 467–481. [Google Scholar]
- 22.
- 22a. Borup R., Meyers J., Pivovar B., Kim Y. S., Mukundan R., Garland N., Myers D., Wilson M., Garzon F., Wood D., Zelenay P., More K., Stroh K., Zawodzinski T., Boncella J., McGrath J. E., Inaba M., Miyatake K., Hori M., Ota K., Ogumi Z., Miyata S., Nishikata A., Siroma Z., Uchimoto Y., Yasuda K., Kimijima K.-i., Iwashita N., Chem. Rev. 2007, 107, 3904–3951; [DOI] [PubMed] [Google Scholar]
- 22b. Zhang J., PEM Fuel Cell Electrocatalysts and Catalyst Layers: Fundamentals and Applications, Springer-Verlag, London, 2008. [Google Scholar]
- 23. Azaroual M., Romand B., Freyssinet P., Disnar J.-R., Geochim. Cosmochim. Acta 2003, 67, 2511–2513. [Google Scholar]
- 24.
- 24a. Ferreira P. J., la O’ G. J., Shao-Horn Y., Morgan D., Makharia R., Kocha S., Gasteiger H. A., J. Electrochem. Soc. 2005, 152, A2256–A2271; [Google Scholar]
- 24b. Darling R. M., Meyers J. P., J. Electrochem. Soc. 2003, 150, A1523–A1527. [Google Scholar]
- 25.
- 25a. Chemodanov A. N., Kolotyrkin Y. M., Dembrowski M. A., Elektrokhimiya 1970, 6, 460–467; [Google Scholar]
- 25b. Chemodanov A. N., July I. M., Zashita metallov (Protection of metals) 1991, 27, 658–666. [Google Scholar]
- 26.
- 26a. Wang Z., Tada E., Nishikata A., J. Electrochem. Soc. 2014, 161, F380–F385; [Google Scholar]
- 26b. Yadav A. P., Nishikata A., Tsuru T., J. Electrochem. Soc. 2009, 156, C253–C258; [Google Scholar]
- 26c. Sugawara Y., Yadav A. P., Nishikata A., Tsuru T., J. Electroanal. Chem. 2011, 662, 379–383; [Google Scholar]
- 26d. Shrestha B. R., Nishikata A., Tsuru T., J. Electroanal. Chem. 2012, 665, 33–37; [Google Scholar]
- 26e. Sugawara Y., Okayasu T., Yadav A. P., Nishikata A., Tsuru T., J. Electrochem. Soc. 2012, 159, F779–F786; [Google Scholar]
- 26f. Wang Z., Tada E., Nishikata A., ECS Trans. 2013, 58, 1309–1320. [Google Scholar]
- 27.
- 27a. Xing L., Jerkiewicz G., Beauchemin D., Anal. Chim. Acta 2013, 785, 16–21; [DOI] [PubMed] [Google Scholar]
- 27b. Xing L., Hossain M. A., Tian M., Beauchemin D., Adjemian K., Jerkiewicz G., Electrocatalysis 2014, 5, 96–112. [Google Scholar]
- 28. Matsumoto M., Miyazaki T., Imai H., J. Phys. Chem. C 2011, 115, 11163–11169. [Google Scholar]
- 29. Xu Q., Kreidler E., Wipf D. O., He T., J. Electrochem. Soc. 2008, 155, B228. [Google Scholar]
- 30. Ahluwalia R. K., Arisetty S., Peng J.-K., Subbaraman R., Wang X., Kariuki N., Myers D. J., Mukundan R., Borup R., Polevaya O., J. Electrochem. Soc. 2014, 161, F291–F304. [Google Scholar]
- 31. Inzelt G., Berkes B., Kriston Á., Electrochim. Acta 2010, 55, 4742–4749. [Google Scholar]
- 32. Kim S., Meyers J. P., Electrochim. Acta 2011, 56, 8387–8393. [Google Scholar]
- 33.
- 33a. Cherevko S., Zeradjanin A. R., Topalov A. A., Kulyk N., Katsounaros I., Mayrhofer K. J. J., ChemCatChem 2014, 6, 2219–2223; [Google Scholar]
- 33b. Topalov A. A., Zeradjanin A. R., Cherevko S., Mayrhofer K. J. J., Electrochem. Commun. 2014, 40, 49–53. [Google Scholar]
- 34. Wang X., Kumar R., Myers D. J., Electrochem. Solid-State Lett. 2006, 9, A225–A227. [Google Scholar]
- 35. Dam V. A. T., de Bruijn F. A., J. Electrochem. Soc. 2007, 154, B494–B499. [Google Scholar]
- 36. Schuppert A. K., Topalov A. A., Katsounaros I., Klemm S. O., Mayrhofer K. J. J., J. Electrochem. Soc. 2012, 159, F670–F675. [Google Scholar]
- 37.
- 37a. Yu K., Groom D. J., Wang X., Yang Z., Gummalla M., Ball S. C., Myers D. J., Ferreira P. J., Chem. Mater. 2014, 26, 5540–5548; [Google Scholar]
- 37b. Shao-Horn Y., Sheng W. C., Chen S., Ferreira P. J., Holby E. F., Morgan D., Top. Catal. 2007, 46, 285–305. [Google Scholar]
- 38. Ahluwalia R. K., Arisetty S., Wang X., Wang X., Subbaraman R., Ball S. C., DeCrane S., Myers D. J., J. Electrochem. Soc. 2013, 160, F447–F455. [Google Scholar]
- 39.
- 39a. Kawahara S., Mitsushima S., Ota K., Kamiya N., ECS Trans. 2006, 3, 625–631; [Google Scholar]
- 39b. Mitsushima S., Kawahara S., Ota K.-i., Kamiya N., J. Electrochem. Soc. 2007, 154, B153–B158. [Google Scholar]
- 40. Hiraoka F., Kohno Y., Matsuzawa K., Mitsushima S., Electrocatalysis 2015, 6, 102–108. [Google Scholar]
- 41. Bagotsky V. S., Fundamentals of Electrochemistry, Wiley, 2005. [Google Scholar]
- 42. Bockris J. O. M., Drazic D., Despic A. R., Electrochim. Acta 1961, 4, 325–361. [Google Scholar]
- 43. Pourbaix M. J. N., Muylder J. V., Zoubov N. d., Platinum Met. Rev. 1959, 3, 47–53. [Google Scholar]
- 44.
- 44a. You H., Nagy Z., Zurawski D. J., Chiarello R. P. in Proceedings of the Sixth International Symposium on Electrode Processes, Vol. 96, Electrochemical Society, 1996, pp. 136–149; [Google Scholar]
- 44b. Nagy Z., You H., Electrochim. Acta 2002, 47, 3037–3055; [Google Scholar]
- 44c. You H., Zurawski D. J., Nagy Z., Yonco R. M., J. Chem. Phys. 1994, 100, 4699–4702. [Google Scholar]
- 45.
- 45a. Cherevko S., Topalov A. A., Zeradjanin A. R., Katsounaros I., Mayrhofer K. J. J., RSC Adv. 2013, 3, 16516–16527; [Google Scholar]
- 45b. Klemm S. O., Topalov A. A., Laska C. A., Mayrhofer K. J. J., Electrochem. Commun. 2011, 13, 1533–1535. [Google Scholar]