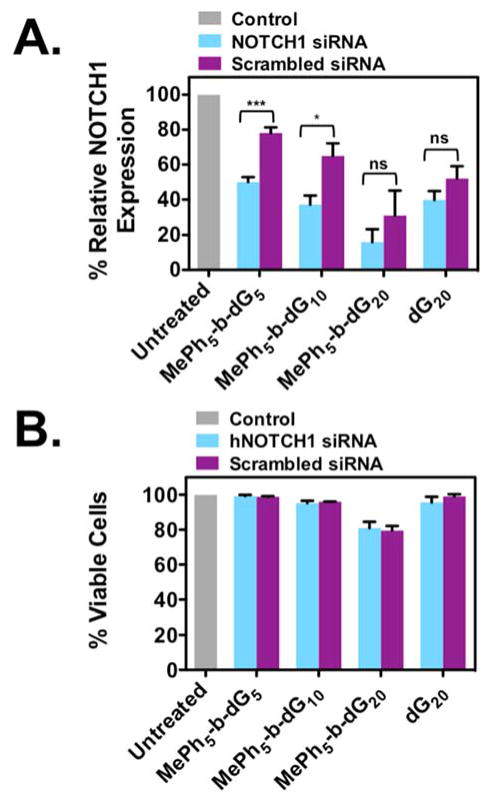
Figure 4.
Relative NOTCH1 expression levels in PBMCs and their corresponding viabilities (cell density = 1x10⁶ cells/mL). Cells were treated with PTDM/NOTCH1 siRNA complexes or PTDM/scrambled siRNA with an N:P ratio = 8:1 in complete media for four hours at 37°C. After treatment, cells were washed and then stimulated with plate-bound anti-CD3 and anti-CD28 for 48 hours. All data was normalized to an untreated control (grey bar). A) Relative NOTCH1 levels in PBMCs after 48-hour treatment with PTDM/NOTCH1 siRNA (light blue bars) or PTDM/scrambled siRNA complexes (purple bars). B) Percent viable cells following staining with 7-AAD. Data represents the mean ± SEM of four independent experiments using cells isolated from different donors. * = p < 0.05, ** = p < 0.01, *** = p < 0.001, ns = not significant, as calculated by the unpaired two-tailed student t-test.

