

Abstract
Purpose
To develop a preoperative CT-based nomogram for predicting overall survival (OS) in patients with non-endometrioid carcinomas of the uterine corpus.
Methods
Waiving informed consent, the institutional review board approved this HIPAA-compliant, retrospective study of 193 women with histopathologically proven uterine papillary serous carcinomas (UPSC), uterine clear cell carcinomas (UCCC), and uterine carcinosarcomas (UCS) who underwent primary surgical resection between May 1998 and December 2011, and had a preoperative CT ≤ 6 weeks before surgery. All CT scans were reviewed for local or/and regional tumor extent, presence of pelvic or/and paraaortic adenopathy, and presence of distant metastases. Univariate survival analysis was performed using log-rank test and Cox regression. Variables shown significant by the univariate analysis were evaluated with the multivariable Cox regression analysis and the results were used to create a nomogram for predicting OS. The predictive accuracy of the nomogram was assessed with the concordance probability index (c-index) and a 3-year calibration plot.
Results
Mean patient age was 67.2 years (range: 49.0–85.9); histology included UPSC (n=116), UCCC (n=27), and UCS (n=50). Median follow-up was 38.1 months (0.9–168.5 months). At multivariate analysis, patient age, ascites, and omental implants on CT were significant adverse predictors of OS and were used to build the nomogram. Concordance index for the nomogram was 0.640±0.028.
Conclusion
We developed a nomogram with a good concordance probability at predicting OS based on readily available pretreatment clinical and imaging characteristics. This preoperative nomogram has the potential to improve initial treatment planning and patient counseling.
Keywords: nomogram, CT, non-endometrioid carcinoma, uterus
INTRODUCTION
Accurate prognostication is one of the major goals of modern medicine as it is critical for personalized medical decision-making and patient counseling. Efforts to interpret the combined impact of multiple prognostic features in patients with cancer have lead to the development of risk stratification tools such as nomograms, which are graphical representations of a statistical model that provide an individualized prediction of a specific outcome.[1]. For many cancers, nomograms are equal or superior to the traditional staging systems for cancer prognosis [2–6].
The endometrium is the most common site of cancer in the female genital tract [7]. Endometrial cancers are commonly subdivided into two broad categories: endometrioid adenocarcinomas and non-endometrioid carcinomas [8]. Endometrioid adenocarcinomas, the most common subtype of endometrial cancer, are estrogen-dependent tumors that are frequently diagnosed at an early stage and, in general, have good prognosis. Non-endometrioid carcinomas are uncommon and include such histologic subtypes as UPSC, UCCC, and UCS [9]. These tumors are more aggressive than endometrioid adenocarcinomas, frequently demonstrate extra-uterine dissemination at the time of initial diagnosis, and, generally, have less favorable oncologic outcome than endometrioid adenocarcinomas [10, 11].
A post-surgical nomogram for the prediction of overall survival (OS) in women with endometrial cancer (EC) has been recently proposed by Abu-Rustum et al and has been externally validated in two separate patient cohorts [12–14]. Although this nomogram has an excellent concordance probability index, it can only be applied after the pathology from the surgical staging procedure is known. Hence, there is still a need for a prognostic tool that would be available at the time of the initial treatment planning and patient counseling.
CT scans are frequently obtained in patients with newly diagnosed non-endometrioid carcinomas of the uterine corpus because these tumors have a propensity toward extra-uterine spread even in the absence of such high risk features as deep myometrial invasion or cervical stromal invasion. Yet, little is known about the prognostic significance of the imaging features assessed at the preoperative CT.
Therefore, our study objective was to create a preoperative CT-based nomogram that may provide an accurate preoperative prediction of OS and improve pretreatment counseling for women with non-endometrioid carcinomas of the uterine corpus.
METHODS
The Institutional Review Board (Memorial Sloan-Kettering Cancer Center, New York, NY) approved and issued a waiver of informed consent for this retrospective study, which was compliant with the Health Insurance Portability and Accountability Act.
Patient Cohort
From a prospectively maintained endometrial cancer database, we identified 213 patients with pathologically proven UPSC, UCCC, or UCS who underwent surgery from May 1998 to December 2011, and underwent preoperative CT scanning ≤ 6 weeks prior to the operation. Of these, 16 patients were excluded due to concurrent metastatic tumors of other types: 8 for breast cancer, 3 for lung/pleural cancer, 2 for lymphoma, 1 for renal cell carcinoma, 1 for rectal cancer, and 1 for multiple primaries. One patient was excluded because of collagen vascular disease, and 3 for having received neoadjuvant chemotherapy. Thus, our study cohort included 193 patients. Of these, 8 patients were excluded from local disease analysis (but included in distant disease analysis) because their CT scans lacked intravenous contrast medium.
Clinical records were retrospectively reviewed for date of birth, date of diagnosis, pathologic findings, and clinical outcomes. Date of birth and diagnosis date were used to calculate age at diagnosis, a clinical characteristic previously shown to relate to overall survival.
CT Technique
All CTs were performed with oral contrast and 185/193 CT scans were acquired after intravenous contrast administration. CT examinations were obtained with various scanners (GE Healthcare Technologies, Milwaukee, WI). Our standard CT protocols were modified for each particular scanner. A dynamic power injection of 150 mL of nonionic intravenous contrast material was administered. Time delay to acquisition was determined on the basis of the typical time to portal venous phase imaging. Images from all CT examinations were sent to a picture archiving and communication system, PACS, (Centricity, GE Healthcare) for interpretation on PACS workstations.
The standard transverse section thickness for image viewing ranged from 2.5–7.5 mm. 29/193 CTs included 2.5 mm reformatted images in coronal and sagittal planes and 25/193 CTs had 2.5 mm reformatted images in coronal plane only. PACS workstations were equipped with 3D multiplanar image reconstruction software used at the discretion of the radiologist.
Image Analysis and Interpretation
Two radiologists (one radiologist with 6 years of subspecialty experience in gynecologic cancer imaging and one radiologist with 5 years of subspecialty experience in hepatobiliary oncologic imaging) independently reviewed all CT scans. Both readers were blinded to all clinical and histopathological information other than patient age and primary diagnosis of EC. CTs were evaluated for distant metastases and for local or regional spread of tumor such as presence of deep myometrial invasion (i.e. invasion equal to or greater than half of the myometrial thickness), cervical stromal involvement, invasion of the serosa of the corpus uteri or adnexa, or both, parametrial involvement, metastases to pelvic or paraaortic lymph nodes, or both, bladder and bowel invasion, presence of ascites, peritoneal thickening (over 3 mm), and omental implants. Such features as deep myometrial, cervical stromal, and corpus uteri serosal invasion were assessed as either present or absent in all patients whose CTs were acquired after administration of intravenous contrast medium (185/193 patients). Figure 1 illustrates deep myometrial and cervical stromal invasion on CT. Each of the imaging features pertaining to the regional tumor spread, nodal involvement, and distant metastases were assessed on a qualitative 1–5 scale as follows: 1=definitely absent, 2,=probably absent, 3,=indeterminate, 4= probably present, and 5=definitely present. Pelvic and paraaortic lymph nodes were considered abnormal if their short axis measurements were more than 0.8 cm and 1 cm, respectively, if they had irregular borders, or if they demonstrated heterogenous enhancement. Any CT feature scored as 4 or 5 was considered a positive finding.
Figure 1.

(A) Transverse and (B) sagittal contrast-enhanced CT images obtained in a 51-year-old woman with clear cell carcinoma of the uterine corpus demonstrate bulky endometrial tumor with deep myometrial invasion (arrow), dilation of the endocervical canal by the tumor and irregular interphase between the tumor and cervical stroma (arrowhead). (C) Transverse and (D) coronal contrast-enhanced CT images performed in a 49-year-old woman with clear cell carcinoma of the uterine corpus demonstrates deeply invasive tumor including frank cervical stromal invasion (arrowhead).
Statistical Methods
Inter-rater agreement was analyzed with the Cohen’ Kappa (k) statistic: agreement about the local staging was assessed using the simple κ statistic, while agreement pertaining to the extra-uterine dissemination was analyzed with a weighted κ with quadratic weights. The kappa values were interpreted as follows: 0.00–0.20=slight agreement, 0.21–0.40=fair agreement, 0.41–0.60=moderate agreement, 0.61–0.80=substantial agreement and 0.81–1.00=almost perfect agreement [15].
Overall survival (OS) and Recurrence Free Survival (RFS) served as the clinical end points. OS was the time interval between the date of surgery and the date of death or the last follow-up; patients alive at the last follow-up were censored. RFS was the time interval between the date of surgery and the date of recurrence or the date of death, or the last follow-up; patients alive and recurrence-free were censored at the last follow-up. CT imaging features detected in at least 10 patients were included in the survival analyses that were performed using the log-rank test for each CT feature and Cox regression for each patient characteristic. CT imaging features identified as significant by the univariate analysis (p<0.05) were further tested using multivariable Cox regression, and the backward selection was applied to choose the final model with entry significance level and stay significance level of 0.05.
A nomogram for predicting OS was created based on the final multivariable Cox Proportional Hazards Model. In the nomogram, we presented 3-year and 5-year predicted survival probabilities for each patient. The predictive accuracy was assessed via the concordance probability index (c-index) and the calibration plot at 3 years.
The c-index is a measure of the discriminatory ability of a nomogram with range 0 to 1: a value of 1 indicates that for any two randomly selected patients, the model predictions are perfectly concordant with the observed outcomes, 0 indicates perfectly discordance, and 0.5 indicates that the model’s predictions are no better than a coin toss [16].
Calibration of the nomogram (“Calibration plot”) was assessed by plotting its predicted probabilities of survival against the Kaplan-Meier estimates used as a standard of reference. In an ideal nomogram all predicted probabilities fall on the diagonal line. Internal validation was performed on both assessments to produce adjusted c-index and adjusted survival probabilities using bootstrap with 200 repetitions to reduce overestimates of predictive accuracy [17].
Statistical analyses were performed in software packages SAS 9.2 (SAS Institute Inc., Cary, NC, USA) and R version 2.13 (The R Foundation for Statistical Computing).
RESULTS
All patient characteristics and treatments are summarized in Table 1. The mean patient age was 67.2 ± 8.1 years (range: 49.0–85.9 years). Histologic subtypes included UPSC (n=116/193), UCCC (n=27/193), and UCS (n=50/193). The mean time between CT and surgery was 11.9 ± 8.9 days (range: 0.0–36.0 days).
Table 1.
Baseline Characteristics
| Variable | N | % |
|---|---|---|
| All | 193 | |
| Vital status | ||
| Alive | 121 | |
| Dead | 72 | |
| Age at diagnosis | ||
| Mean ± SD | 67.2±8.1 | |
| Range | 49.0–85.9 | |
| Histologic subtype | ||
| Papillary Serous | 116 | 60 |
| Clear cell | 27 | 14 |
| Carcinosarcoma | 50 | 26 |
| 2009 FIGO* stage | ||
| IA | 84 | 44 |
| IB | 12 | 6 |
| II | 17 | 9 |
| IIIA | 5 | 2.5 |
| IIIB | 0 | 0 |
| IIIC1 | 22 | 11 |
| IIIC2 | 20 | 10 |
| IVA | 1 | 0.5 |
| IVB | 32 | 17 |
| Surgical procedures | ||
| TAH+BSO | 193 | 100 |
| Pelvic lymphadenectomy | 189 | 98 |
| Aortic lymphadenectomy | 139 | 72 |
| Omentectomy | 149 | 77 |
| Omental biopsy alone | 20 | 10 |
| Perihepatic/diaphragmatic biopsy or resection | 32 | 16.5 |
| Liver resection | 2 | 1 |
| Bowel biopsy or resection | 36 | 19 |
| Mesenteric biopsy or resection | 13 | 7 |
| Adjuvant Therapy | ||
| Chemotherapy | ||
| Yes | 157 | 81 |
| No | 36 | 19 |
| Radiation | ||
| Yes | 73 | 61 |
| No | 119 | 39 |
| Days between CT and surgery | ||
| Mean ± SD | 11.9±8.9 | |
| Range | 0–36.0 | |
FIGO = International Federation of Gynecological Oncologists
The inter-observer agreement analysis is summarized in Table 2. The agreement between two readers ranged from moderate for the presence of deep myometrial invasion (k=0.42), to substantial for the presence of ascites (k=0.74) and omental implants (k=0.73), to almost perfect for the detection of pelvic (k=0.86) and paraaortic (k=0.88) lymphadenopathy.
Table 2.
Inter-observer agreement
| Variables | Simple Kappa | Standard Error | Interpretation |
|---|---|---|---|
| Deep Myometrial Invasion | 0.42 | 0.06 | Moderate |
| Cervical Stromal Invasion | 0.61 | 0.06 | Substantial |
| Corpus Uteri Serosal Invasion | 0.44 | 0.11 | Moderate |
| Variables | Weighted Kappa | Standard Error | Interpretation |
| Adnexal Invasion | 0.64 | 0.06 | Substantial |
| Pelvic Adenopathy | 0.86 | 0.04 | Almost perfect |
| Paraaortic Adenopathy | 0.88 | 0.08 | Almost perfect |
| Ascites | 0.74 | 0.07 | Substantial |
| Omental Implants | 0.73 | 0.07 | Substantial |
| Rectosigmoid Involvement | 0.61 | 0.16 | Substantial |
The median follow-up for survivors was 38.1 months (range: 0.9–168.3 months). Seventy-two patients died during the follow-up period. Among them, 53 (74%) patients died of disease, 6 (8%) died of other known causes, and 13 (18%) died of unknown causes. Twenty-two patients alive at the last follow-up had recurrent disease. The median OS in this cohort was 66.3 months (95%CI: 52.7–87.3 months), and median RFS was 41.4 months (95%CI: 29.4 – 72.0 months).
Given substantial to almost perfect inter-reader agreement for the majority of the variables assessed at CT, only CT scan interpretations by reader 1 were used for the survival analyses and nomogram development. Multiple CT features and two potential clinical predictors of OS and RFS were evaluated. In the univariate analysis of OS, 10 of the multiple analyzed CT features and patient age were significant prognostic factors (p-values: <0.001–0.023) (Tables 3 and 4). At the univariate analysis of RFS, the same 10 CT features were significant predictors (p-values <0.001–0.002), but none of the clinical characteristics were significant (Tables 3 and 4). In the multivariate analysis summarized in Table 5, patient age, presence of ascites and omental implants on preoperative CT had prognostic significance for OS (p = 0.006, 0.04, 0.006, respectively), while presence of cervical stromal invasion and omental implants on CT achieved significance for RFS (p ≤ 0.001).
Table 3.
Univariate Survival Analysis on Preoperative CT Features
| OS | ||||
|---|---|---|---|---|
| CT features | Absent (0)/Present(1) | Total | 36 -Month OS Rate (95%CI) | Log-Rank Test p-Value |
| Deep Myometrial Invasion | 0 | 77 | 82.5% (73.5%, 92.6%) | 0.008 |
| 1 | 108 | 60.3% (50.9%, 71.4%) | ||
| Cervical Stromal Invasion | 0 | 154 | 74.2% (66.8%, 82.4%) | 0.002 |
| 1 | 31 | 46.7% (31.2%, 69.8%) | ||
| Serosal Invasion of the Corpus Uteri | 0 | 164 | 71.4% (64%, 79.5%) | 0.002 |
| 1 | 21 | 49.6% (30.5%, 80.4%) | ||
| Adnexal Invasion | 0 | 174 | 73.2% (66.2%, 80.9%) | <.001 |
| 1 | 19 | 36.4% (19.4%, 68.3%) | ||
| Peritoneal Thickening | 0 | 180 | 72.4% (65.4%, 80.1%) | <.001 |
| 1 | 13 | 30.8% (13.6%, 69.5%) | ||
| Omental Implants | 0 | 175 | 74.9% (68%, 82.5%) | <.001 |
| 1 | 18 | 19.4% (7.2%, 52.2%) | ||
| Cul-de-sac Implants | 0 | 179 | 72.8% (65.8%, 80.6%) | <.001 |
| 1 | 14 | 28.6% (12.5%, 65.4%) | ||
| Ascites | 0 | 169 | 73.8% (66.6%, 81.7%) | <.001 |
| 1 | 24 | 40.2% (24.4%, 66.1%) | ||
| Pelvic Adenopathy | 0 | 156 | 74.1% (66.8%, 82.2%) | 0.023 |
| 1 | 37 | 48.6% (33.5%, 70.5%) | ||
| Retroperitoneal Adenopathy | 0 | 169 | 73.6% (66.5%, 81.4%) | <.001 |
| 1 | 24 | 40.2% (23.8%, 67.8%) | ||
| RFS | ||||
| CT features | Absent (0)/Present(1) | Total | 36-Months RFS Rate (95%CI) | Log-Rank Test p-Value |
| Deep Myometrial Invasion | 0 | 77 | 71.6% (61.3%, 83.5%) | 0.002 |
| 1 | 108 | 43.6% (34.7%, 54.9%) | ||
| Cervical Stromal Invasion | 0 | 154 | 59.2% (51.3%, 68.4%) | <.001 |
| 1 | 31 | 33.9% (20.4%, 56.2%) | ||
| Serosal Invasion of the Corpus Uteri | 0 | 164 | 59% (51.4%, 67.7%) | <.001 |
| 1 | 21 | 20.4% (7.9%, 52.7%) | ||
| Adnexal Invasion | 0 | 174 | 59.9% (52.6%, 68.3%) | <.001 |
| 1 | 19 | 12.7% (3.5%, 45.7%) | ||
| Peritoneal Thickening | 0 | 180 | 58.8% (51.4%, 67.1%) | <.001 |
| 1 | 13 | 7.7% (1.2%, 50.6%) | ||
| Omental Implants | 0 | 175 | 60.6% (53.2%, 69%) | <.001 |
| 1 | 18 | NA (NA, NA) | ||
| Cul-de-sac Implants | 0 | 179 | 58.4% (51.1%, 66.8%) | <.001 |
| 1 | 14 | 14.3% (4%, 51.5%) | ||
| Ascites | 0 | 169 | 59.9% (52.4%, 68.5%) | <.001 |
| 1 | 24 | 23.1% (10.9%, 49.1%) | ||
| Pelvic Adenopathy | 0 | 156 | 61.2% (53.4%, 70%) | 0.002 |
| 1 | 37 | 30.3% (18%, 51%) | ||
| Retroperitoneal Adenopathy | 0 | 169 | 59.9% (52.4%, 68.5%) | <.001 |
| 1 | 24 | 23.4% (11.1%, 49.4%) | ||
Note: NA – not estimable. This group of patients either already had an event (n=17) or were censored (n=1) before 36 months.
Table 4.
Univariate survival analysis on patient characteristics
| Hazard Ratio (95%CI) | p-Value | |
|---|---|---|
| OS | ||
| Age (5-year increment) | 1.19 (1.03, 1.38) | 0.019 |
| Histologic subtype | ||
| Carcinosarcoma | 1 | |
| Clear cell | 0.78 (0.34,1.79) | 0.556 |
| Papillary serous | 1.01 (0.59,1.74) | 0.972 |
| RFS | ||
| Age (5-year increment) | 1.11 (0.99, 1.27) | 0.078 |
| Histologic subtype | ||
| Carcinosarcoma | 1 | |
| Clear cell | 0.69 (0.33,1.43) | 0.315 |
| Papillary serous | 0.94 (0.59,1.50) | 0.794 |
Table 5.
Multivariable analysis
| Multivariable OS analysis (n=193) | Hazard Ratio (95%CI) | p-Value |
|---|---|---|
| Age (5-year increment) | 1.24 (1.06, 1.45) | 0.006 |
| Ascites | ||
| No | Ref | |
| Yes | 2.32 (1.04, 5.19) | 0.040 |
| Omental implants | ||
| No | Ref | |
| Yes | 3.26 (1.40, 7.61) | 0.006 |
| Multivariable RFS analysis (n=185) | HR (95%CI) | p-Value |
| Cervical stromal invasion | ||
| No | Ref | |
| Yes | 2.19 (1.37, 3.49) | 0.001 |
| Omental implants | ||
| No | Ref | |
| Yes | 6.70 (3.74, 12.00) | <.001 |
The nomogram for predicting OS is summarized in Figure 2 and Figure 3. Patient age and presence of ascites and omental implants on CT were significant prognostic factors at the multivariate analysis and were used to build the nomogram. For each patient, points are assigned based on each of these 3 predictors using the top section of the nomogram and are summed. The total points so generated are then related to predicted 3-year OS and 5-year OS probabilities in the bottom section.
Figure 2. CT-based preoperative nomogram for predicting overall survival.
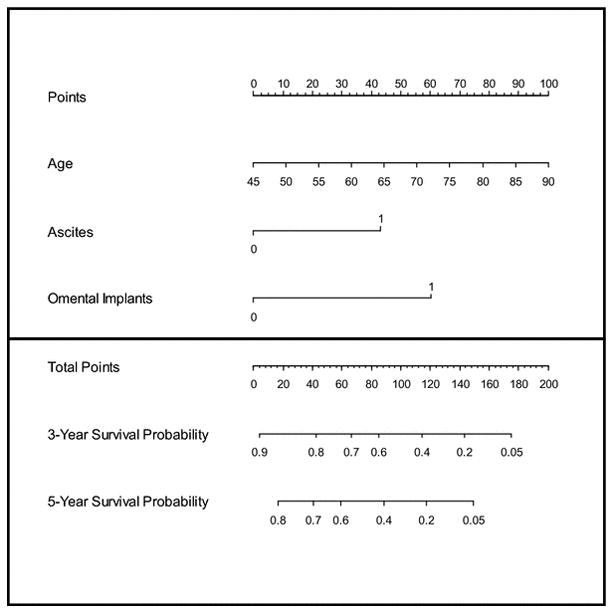
For each patient, find out the value of each predictor and read off the number from “Points” located on the top axis, then add the points of all predictors and locate it on the “Total Points” axis. The 3-year and the 5-year survival probabilities are the values intersected by a line drawn vertically from the total points.
Figure 3.

Calibration plot for the nomogram
The performance of the nomogram was evaluated by calibration and discrimination. The nomogram was internally validated with the bootstrap correction technique. The bootstrap-adjusted concordance probability index for the nomogram was 0.640 with a standard error of 0.028. The predicted probabilities obtained from the nomogram and the Kaplan-Meier estimated probabilities of 3-year OS are shown in the calibration plot (Figure 2); the predictions were comparable to the Kaplan-Meier estimated OS with very little deviation.
DISCUSSION
In the present study we present an internally validated preoperative CT-based nomogram for predicting OS in women with non-endometrioid carcinomas of the uterine corpus. Derived from a cohort of 193 patients who had preoperative CT ≤ 6 weeks prior to surgery, our nomogram is based on patient age and two easily assessable CT findings: presence of ascites and omental implants. Performance metrics (concordance index of 0.64±0.028 and calibration with predicted 3-year OS within 8% of K-M estimates) demonstrate good predictive accuracy.
Abu-Rustum and colleagues have recently published a postsurgical nomogram that addressed the prediction of OS in patients with EC after primary therapy [12]. Their nomogram was derived from a cohort of 1735 patients and was based on 5 clinical characteristics consisting of patient age, final FIGO stage, tumor grade and histology, and number of negative lymph nodes. The nomogram had high concordance probability of 0.746±0.011 and it has been recently externally validated on two independent sets of patients [13, 14]. However, the above nomogram requires the knowledge of the final FIGO stage and the number of negative lymph nodes that are only available following the surgical staging procedure and, hence, cannot be used for the initial patient counseling.
No prior publications have looked at the prognostic value of pretreatment imaging findings in patients with non-endometrioid carcinomas of the uterine corpus; prior efforts being based solely on clinicopathologic parameters [18, 19]. Therefore, our study focus on imaging features has the potential to refine pretreatment risk stratification of women with non-endometrioid histologic subtypes and to improve medical decision-making by preoperatively identifying high-risk patients (i.e. patients with ascites and omental implants on CT) who may benefit to more extensive pretreatment counseling and possibly enrollment into clinical trials.
Our study has several limitations. Since non-endometrioid carcinomas of the uterine corpus are relatively uncommon, the model we created was based on a retrospective review of prospectively collected data from a single institution accumulated over a long time period. Therefore, we could not control for changes in clinical practice such as modifications in the surgical resection templates, evolution of the post-resection adjuvant therapies (because of the lack of standardization and continuous changes), and changes in CT imaging technology. Additionally, since preoperative MR imaging was not available on many of our patients we examined the prognostic imaging features available from preoperative CT scans which are often obtained for staging of non-endometrioid carcinomas of the uterine corpus at our (and most likely many other) institution(s). Although it is well known that MR Imaging is the imaging modality of choice for local staging of EC (i.e. assessment of deep myometrial invasion, serosal involvement of the corpus uteri, and detection of cervical stromal invasion), CT is widely used for detection of distant metastases and both modalities perform similarly in identifying nodal metastases [20]. In a separate study (manuscript submitted to the Annals of Surgical Oncology) we examined the diagnostic accuracy of CT for preoperative staging of non-endometrioid carcinomas of the uterine corpus. Finally, our nomogram was based on CT interpretations of a single radiologist. We believe it was justified because of the excellent inter-observer agreement across a number of variable and the fact that clinically relevant nomogram cannot be reader-specific.
CONCLUSION
Nomograms have been used successfully for risk stratification and cancer prognosis in a number of malignancies and, in general, their performance is either comparable or superior to the traditional staging systems [2–6]. In this study, we constructed and internally validated a preoperative CT-based nomogram tailored to predicting OS in women with non-endometrioid carcinomas of the uterine corpus. This nomogram has a good concordance probability and is based on 3 variables, one found in legal records (patient age) and two routinely assessed on preoperative CT scan, that are easily available at the time of initial evaluation. The results of this nomogram may aid clinicians in stratifying pretreatment risk, planning individualized treatment, and initial patient counseling. Further studies are needed to validate the accuracy of this nomogram in independent external patient cohorts.
Footnotes
There are no conflicts to disclose.
References
- 1.Iasonos A, Schrag D, Raj GV, Panageas KS. How to Build and Interpret a Nomogram for Cancer Prognosis. J Clin Oncol. 2008;26:1364–1370. doi: 10.1200/JCO.2007.12.9791. [DOI] [PubMed] [Google Scholar]
- 2.Kattan MW. Nomograms Are Superior to Staging and Risk Grouping Systems for Identifying High Risk Patients: Preoperative Application in Prostate Cancer. Curr Opin Urol. 2003;13:111–116. doi: 10.1097/00042307-200303000-00005. [DOI] [PubMed] [Google Scholar]
- 3.Mariani L, Miceli R, Kattan MW, et al. Validation and Adaptation of a Nomogram for Predicting the Survival of Patients with Extremity Soft Tissue Sarcoma Using a Three-grade System. Cancer. 2005;103:402–408. doi: 10.1002/cncr.20778. [DOI] [PubMed] [Google Scholar]
- 4.Wang L, Hricak H, Kattan MW, Chen HN, Scardino PT, Kuroiwa K. Prediction of Organ-confined Prostate Cancer: Incremental Value of MR Imaging and MR Spectroscopic Imaging to Staging Nomograms. Radiology. 2006;238:597–603. doi: 10.1148/radiol.2382041905. [DOI] [PubMed] [Google Scholar]
- 5.Wong SL, Kattan MW, McMasters KM, Coit DG. A Nomogram that Predicts the Presence of Sentinel Node Metastasis in Melanoma with Better Discrimination than the American Joint Committee on Cancer Staging System. Ann Surg Oncol. 2005;12:282–288. doi: 10.1245/ASO.2005.05.016. [DOI] [PubMed] [Google Scholar]
- 6.Ohori M, Kattan MW, Koh H, et al. Predicting the Presence and Side of Extracapsular Extension: A Nomogram for Staging Prostate Cancer. J Urol. 2004;171:1844–1849. doi: 10.1097/01.ju.0000121693.05077.3d. [DOI] [PubMed] [Google Scholar]
- 7.American Cancer Society. Global Cancer Facts and Figures. 2 [Google Scholar]
- 8.Doll A, Abal M, Rigau M, et al. Novel Molecular Profiles of Endometrial Cancer-New Light through Old Windows. J Steroid Biochem Mol Biol. 2008;108:221–229. doi: 10.1016/j.jsbmb.2007.09.020. [DOI] [PubMed] [Google Scholar]
- 9.Tejerizo-Garcia A, Jimenez-Lopez JS, Munoz-Gonzalez JL, et al. Overall Survival and Disease-Free Survival in Endometrial Cancer: Prognostic Factors in 276 Patients. OncoTargets Ther. 2013;9:1305–1313. doi: 10.2147/OTT.S51532. [DOI] [PMC free article] [PubMed] [Google Scholar]
- 10.Hendrickson M, Ross J, Eifel PJ, Cox RS, Martinez A, Kempson R. Adenocarcinoma of the Endometrium: Analysis of 256 Cases with Carcinoma Limited to the Uterine Corpus – Pathology Review and Analysis of Prognostic Factors. Gynecol Oncol. 1982;13:373–392. doi: 10.1016/0090-8258(82)90076-2. [DOI] [PubMed] [Google Scholar]
- 11.Amant F, Moerman P, Neven P, Timmerman D, Van Limbergen E, Vergote I. Endometrial Cancer. Lancet. 2005;366:491–505. doi: 10.1016/S0140-6736(05)67063-8. [DOI] [PubMed] [Google Scholar]
- 12.Abu-Rustum NR, Zhou Q, Gomez JD, et al. A Nomogram for Predicting Overall Survival of Women with Endometrial Cancer following Primary Therapy: Toward Improving Individualized Cancer Care. Gynecol Oncol. 2010;116:399–403. doi: 10.1016/j.ygyno.2009.11.027. [DOI] [PMC free article] [PubMed] [Google Scholar]
- 13.Polterauer S, Zhou Q, Grimm C, et al. External Validation of a Nomogram Predicting Overall Survival of Patients Diagnosed with Endometrial Cancer. Gynecol Oncol. 2012;125:526–530. doi: 10.1016/j.ygyno.2012.03.030. [DOI] [PMC free article] [PubMed] [Google Scholar]
- 14.Koskas M, Bendifallah S, Luton D, Darai E, Rouzier R. Independent External Validation of Radiotherapy and its Impact on the Accuracy of a Nomogram for Predicting Survival of Women with Endometrial Cancer. Gynecol Oncol. 2011;123:214–220. doi: 10.1016/j.ygyno.2011.08.006. [DOI] [PubMed] [Google Scholar]
- 15.Landis JR, Koch GG. The Measurement of Observer Agreement for Categorical Data. Biometrics. 1977;33:159–174. [PubMed] [Google Scholar]
- 16.Gonen M, Heller G. Concordance Probability and Discriminatory Power in Proportional Hazards Regression. Biometrika. 2005;92:965–970. [Google Scholar]
- 17.Efron B, Tibshirani R. An Introduction to the Bootstrap. Chapman and Hall; New York, London: 1993. [Google Scholar]
- 18.Vance S, Yechieli R, Cogan C, Hanna R, Munkarah A, Elshaikh MA. The Prognostic Significance of Age in Surgically Staged Patients with Type II Endometrial Carcinoma. Gynecol Oncol. 2012;126:16–19. doi: 10.1016/j.ygyno.2012.04.011. [DOI] [PubMed] [Google Scholar]
- 19.Fader AN, Starks D, Gehrig PA, et al. An Updated Clinicopathologic Study of Early-Stage Uterine Papillary Serous Carcinoma (UPSC) Gynecol Oncol. 2009;115:244–248. doi: 10.1016/j.ygyno.2009.07.030. [DOI] [PubMed] [Google Scholar]
- 20.Sala E, Wakely S, Senior E, Lomas D. MRI of Malignant Neoplasms of the Uterine Corpus and Cervix. AJR Am J Roentgenol. 2007;188:1577–1587. doi: 10.2214/AJR.06.1196. [DOI] [PubMed] [Google Scholar]