

Abstract
Since 2000, an increase in hepatitis C virus infection among HIV-infected (HIV+) men who have sex with men has been observed. Evidence points to blood exposure during sex as the medium of hepatitis C virus transmission. Hepatitis C virus prevalence among HIV+MSM overall and in relation to injection drug use is poorly characterized. In this study, a systematic review and meta-analysis examining global hepatitis C virus antibody prevalence and estimating active hepatitis C virus prevalence among HIV+MSM were conducted; 42 reports provided anti-hepatitis C virus prevalence data among HIV+MSM. Pooled prevalence produced an overall anti-hepatitis C virus prevalence among HIV+MSM of 8.1%; active HCV prevalence estimate was 5.3%–7.3%. Anti-hepatitis C virus prevalence among injection drug use and non-injection drug use HIV+MSM was 40.0% and 6.7%, respectively. Among HIV+MSM, hepatitis C virus prevalence increased significantly over time among the overall and non-injection drug use groups, and decreased significantly among injection drug use HIV+MSM. We identified a moderate prevalence of hepatitis C virus among all HIV+MSM and among non-injection drug use HIV+MSM; for both, prevalence was observed to be increasing slightly. Pooled prevalence of hepatitis C virus among HIV+MSM was higher than that observed in the 1945–1965 US birth cohort. The modest but rising hepatitis C virus prevalence among HIV+MSM suggests an opportunity to control HCV among HIV+MSM; this combined with data demonstrating a rising hepatitis C virus incidence highlights the temporal urgency to do so.
Keywords: Men who have sex with men, systematic review, meta-analysis, hepatitis C virus infection, HIV/AIDS, HIV/HCV co-infection
Introduction
Men who have sex with men (MSM) are at substantial risk for HIV infection worldwide.1,2 In high-income countries, HIV epidemic trends are in decline, except among MSM.2 There are significant HIV epidemics among MSM in many low- and middle-income countries; global HIV prevalence among MSM is estimated at 3–26%.2
One-third of HIV-infected persons is co-infected with hepatitis C virus (HCV) largely, because injection drug use (IDU) is both an HCV and HIV risk.3 HCV has become the leading cause of death among HIV-infected persons in high-income countries.4 Since 2000, an increase in the incidence of HCV infection among HIV+MSM has been observed.5 A recent systematic review and meta-analysis (SR/MA) estimated that the rate of sexually transmitted HCV in HIV+MSM was 0.53/100 person-years (PYs), and identified a small but statistically significant increase in incidence rates.5
Several factors may contribute to the excess incidence and prevalence of HCV among HIV+MSM, including biologic interactions of the two viruses, co-existent sexually transmitted infections (STIs), behavioral risks such as blood exposure during sex and sero-sorting in relation to HIV status, and overlaps between sexual and drug injection networks.6,7 HCV is readily transmitted by non-sterile IDU, but sexual transmission among heterosexuals has been shown to be very low.8 Research points to the presence of blood during high-risk sex as the primary means of HCV transmission among HIV+MSM.9,10 HCV viral loads are higher in semen and blood in the presence of HIV, and this may increase the likelihood of transmission.11 Immunosuppressant effects of HIV may lead to a decreased likelihood of clearing HCV if exposed, and hence to higher rates of persistent infection.12,13 Mucosally ulcerative STIs, which are clearly associated with HIV transmission, might similarly facilitate HCV acquisition; associations between STIs and incidence of HCV in HIV+MSM have been observed.2,14,15
HCV transmission among HIV+MSM has been associated both with unprotected sexual behaviors that may be both mucosally traumatic and likely to be associated with blood exposure.14,15 Sexual network characteristics may confer increased HCV transmission risk; since sero-concordance is generally sought on the basis of HIV rather than HCV status, this may facilitate HCV transmission.16,17 Further, HCV prevalence is usually high among people who inject drugs (PWID), and sexual networks of MSM may include MSM who also inject drugs, increasing the likelihood of HCV exposure.6,7,18,19 Non-IDU may also be associated with increased HCV acquisition risk through prolonged sexual activity or increased risk taking.15
The objective of this SR/MA was to synthesize the data on HCV prevalence among HIV+MSM worldwide, both overall and specifically among those who have or have not also injected drugs. The goal of conducting this analysis was to estimate the pool of HCV-infected HIV+MSM who may transmit HCV to uninfected HIV+MSM in sexual and/or drug using contexts, to estimate the proportions of HIV+MSM who may benefit from HCV treatment, and to inform modeling, HCV screening and preventive interventions, and public health control efforts.
Methods
Details of the methods for this SR/MA have been published elsewhere (International Register of Prospective Systematic Reviews, registration number CRD42013006462);20 hence, a summary is provided here.21,22
Search strategy
A comprehensive automated search for published literature using the electronic databases of PubMed, EMBASE, and BIOSIS was conducted; the search string comprised terms related to HCV, HIV/AIDS, MSM, and epidemiology. Reference lists and gray literature were manually reviewed for inclusion.
Inclusion criteria
To be eligible, all reports must have been written in English, been published from 1/1990–2/2015, and provided data on HCV prevalence among HIV+MSM based on HCV antibody (anti-HCV), recombinant immunoblot assays (RIBA), or tests for HCV RNA to confirm HCV infection. The overall pooled estimate included all reports, even those that did not distinguish between injection drug using (IDU) HIV+MSM and non-IDU HIV+MSM. Some reports specifically gave prevalence estimates for non-IDU HIV+MSM while other reports gave prevalence estimates for IDU HIV+MSM; each were also examined separately. Thus, there were three sets of data examined: (1) HIV+MSM regardless of known or unknown injection history; (2) non-IDU HIV+MSM; and (3) IDU HIV+MSM. These three groups allowed examination of the prevalence of HCV among HIV+MSM not directly exposed via IDU, the prevalence among MSM who had also injected, as well as the prevalence among all HIV+MSM who may be connected via sexual networks regardless of individual drug injection status.
Screening and coding
Review of potentially eligible reports was a multi-stage process as depicted in the PRISMA flow diagram (Figure 1). Geographic location, years of data collection, study design elements, study sample characteristics, and HCV prevalence were abstracted from each report. The project director (PD) and graduate level research assistant (RA) screened, reviewed, and coded reports; the principal investigator, PD, co-authors, and RA collectively resolved any issues that emerged during screening and coding.
Figure 1.
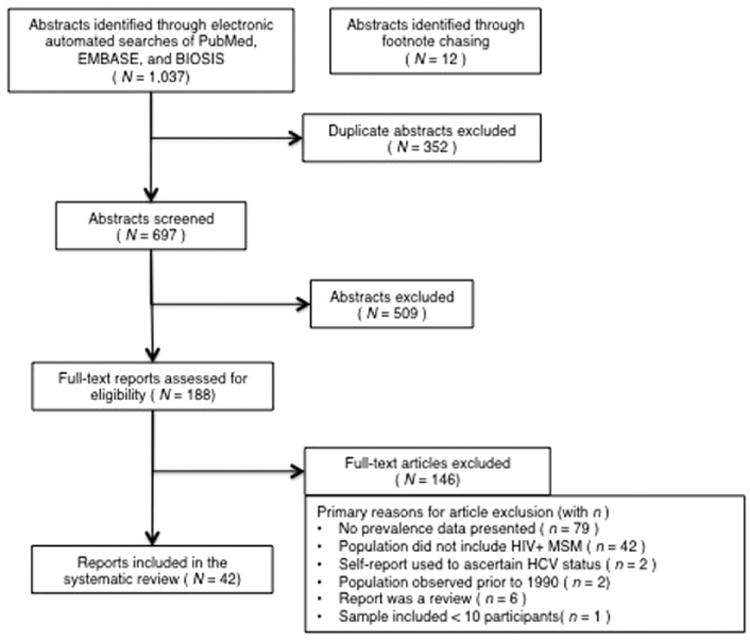
PRISMA flow of information from identification to inclusion of studies.
Quality ratings
Included studies were assigned quality ratings using a standardized instrument adapted from the Newcastle-Ottawa Scale (NOS).23 Emphasis was placed on the risk of selection bias due to sampling method; reports were classified as being of higher quality if they employed consecutive or systematic sampling or of lower quality if they utilized convenience sampling.
Estimates provided in reports for individuals “currently”, “recently”, or “ever” having injected drugs were considered as a group; only reports that explicitly stated that participants had never injected drugs were included in the group of non-IDU HIV+MSM. Reports providing estimates that either did not state IDU histories explicitly, provided histories of drug use without specifying the route of drug use, or did not clearly distinguish IDU from non-IDU were only included in the overall pooled estimate.
Data analysis
The first stage of data analysis was to determine an overall pooled HCV prevalence estimate based on all included studies, for non-IDU HIV+MSM, and for IDU HIV+MSM, respectively. Analyses were also conducted specifically of reports from the US to allow comparisons with recent data on the prevalence of HCV among those in the US cohort born between 1945 and 1965. Pooled prevalence estimates were calculated using a random effects model; 95%confidence intervals (CIs) were calculated around these estimates assuming a normal distribution. To determine whether observed heterogeneity across estimates was compatible with chance, Cochrane's Q statistic was calculated; I2 was calculated to quantify inconsistency in prevalence measures. Analyses were done in R (CRAN R Project 2015) and SPSS (SPSS, Inc., Chicago IL).
Data on potential covariates were extracted; this was limited by low reporting of covariates and lack of consistency in covariate reporting across studies, including overlap and variability in recruitment location characteristics. However, calendar time, geographic region, and selection bias were available and examined as study-level moderators.
When reports presented HCV prevalence in relation to participants enrolled over a span of two to four years, we assigned the temporal midpoint of the data collection period to the prevalence rate. This allowed us to include these estimates, along with estimates reported in individual years, in moderator analyses; the analysis of time as a moderator of prevalence included 19 estimates of non-IDU HIV+MSM and 9 estimates of IDU HIV+MSM.
Estimating prevalence of active HCV infection
We estimated the prevalence of active HCV infection among the three groups (HIV+MSM overall, non-IDU HIV+MSM, and IDU HIV+MSM) using rates of HCV clearance among HIV+MSM and among PWID without HIV infection calculated in another SR/MA from this project.13 Prevalence estimates of chronic infection were calculated by multiplying the pooled prevalence rates by the clearance rate. Three estimates of the prevalence of active HCV infection were made for each group (Table 2).
A range of prevalence of active HCV infection using the range of the pooled prevalence for each group, and the upper and lower bounds of the relevant HCV clearance rate.
A minimum prevalence of active HCV infection by using the lower bound of the 95% CI of the estimated anti-HCV prevalence and the upper bound of the relevant HCV clearance rate.
A maximum prevalence of active HCV infection by using the upper bound of the 95% CI of the estimated anti-HCV prevalence and the lower bound of the relevant HCV clearance rate.
Table 2.
Estimated prevalence of active HCV infection among HIV + MSM.
| Pooled HCV antibody prevalence (%) | 95% confidence intervals for HCV antibody prevalence | Estimated prevalence of active HCV infection (%)a | Minimum estimated prevalence of active HCV infection (%)b | Maximum estimated prevalence of active HCV infection (%)c | |
|---|---|---|---|---|---|
| HIV+MSM, overall | 8.2 | 5.3d–7.3e | |||
| Lower bound:6.6 | 4.3d | ||||
| Upper bound:9.7 | 8.6e | ||||
| HIV+MSM, non-IDU | 6.7 | 4.9f–5.9e | |||
| Lower bound:5.3 | 4.3e | ||||
| Upper bound:8.1 | 7.2e | ||||
| HIV+MSM, IDU | 40.0 | 26.0d–35.4e | |||
| Lower bound:28.0 | 18.2d | ||||
| Upper bound:51.0 | 45.0e |
HCV: hepatitis C virus; IDU: injection drug use; MSM: men who have sex with men.
Lower end of the prevalence range of active HCV infection = (estimated prevalence of anti-HCV) × (1 − lower bound of estimated HCV clearance rate) and upper end of the prevalence range of active HCV infection = (estimated prevalence of anti-HCV) × (1 − upper bound of estimated HCV clearance rate).
Minimum estimated prevalence of HCV infection = (lower bound of the 95% CI of estimated anti-HCV prevalence) × (1 − upper bound of 95% CI of estimated clearance rate).
Maximum estimated prevalence of HCV infection = (upper bound of the 95% CI of estimated HCV antibody prevalence of anti-HCV) × (1 − lower bound of 95% CI of estimated clearance rate).
Using an estimated clearance proportion of 35.0%.
Using an estimated clearance proportion of 11.5%.
Using an estimated clearance proportion of 19.3%.
In a recent SR/MA, HCV clearance rates identified among HIV-PWID (25.7% [95% CI 16.4–35.0%]) were higher than those identified among either HIV + PWID (16.1% [95% CI 12.5–19.6%]) or among HIV+MSM (15.4% [95% CI 11.5–19.3%]).13 The relevant HCV clearance rates used in our estimates of active infection rates were as follows:
For non-IDU HIV+MSM, since the incidence of sexually transmitted HCV among HIV–MSM is generally quite low, we assumed that HIV infection preceded HCV infection.24 We therefore used the rates of HCV clearance among HIV+MSM identified in the recent SR/MA (11.5%–19.3%).
For IDU HIV+MSM, and for the overall group of HIV+MSM (including IDU HIV+MSM, non-IDU HIV+MSM, and those of unknown IDU status) it cannot be assumed that HIV infection preceded HCV infection. While HCV infection may generally precede HIV infection among PWID, among IDU HIV+MSM whose individual risk behavior histories are not clearly known, and in groups reflecting variable and uncertain proportions of IDU and non-IDU HIV+MSM, it also cannot be assumed that HCV infection preceded HIV infection. Therefore, for both the overall group of HIV+MSM and IDU HIV+MSM, we estimated the minimum prevalence of active HCV by applying the upper bound of the 95% CI of the highest clearance rate identified (i.e. the 35% rate of HCV clearance identified among HIV-negative PWID), and estimated the maximum prevalence of active HIV by applying the lower bound of the 95% CI of the lowest rate of clearance identified (i.e. the 11.5% rate of HCV clearance identified among HIV+MSM).
Results
General
The literature search generated a total of 1049 potentially eligible abstracts; after duplicates and ineligible abstracts were removed, 188 were reviewed as full-text articles. Reasons for ineligibility can be found in Figure 1. A final set of 42 reports presenting HCV prevalence among HIV+MSM yielded 43 HCV prevalence estimates.10,14,25–62 Eleven reports provided 12 estimates for IDU HIV+MSM10,25,33,35,37,40,42,51,52,55,63 and 26 reports provided 27 estimates for non-IDU HIV+MSM10,14,25–29,33,35,37,39,40,42,45,47,49–52,54,56,57,59,63 (Table 1(a) to (c)).
Table I.
Prevalence of hepatitis C virus (HCV) infection among HIV + men who have sex with men: (a) Overall and (b) Non-IDU (c) IDU.
| First author, publication year |
Location | Study years | Recruitment method |
Recruitment setting |
HCV test (anti-HCV, RIBA/RNA) |
No. HCV positive |
Sample size |
Prevalence (%) |
95% CI (LL) |
95% CI (UL) |
|---|---|---|---|---|---|---|---|---|---|---|
| (a). Overall | ||||||||||
| Amin et al.25 | Multiple | 1995–1996 | Systematic | n/s | Anti-HCV | 18 | 951 | 1.9% | 1.1% | 3.0% |
| Barfod et al.26 | Denmark | 2006–2009 | Consecutive | HIV clinic | Anti-HCV | 41 | 871 | 4.7% | 3.4% | 6.3% |
| D'Oliveira et al.27 | Greece | 1986–1997 | Consecutive | HIV clinic | Anti-HCV | 81 | 1431 | 5.7% | 4.5% | 7.0% |
| Dimitrakopoulos et al.28 | France | 1992–2002 | Consecutive | Hospital | Anti-HCV | 10 | 123 | 8.1% | 4.0% | 14.4% |
| Edelenyi-Pinto et al.29 | Brazil | 1990–1991 | Convenience | Research study | Anti-HCV | 9 | 113 | 8.0% | 3.7% | 14.6% |
| Fainboim et al.30 | Argentina | 1994–1995 | Convenience | Hospital | Anti-HCV | 14 | 99 | 14.1% | 8.0% | 22.6% |
| Filippini et al.31 | Italy | 1996–2001 | Convenience | HIV clinic | Anti-HCV | 3 | 29 | 10.3% | 2.2% | 27.4% |
| Gamage et al.32 | Australia | 2002–2010 | Consecutive | HIV clinic | Anti-HCV | 109 | 869 | 12.5% | 10.4% | 14.9% |
| Garg et al.33 | U.S. | 1997–2009 | Convenience | CBO | Anti-HCV | 64 | 1059 | 6.0% | 4.7% | 7.7% |
| Heiligenberg et al.34 | Netherlands | 2007–2008 | Convenience | HIV clinic | Anti-HCV | 27 | 649 | 4.2% | 2.8% | 6.0% |
| Jin et al.35 | Australia | 2005–2007 | Convenience | HIV clinic; hospital | Anti-HCV | 2 | 161 | 1.2% | 0.2% | 4.4% |
| Johns and Gill36 | Canada | 1985–1997 | Consecutive | HIV clinic | Anti-HCV | 10 | 167 | 6.0% | 2.9% | 10.7% |
| Kim et al.37 | U.S. | 1999–2007 | Consecutive | HIV clinic | Anti-HCV | 225 | 1652 | 13.6% | 12.0% | 15.4% |
| Larsen et al.38 | France | 2004 | Convenience | Hospital | Anti-HCV | 17 | 558 | 3.0% | 1.8% | 4.8% |
| Lee et al.39 | Taiwan | 2000–2005 | Consecutive | Hospital | Anti-HCV | 6 | 113 | 5.3% | 2.0% | 1 1.2% |
| Lincoln et al.40 | Australia | 1999–2002 | Consecutive | STI, HIV clinics | Anti-HCV | 158 | 1338 | 1 1.8% | 10.1% | 13.7% |
| Matser et al.41 | Netherlands | 2008–2009 | Not specified | STI clinic | Anti-HCV | 108 | 850 | 12.7% | 10.5% | 15.1% |
| Matser et al.4 | Netherlands | 2008–2009 | Convenience | STI, HIV clinics | Anti-HCV | 91 | 784 | 1 1.6% | 9.5% | 14.1% |
| Mohsen et al.42 | U.K. | 2000–2002 | Convenience | HIV clinic | Anti-HCV | 13 | 375 | 3.5% | 1.9% | 5.9% |
| Nishijima et al.43 | Japan | 2005–2010 | Convenience | HIV clinic | Anti-HCV | 22 | 1068 | 2.1% | 1.3% | 3.1% |
| Orsetti et al.44 | Italy | 1989–2011 | Consecutive | HIV clinic | Anti-HCV | 5 | 80 | 6.3% | 2.1% | 14.0% |
| Palacios et al.45 | Spain | 2006 | Consecutive | Hospital | Anti-HCV | 61 | 725 | 8.4% | 6.5% | 10.7% |
| Price et al.46 | U.K. | 2008 | Convenience | MSM social venues | Anti-HCV | 13 | 168 | 7.7% | 4.2% | 12.9% |
| Puig-Basagoiti et al.47 | Spain | 1993–1997 | Not specified | n/s | Anti-HCV | 6 | 39 | 15.4% | 5.9% | 30.5% |
| Quan et al.48 | Canada | 1990–1992 | Convenience | Health clinic | Anti-HCVRIBA/RNA | 8 | 186 | 4.3% | 1.9% | 8.3% |
| Quaranta et al.49 | France | 1988–1991 | Convenience | HIV and hospital clinics; CBOs | Anti-HCV | 2 | 68 | 2.9% | 0.4% | 10.2% |
| Rauch et al.50 | Switzerland | 2000–2004 | Consecutive | Public health center; HIV and other clinics | Anti-HCV | 108 | 2550 | 4.2% | 3.5% | 5.1% |
| Raymond et al.51 | U.S. | 2004 | Systematic | MSM CBO and social settings | Anti-HCV | 14 | 92 | 15.2% | 8.6% | 24.2% |
| Raymond et al.51 | U.S. | 2008 | Systematic | MSM CBO and social settings | Anti-HCV | 10 | 117 | 8.5% | 4.2% | 15.2% |
| Raymond52 | U.S. | 2011 | Systematic | MSM CBO and social settings | Anti-HCV | 17 | 108 | 15.7% | 9.5% | 24.0% |
| Rivas-Estilla et al.53 | Mexico | 2003–2004 | Convenience | Health clinic; CBO | Anti-HCV, RIBA/RNA | II | 61 | 18.0% | 9.4% | 30.0% |
| Roca et al.54 | Spain | 1997–2002 | Convenience | HIV clinic | Anti-HCV | 59 | 509 | 1 1.6% | 8.9% | 14.7% |
| Sulkowski et al.55 | U.S. | 1995–2001 | Convenience | HIV clinic | Anti-HCV | 100 | 560 | 17.9% | 14.8% | 21.3% |
| Sun et al.56 | Taiwan | 1994–2010 | Not specified | Health clinic | Anti-HCV | 102 | 1576 | 6.5% | 5.3% | 7.8% |
| Tseng et al.57 | Taiwan | 2009–2010 | Convenience | Hospital | Anti-HCV | 24 | 434 | 5.5% | 5.4% | 8.1% |
| Turner et al.58 | U.K. | 1996–2007 | Consecutive | STI clinic; hospital | Anti-HCV | 863 | 12059 | 7.2% | 6.7% | 7.6% |
| Urbanus et al.10 | Netherlands | 2007–2008 | Convenience | STI clinic | Anti-HCV | 28 | 157 | 17.8% | 12.2% | 24.7% |
| Van de Laar et al.59 | Netherlands | 1984–2003 | Convenience | STI clinic; hospital; social venues for MSM | Anti-HCV, RIBA/RNA | 13 | 504 | 2.6% | 1.4% | 4.4% |
| Vogt et al.63 | U.S. | 1989–1993 | Systematic | HIV clinic | Anti-HCV | 45 | 486 | 9.3% | 6.8% | 12.2% |
| Wandeler et al.14 | Switzerland | 1998–2001 | Convenience | HIV clinic | Anti-HCV | 147 | 4629 | 3.2% | 2.7% | 3.7% |
| Zhang et al.62 | China | 2005–2006 | Convenience | Health clinic | Anti-HCV | 3 | 16 | 18.8% | 4.0% | 45.7% |
| Zhao et al.61 | China | 2000–2010 | Convenience | HIV and hospital clinics; CBOs | Anti-HCV | 56 | 230 | 24.3% | 19.0% | 30.4% |
| Zhou et al.60 | Asia, Australia | 2003-2005 | Convenience | HIV and hospital clinics; CBOs | Anti-HCV | 23 | 372 | 6.2% | 4.0% | 9.1% |
| (b). Non IDU | ||||||||||
| Amin et al.25 | Multiple | 1995–1996 | Systematic | n/s | Anti-HCV | 31 | 920 | 3.4% | 2.3% | 4.8% |
| Barfod et al.26 | Denmark | 2006–2009 | Consecutive | HIV clinic | Anti-HCV | 41 | 871 | 4.7% | 3.4% | 6.3% |
| D'Oliveira et al.27 | Greece | 1986–1997 | Consecutive | HIV clinic | Anti-HCV | 81 | 1431 | 5.7% | 4.5% | 7.0% |
| Dimitrakopoulos et al.28 | France | 1992–2002 | Consecutive | Hospital | Anti-HCV | 10 | 123 | 8.1% | 4.0% | 14.4% |
| Edelenyi-Pinto et al.29 | Brazil | 1990–1991 | Convenience | Research study | Anti-HCV | 9 | 113 | 8.0% | 3.7% | 12.6% |
| Garg et al.33 | U.S. | 1997–2009 | Convenience | CBO | Anti-HCV | 49 | 965 | 5.1% | 3.8% | 6.7% |
| Jin et al.35 | Australia | 2005–2007 | Convenience | HIV clinic; hospital | Anti-HCV | 2 | 161 | 1.2% | 0.2% | 442.0% |
| Kim et al.37 | U.S. | 1999–2007 | Consecutive | HIV clinic | Anti-HCV | 162 | 1556 | 10.4% | 8.9% | 12.0% |
| Lee et al.39 | Taiwan | 2000–2005 | Consecutive | Hospital | Anti-HCV | 6 | 113 | 5.3% | 2.0% | 1 1.2% |
| Lincoln et al.40 | Australia | 1999–2002 | Consecutive | STI, HIV clinics | Anti-HCV | 107 | 1236 | 8.7% | 7.1% | 10.4% |
| Matser et al.41 | Netherlands | 2008–2009 | Not specified | STI clinic | Anti-HCV | 108 | 850 | 12.7% | 10.5% | 15.1% |
| Matser et al.41 | Netherlands | 2008–2009 | Convenience | STI, HIV clinics | Anti-HCV | 91 | 784 | 1 1.6% | 9.5% | 14.1% |
| Mohsen et al.42 | U.K. | 2000–2002 | Convenience | HIV clinic | Anti-HCV | 13 | 375 | 3.5% | 1.9% | 5.9% |
| Palacios et al.45 | Spain | 2006 | Consecutive | Hospital | Anti-HCV | 61 | 725 | 8.4% | 6.5% | 10.7% |
| Puig-Basagoiti et al.47 | Spain | 1993–1997 | Not specified | n/s | Anti-HCV | 6 | 39 | 15.4% | 5.9% | 30.5% |
| Quaranta et al.49 | France | 1988–1991 | Convenience | HIV and hospital clinics; CBOs | Anti-HCV | 2 | 68 | 2.9% | 0.4% | 10.2% |
| Rauch et al.50 | Switzerland | 2000–2004 | Consecutive | Public health center; HIV/other clinics | Anti-HCV | 108 | 2550 | 4.2% | 3.5% | 5.1% |
| Raymond et al.51 | U.S. | 2004 | Systematic | MSM CBO and social settings | Anti-HCV | 6 | 69 | 8.7% | 3.3% | 18.0% |
| Raymond et al.51 | U.S. | 2008 | Systematic | MSM CBO and social settings | Anti-HCV | 4 | 82 | 4.9% | 1.3% | 12.0% |
| Raymond et al.52 | U.S. | 2011 | Systematic | MSM CBO community and social settings | Anti-HCV | 9 | 73 | 12.3% | 5.8% | 22.1% |
| Roca et al.54 | Spain | 1997–2002 | Convenience | HIV clinic | Anti-HCV | 59 | 509 | 1 1.6% | 8.9% | 14.7% |
| Sun et al.56 | Taiwan | 1994–2010 | Not specified | Health clinic | Anti-HCV | 102 | 1576 | 6.5% | 5.3% | 7.8% |
| Tseng et al.57 | Taiwan | 2009–2010 | Convenience | Hospital | Anti-HCV | 24 | 434 | 5.5% | 3.6% | 8.1% |
| Urbanus et al.10 | Netherlands | 2007–2008 | Convenience | STI clinic | Anti-HCV | 23 | 143 | 16.1% | 10.5% | 23.2% |
| Van de Laar et al.59 | Netherlands | 1984–2003 | Convenience | STI clinic; hospital; MSM social venues | Anti-HCV, RIBA/RNA | 13 | 504 | 2.6% | 1.4% | 4.4% |
| Vogt et al.63 | U.S. | 1989–1993 | Systematic | HIV clinic | Anti-HCV | 29 | 442 | 6.6% | 4.4% | 9.3% |
| Wandeler et al.14 | Switzerland | 1998–2001 | Convenience | HIV clinic | Anti-HCV | 147 | 4629 | 3.2% | 2.7% | 3.7% |
| Amin et al.25 | Multiple | 1995–1996 | Systematic | n/s | Anti-HCV | 8 | 10 | 80.0% | 44.4% | 97.5% |
| Garg et al.33 | U.S. | 1997–2009 | Convenience | CBO | Anti-HCV | 12 | 21 | 57.1% | 34.0% | 78.2% |
| Jin et al.35 | Australia | 2005–2007 | Convenience | HIV clinic; hospital | Anti-HCV | 16 | 68 | 23.5% | 14.9% | 35.4% |
| Kim et al.37 | U.S. | 1999–2007 | Consecutive | HIV clinic | Anti-HCV | 63 | 96 | 65.6% | 55.2% | 75.0% |
| Lincoln et al.40 | Australia | 1999–2002 | Consecutive | STI and HIV clinics | Anti-HCV | 51 | 102 | 50.0% | 39.9% | 60.1% |
| Mohsen et al.42 | U.K. | 2000–2002 | Convenience | HIV clinic | Anti-HCV | 5 | 9 | 55.6% | 21.2% | 86.3% |
| Raymond et al.51 | U.S. | 2004 | Systematic | MSM CBOs and social settings | Anti-HCV | 8 | 23 | 34.8% | 16.4% | 57.3% |
| Raymond et al.51 | U.S. | 2008 | Systematic | MSM CBOs and social settings | Anti-HCV | 6 | 33 | 18.2% | 7.0% | 35.5% |
| Raymond et al.52 | U.S. | 2011 | Systematic | MSM CBOs and social settings | Anti-HCV | 8 | 35 | 22.9% | 10.4% | 40.1% |
| Sulkowski et al.55 | U.S. | 1995–2001 | Convenience | HIV clinic | Anti-HCV | 100 | 560 | 17.9% | 14.8% | 21.3% |
| Urbanus et al.10 | Netherlands | 2007–2008 | Convenience | STI clinic | Anti-HCV | 5 | 14 | 35.7% | 12.8% | 64.9% |
| Vogt et al.63 | U.S. | 1989–1993 | Systematic | HIV clinic | Anti-HCV | 16 | 44 | 36.4% | 22.4% | 52.2% |
HCV: hepatitis C virus; IDU: injection drug use; MSM: men who have sex with men; CI: confidence interval; CBO: Community-based organization; STI: Sexually transmitted infection.
Reports represented moderate geographic variation; half of reports were from Europe, 23.4% from North America (n=0, 6 from the US), and 16.7%, 4.8%, and 9.5% from Asia, South America, and Australia, respectively. All reports were from high-income countries except for five from upper middle-income countries. Only three of 42 reports used both anti-HCV and viral load to ascertain HCV infection (Table 1(a)).
Prevalence of HCV infection
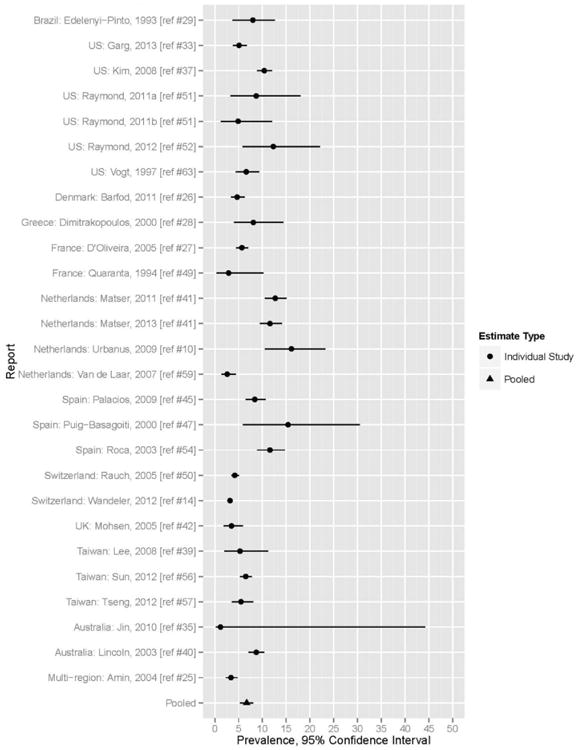
Using a random effects model, pooled HCV prevalence among all 42 included reports (which included known IDU, known non-IDU, and those of unknown IDU status) was 8.2% (95% CI 6.6–9.7%). (Table 2, Figure 2). Significant heterogeneity was present in the overall pooled prevalence estimates (I2=97.3%; Q-statistic=778.4, p < .0001). Among non-IDU HIV+MSM, pooled HCV prevalence was 6.7% (95% CI 5.3–8.1) (Table 2, Figure 3); heterogeneity was shown by a Q statistic of 308.5 (p< .0001) and an I2 value of 94.1%. Among IDU HIV+MSM, pooled HCV prevalence was 40.0% (95% CI 28.0–51.0%) with a range from 17.9% to 80% (Table 2, Figure 4); heterogeneity was present (Q=50.4 [p < .0001] and I2 = 91.2%).
Figure 2.

Forest plot of HCV Prevalence among HIV+MSM overall.
Figure 3.
Forest plot of HCV Prevalence among non-IDU HIV+MSM.
Figure 4.

Forest plot of HCV Prevalence among IDU HIV+MSM.
The overall pooled HCV prevalence for HIV+MSM among US-based reports was 12% (95% CI 8.5–15.4%); the range was 6.0–17.9%. The pooled HCV prevalence among US-based reports for non-IDU HIV+MSM and IDU HIV+MSM was 7.51% (95% CI 5.2–9.9%) and 35.6% (95% CI 21.1–50.1%), respectively.
Moderators of prevalence of HCV infection
Among all HIV+MSM, HCV prevalence in the earliest year of data collection (1988) was 2.9%;49 in 2011, the latest year of data collection, the prevalence of HCV was 15.7%.52 Meta-regression identified a statistically significant increase in HCV prevalence among all HIV+MSM, increasing 0.334% per year (p < .000). A statistically significant increase in HCV prevalence was also observed among non-IDU HIV+MSM among whom prevalence increased by 0.367% per year (p < .000). However, HCV prevalence was shown to decrease among IDU HIV+MSM (−1.44% per year, p < .000).
Geographic variation was not a significant predictor of HCV prevalence among all HIV+MSM (P = 0.390) or any of the subgroups of interest.
Study quality was a statistically significant predictor of HCV prevalence, with consecutive or systematic sampling (vs. convenience sampling) being associated with a higher HCV prevalence (p < .000).
Prevalence of active HCV infection
The estimated range of prevalence of active HCV infection among all HIV+MSM was 5.3%–7.3%. The estimated range of prevalence of active HCV infection among non-IDU HIV+MSM was 4.9%–5.9%. Among IDU HIV+MSM, the estimated range of prevalence of active HCV infection was 26%–35.4%. Minimum and maximum estimated prevalence ranges are presented in Table 2.
Discussion
This SR included 38,986 unique HIV+MSM enrolled in 42 studies. We identified a moderate prevalence of HCV among all HIV+MSM and among non-IDU HIV+MSM; for both groups, the prevalence rate was observed to be increasing slightly. Among IDU HIV+MSM, we observed a high, yet slightly decreasing prevalence of HCV.
The prevalence rates identified among non-IDU HIV+MSM and HIV+MSM were substantially lower than among PWID or IDU HIV+MSM. However, even the lower bound of the pooled prevalence among HIV+MSM in the U.S (8.5%) is higher than that among US residents in the 1945–1965 birth cohort, for whom an identified 3.25% (95% CI 2.80– 3.80%) prevalence has led to recommendations for focused screening.64
Recent evidence suggests a small but statistically significant increase in incidence of HCV among non-IDU HIV+MSM.6 While our data are based on reports of anti-HCV, our finding of a rising prevalence is consistent with the fact that for an infection that remains chronic in the majority of untreated persons, even a stable incidence has the potential to result in a rising prevalence (unless losses [e.g. deaths] outpace new infections).
Our finding of a 40% pooled prevalence of HCV among IDU HIV+MSM was consistent with prevalence rates identified in cohort studies and meta-analyses among PWID generally (43–85%).65,66 The observation that the pooled HCV prevalence was higher among HIV+MSM who have also injected than among those who have not is consistent with the efficiency of HCV transmission by non-sterile injection. It also highlights that MSM who inject may serve as a key bridge population between high-prevalence PWID and HIV+MSM who do not inject but do engage in blood-involved sexual behaviors.
IDU MSM have been recognized as an important bridge population in the trajectory of the HIV epidemic, through the combination of two highly efficient HIV transmission behaviors, and through complex social networks that include non-IDU MSM.67 IDU MSM have constituted a decreasing proportion of new HIV diagnoses in the US (from 8% in 1990 to 3% in 2013), this decrease has occurred in temporal conjunction with a very significant decrease in the prevalence of HIV among PWID during that same time frame.67,68 In contrast, during the same period, there has been only a modest decrease in HCV prevalence among PWID in some settings; our finding of a modest decrease in HCV among IDU HIV+MSM is consistent with these trends.68 Nonetheless, the prevalence of HCV among PWID has remained high during this same time period in many recent estimates.18,65 The 2011 US National Health and Behavior Survey found that 5% of MSM had a history of drug injection.69 Thus, while the overlap between injecting and non-injecting MSM may be small, the high prevalence of HCV among PWID makes this a critical bridge population in the epidemiology of HCV among HIV+MSM, highlighting the need for effective combined prevention addressing both drug use and sexual risks.18,19
The pooled prevalence, the apparent rise in prevalence over time, and the estimated rates of active HCV infection support existing recommendations to screen HIV+MSM for HCV. A recent SR/MA showed that 22% of incident HCV infections in HIV+MSM were attributable to unprotected anal intercourse and 36% were related to non-IDU associated with sex.5 Similarly, several papers identified in the current SR/MA reported on sexual risk behaviors among HIV+MSM, but either did not do so with comparably defined variables or did not present data among HCV prevalent cases both precluding further formal meta-analyses.10,14,41,59
While active HCV infection is generally associated with high blood HCV viral loads, HCV has been detected intermittently in the semen of a minority (but up to 42%) of HCV/HIV co-infected men, albeit with HCV viral loads significantly lower than those found in blood.11,70–74 Unprotected receptive anal intercourse with ejaculation has been associated with new HCV infection in a case-control study with a high odds ratio although without mention of whether there was associated blood exposure.74 The extent to which transmission is attributable to HCV virus in semen or to blood exposure is not entirely clear and requires further study. Consequently, for all HIV+MSM, enhanced sexual risk reduction should include both condom use and avoiding blood exposure during sex as important components of combined HCV prevention.15,75 For HIV+MSM who inject drugs, ensuring access to sterile syringes and to evidence-based drug treatment including methadone and buprenorphine are likely to be important components of efforts to prevent HCV acquisition and transmission including those for HIV+MSM.76,77 Effective strategies to reduce or make safer the use of non-injection drugs associated with high-risk sex are also needed.
Interventions to improve the retention of HCV-infected MSM in the HCV care continuum, including increased engagement in HCV treatment through to sustained viral responses, will be key to improving individual outcomes and reducing community viral load to facilitate control of the epidemic.78 However, a meta-analysis has found pooled re-infection rates following successful HCV treatment to be 11.4 per 100 PYs, suggesting that additional post-treatment interventions to prevent re-infection may be needed.5
Limitations
There are several important limitations to this study. The generalizability and validity of our pooled estimates are dependent on the quality of study-level measurements of the relationship between exposures and prevalent HCV infection. Of note, however, higher quality reports were associated with a higher HCV prevalence. There was some potential for misclassification as to MSM and/or IDU status, and, again, we were limited by the precision in MSM and/or IDU ascertainment in the original studies. As several reports were not explicit with respect to IDU status, we specifically examined prevalence among those reports that clearly distinguished IDU from non-IDU as separate groups. The overall pooled prevalence group includes persons of both known and unknown injection histories and thus this prevalence estimate must be understood as reflecting an undefined proportion of IDU HIV+MSM.
Moderator analysis of calendar time relied on interpolation for some of the estimates, which may have overestimated the precision of observed trends in HCV prevalence over time. However, the observation that HCV prevalence among HIV+MSM has increased over time is congruent with studies reporting an increase in HCV incidence among HIV+MSM.22 Data were not available for many geographic settings, particularly lower middle- or low-income countries, limiting generalizability. Whether the observed lack of apparent geographic variation is due to similarities in prevalent risk behaviors, to bridging between international populations leading to similar rates, or to an artifact due to sampling or lack of representativeness of the countries studied in particular to the paucity of data from low- and middle-income countries is not clear and requires further study.
Our estimates of rates of active infection from anti-HCV data are only as reliable as the estimates of rates of HCV clearance; nonetheless, the approach we took to such estimates used the best available data from a current SR/MA and provides conservative estimates.
Conclusion
While combined prevention has successfully reduced the incidence and prevalence of HIV among PWID in many settings, there has been a lesser degree and less consistent impact of combined prevention on HCV incidence and prevalence among PWID.77,79 It is in this setting that rising incidence and prevalence rates of HCV among HIV+MSM have been observed. Both modeling and experience with public health efforts in various cities and countries to reverse and end high-prevalence HIV and HCV epidemics demonstrate that the higher the baseline prevalence, the greater the public health effort and longer time required to achieve epidemic control, let alone infection elimination.80,81 The finding of a still modest, but relevant and rising, HCV prevalence among HIV+MSM suggests that there is still the opportunity to control HCV among HIV+MSM; this combined with data demonstrating a rising HCV incidence highlights the temporal urgency to do so.5,82
Acknowledgments
Funding: This work is supported by a grant from the National Institutes of Health; National Institute on Drug Abuse [R01 DA034637], and supported by the Center for Drug Use and HIV Research National Institutes of Health [P30 DA011041].
Footnotes
Declaration of conflicting interests: The author(s) declared no potential conflicts of interest with respect to the research, authorship, and/or publication of this article.
References
- 1.Cohen J, Lo YR, Caceres CF, et al. WHO guidelines for HIV/STI prevention and care among MSM and transgender people: implications for policy and practice. Sex Transm Infect. 2013;89:536–538. doi: 10.1136/sextrans-2013-051121. [DOI] [PubMed] [Google Scholar]
- 2.Beyrer C, Baral SD, van Griensven F, et al. HIV in men who have sex with men: global epidemiology of HIV infection in men who have sex with men. Lancet. 2012;380:367–377. doi: 10.1016/S0140-6736(12)60821-6. [DOI] [PMC free article] [PubMed] [Google Scholar]
- 3.Operskalski EA, Kovacs A. HIV/HCV co-infection: pathogenesis, clinical complications, treatment, and new therapeutic technologies. Curr HIV/AIDS Rep. 2011;8:12–22. doi: 10.1007/s11904-010-0071-3. [DOI] [PMC free article] [PubMed] [Google Scholar]
- 4.Ly KN, Xing J, Klevens RM, et al. Causes of death and characteristics of decedents with viral hepatitis, United States, 2010. Clin Infect Dis. 2014;58:40–49. doi: 10.1093/cid/cit642. [DOI] [PMC free article] [PubMed] [Google Scholar]
- 5.Hagan H, Jordan AE, Neurer J, et al. Incidence of sexually transmitted hepatitis C virus infection in HIV-positive MSM: a systematic review and meta-analysis. AIDS. 2015;29:2335–2345. doi: 10.1097/QAD.0000000000000834. [DOI] [PMC free article] [PubMed] [Google Scholar]
- 6.Shoptaw S, Reback CJ. Methamphetamine use and infectious disease-related behaviors in men who have sex with men: implications for interventions. Addiction. 2007;102(Suppl 1):130–135. doi: 10.1111/j.1360-0443.2006.01775.x. [DOI] [PubMed] [Google Scholar]
- 7.Gorbach PM, Murphy R, Weiss RE, et al. Bridging sexual boundaries: men who have sex with men and women in a street-based sample in Los Angeles. J Urban Health. 2009;86(Suppl 1):63–76. doi: 10.1007/s11524-009-9370-7. [DOI] [PMC free article] [PubMed] [Google Scholar]
- 8.Vandelli C, Renzo F, Romano L, et al. Lack of evidence of sexual transmission of hepatitis C among monogamous couples: results of a 10-year prospective follow-up study. AmJ Gastroenterol. 2004;99:855–859. doi: 10.1111/j.1572-0241.2004.04150.x. [DOI] [PubMed] [Google Scholar]
- 9.Van De Laar TJW, Matthews GV, Prins M, et al. Acute hepatitis C in HIV-infected men who have sex with men: an emerging sexually transmitted infection. AIDS. 2010;24:1799–1812. doi: 10.1097/QAD.0b013e32833c11a5. [DOI] [PubMed] [Google Scholar]
- 10.Urbanus AT, van de Laar TJ, Stolte IG, et al. Hepatitis C virus infections among HIV-infected men who have sex with men: an expanding epidemic. AIDS. 2009;23:F1–F7. doi: 10.1097/QAD.0b013e32832e5631. [DOI] [PubMed] [Google Scholar]
- 11.Briat A, Dulioust E, Galimand J, et al. Hepatitis C virus in the semen of men coinfected with HIV-1: prevalence and origin. AIDS. 2005;19:1827–1835. doi: 10.1097/01.aids.0000189847.98569.2d. [DOI] [PubMed] [Google Scholar]
- 12.Danta M, Semmo N, Fabris P, et al. Impact of HIV on host-virus interactions during early hepatitis C virus infection. J Infect Dis. 2008;197:1558–1566. doi: 10.1086/587843. [DOI] [PubMed] [Google Scholar]
- 13.Smith D, Combellick J, Jordan AE, et al. Hepatitis C (HCV) Disease Progression Among People Who Inject Drugs (PWID): A Systematic Review and Meta-analysis of Spontaneous Resolution and Fibrosis Progression. [accessed 25 January 2015]; http://cdn.hepfree.nyc/wp-content/uploads/2014/10/Consortium-Final-Program-with-Cover-2014.pdf?c79a1e.
- 14.Wandeler G, Gsponer T, Bregenzer A, et al. Hepatitis C virus infections in the Swiss HIV cohort study: a rapidly evolving epidemic. Clin Infect Dis. 2012;55:1408–1416. doi: 10.1093/cid/cis694. [DOI] [PubMed] [Google Scholar]
- 15.Schmidt AJ, Rockstroh JK, Vogel M, et al. Trouble with bleeding: risk factors for acute hepatitis C among HIV-positive gay men from Germany – a case-control study. PloS One. 2011;6:e17781. doi: 10.1371/journal.pone.0017781. [DOI] [PMC free article] [PubMed] [Google Scholar]
- 16.Golden MR, Dombrowski JC, Kerani RP, et al. Failure of serosorting to protect African American men who have sex with men from HIV infection. Sexually Trans Dis. 2012;39:659–664. doi: 10.1097/OLQ.0b013e31825727cb. [DOI] [PMC free article] [PubMed] [Google Scholar]
- 17.Apers L, Vanden BW, De Wit S, et al. Risk factors for HCV acquisition among HIV-positive MSM in Belgium. J Acquir Immune Defic Syndr. 2015;68:585–593. doi: 10.1097/QAI.0000000000000528. [DOI] [PubMed] [Google Scholar]
- 18.Jordan AE, Des Jarlais DC, Arasteh K, et al. Incidence and prevalence of hepatitis c virus infection among persons who inject drugs in New York City: 2006–2013. Drug Alcohol Depend. 2015;152:194–200. doi: 10.1016/j.drugalcdep.2015.03.039. [DOI] [PMC free article] [PubMed] [Google Scholar]
- 19.Tsui JI, Evans JL, Lum PJ, et al. Association of opioid agonist therapy with lower incidence of hepatitis C virus infection in young adult injection drug users. JAMA Int Med. 2014;174:1974–1981. doi: 10.1001/jamainternmed.2014.5416. [DOI] [PMC free article] [PubMed] [Google Scholar]
- 20.Moher D, Shamseer L, Clarke M, et al. Preferred reporting items for systematic review and meta-analysis protocols (PRISMA-P) 2015 statement. Syst Rev. 2015;4:1. doi: 10.1186/2046-4053-4-1. [DOI] [PMC free article] [PubMed] [Google Scholar]
- 21.Hagan H, Neurer J, Jordan AE (presenter), et al. Annual conference for the college on problems of drug dependence. San Juan, Puerto Rico: 2014. Hepatitis C virus incidence among HIV+ men who have sex with men (MSM): the role of non-injection drug use. Abstract # 1909100. [Google Scholar]
- 22.Hagan H, Neurer J, Jordan AE, et al. Hepatitis C virus infection among HIV-positive men who have sex with men: protocol for a systematic review and meta-analysis. Syst Rev. 2014;3:31. doi: 10.1186/2046-4053-3-31. [DOI] [PMC free article] [PubMed] [Google Scholar]
- 23.Wells GA, Shea B, O'Connell D, et al. The Newcastle-Ottawa Scale (NOS) for assessing the quality of nonran-domised studies in meta-analyses. [accessed 25 January 2015]; http://www.ohri.ca/programs/clinical_epidemiology/oxford.asp.
- 24.Yaphe S, Bozinoff N, Kyle R, et al. Incidence of acute hepatitis C virus infection among men who have sex with men with and without HIV infection: a systematic review. Sex Trans Infect. 2012;88:558–564. doi: 10.1136/sextrans-2012-050566. [DOI] [PubMed] [Google Scholar]
- 25.Amin J, Kaye M, Skidmore S, et al. HIV and hepatitis C coinfection within the CAESAR study. HIV Med. 2004;5:174–179. doi: 10.1111/j.1468-1293.2004.00207.x. [DOI] [PubMed] [Google Scholar]
- 26.Barfod TS, Omland LH, Katzenstein TL. Incidence and characteristics of sexually transmitted acute hepatitis C virus infection among HIV-positive men who have sex with men in Copenhagen, Denmark during four years (2006–2009): a retrospective cohort study. Scand J Infect Dis. 2011;43:145–148. doi: 10.3109/00365548.2010.524660. [DOI] [PubMed] [Google Scholar]
- 27.D'Oliveira A, Jr, Voirin N, Allard R, et al. Prevalence and sexual risk of hepatitis C virus infection when human immunodeficiency virus was acquired through sexual intercourse among patients of the Lyon University Hospitals, France, 1992–2002. J Viral Hepat. 2005;12:330–332. doi: 10.1111/j.1365-2893.2005.00583.x. [DOI] [PubMed] [Google Scholar]
- 28.Dimitrakopoulos A, Takou A, Haida A, et al. The prevalence of hepatitis B and C in HIV-positive Greek patients: relationship to survival of deceased AIDS patients. J Infect. 2000;40:127–131. doi: 10.1053/jinf.1998.0636. [DOI] [PubMed] [Google Scholar]
- 29.Edelenyi-Pinto M, Carvalho AP, Nogueira C, et al. Prevalence of antibodies to hepatitis C virus in populations at low and high risk for sexually transmitted diseases in Rio de Janeiro. Mem Inst Oswaldo Cruz. 1993;88:305–307. doi: 10.1590/s0074-02761993000200021. [DOI] [PubMed] [Google Scholar]
- 30.Fainboim H, Gonzalez J, Fassio E, et al. Prevalence of hepatitis viruses in an anti-human immunodeficiency virus-positive population from Argentina. A multicentre study. J Viral Hepat. 1999;6:53–57. doi: 10.1046/j.1365-2893.1999.t01-1-6120135.x. [DOI] [PubMed] [Google Scholar]
- 31.Filippini P, Coppola N, Scolastico C, et al. Hepatitis viruses and HIV infection in the Naples area. Infez Med. 2003;11:139–145. [PubMed] [Google Scholar]
- 32.Gamage DG, Read TR, Bradshaw CS, et al. Incidence of hepatitis-C among HIV infected men who have sex with men (MSM) attending a sexual health service: a cohort study. BMC Infect Dis. 2011;11:39. doi: 10.1186/1471-2334-11-39. [DOI] [PMC free article] [PubMed] [Google Scholar]
- 33.Garg S, Taylor LE, Grasso C, et al. Prevalent and incident hepatitis C virus infection among HIV-infected men who have sex with men engaged in primary care in a Boston community health center. Clin Infect Dis. 2013;56:1480–1487. doi: 10.1093/cid/cit054. [DOI] [PMC free article] [PubMed] [Google Scholar]
- 34.Heiligenberg M, Rijnders B, Schim van der Loeff MF, et al. High prevalence of sexually transmitted infections in HIV-infected men during routine outpatient visits in the Netherlands. Sex Trans Dis. 2012;39:8–15. doi: 10.1097/OLQ.0b013e3182354e81. [DOI] [PubMed] [Google Scholar]
- 35.Jin F, Prestage GP, Matthews G, et al. Prevalence, incidence and risk factors for hepatitis C in homosexual men: data from two cohorts of HIV-negative and HIV-positive men in Sydney, Australia. Sex Trans Infect. 2010;86:25–28. doi: 10.1136/sti.2009.038182. [DOI] [PubMed] [Google Scholar]
- 36.Johns DG, Gill MJ. Seroprevalence of cytomegalovirus, toxoplasma gondii, syphilis, and hepatitis B and C virus infections in a regional population seropositive for HIV infection. Can J Infect Dis. 1998;9:209–214. doi: 10.1155/1998/380687. [DOI] [PMC free article] [PubMed] [Google Scholar]
- 37.Kim JH, Psevdos G, Suh J, et al. Co-infection of hepatitis B and hepatitis C virus in human immunodeficiency virus-infected patients in New York City, United States. World J Gastroenterol. 2008;14:6689–6693. doi: 10.3748/wjg.14.6689. [DOI] [PMC free article] [PubMed] [Google Scholar]
- 38.Larsen C, Pialoux G, Salmon D, et al. Prevalence of hepatitis C and hepatitis B infection in the HIV-infected population of France, 2004. Euro Surv. 2008;13(22):1–4. [PubMed] [Google Scholar]
- 39.Lee HC, Ko NY, Lee NY, et al. Seroprevalence of viral hepatitis and sexually transmitted disease among adults with recently diagnosed HIV infection in Southern Taiwan, 2000–2005: upsurge in hepatitis C virus infections among injection drug users. J Formosan Med Assoc. 2008;107:404–411. doi: 10.1016/S0929-6646(08)60106-0. [DOI] [PubMed] [Google Scholar]
- 40.Lincoln D, Petoumenos K, Dore GJ. HIV/HBV and HIV/HCV coinfection, and outcomes following highly active antiretroviral therapy. HIV Med. 2003;4:241–249. doi: 10.1046/j.1468-1293.2003.00152.x. [DOI] [PubMed] [Google Scholar]
- 41.Matser A, Vanhommerig J, Schim van der Loeff MF, et al. HIV-infected men who have sex with men who identify themselves as belonging to subcultures are at increased risk for hepatitis C infection. PLoS One. 2013;8:e57740. doi: 10.1371/journal.pone.0057740. [DOI] [PMC free article] [PubMed] [Google Scholar]
- 42.Mohsen AH, Murad S, Easterbrook PJ. Prevalence of hepatitis C in an ethnically diverse HIV-1-infected cohort in south London. HIV Med. 2005;6:206–215. doi: 10.1111/j.1468-1293.2005.00291.x. [DOI] [PubMed] [Google Scholar]
- 43.Nishijima T, Shimbo T, Komatsu H, et al. Incidence and risk factors for incident Hepatitis C infection among men who have sex with men with HIV-1 infection in a large urban HIV clinic in Tokyo. J Acquir Immune Defic Syndr. 2014;65:213–217. doi: 10.1097/QAI.0000000000000044. [DOI] [PubMed] [Google Scholar]
- 44.Orsetti E, Staffolani S, Gesuita R, et al. Changing characteristics and risk factors of patients with and without incident HCV infection among HIV-infected individuals. Infection. 2013;41:987–990. doi: 10.1007/s15010-013-0465-4. [DOI] [PubMed] [Google Scholar]
- 45.Palacios R, Mata R, Aguilar I, et al. High seroprevalence but low incidence of HCV infection in a cohort of patients with sexually transmitted HIV in Andalusia, Spain. J Int Assoc Physicians AIDS Care. 2009;8:100–105. doi: 10.1177/1545109709331474. [DOI] [PubMed] [Google Scholar]
- 46.Price H, Gilson R, Mercey D, et al. Hepatitis C in men who have sex with men in London – a community survey. HIV Med. 2013;14:578–580. doi: 10.1111/hiv.12050. [DOI] [PMC free article] [PubMed] [Google Scholar]
- 47.Puig-Basagoiti F, Cabana M, Guilera M, et al. Prevalence and route of transmission of infection with a novel DNA virus (TTV), hepatitis C virus, and hepatitis G virus in patients infected with HIV. J Acquir Immune Defic Syndr. 2000;23:89–94. doi: 10.1097/00126334-200001010-00012. [DOI] [PubMed] [Google Scholar]
- 48.Quan CM, Krajden M, Grigoriew GA, et al. Hepatitis C virus infection in patients infected with the human immunodeficiency virus. Clin Infect Dis. 1993;17:117–119. doi: 10.1093/clinids/17.1.117. [DOI] [PubMed] [Google Scholar]
- 49.Quaranta JF, Delaney SR, Alleman S, et al. Prevalence of antibody to hepatitis C virus (HCV) in HIV-1-infected patients (nice SEROCO cohort) J Med Virol. 1994;42:29–32. doi: 10.1002/jmv.1890420106. [DOI] [PubMed] [Google Scholar]
- 50.Rauch A, Rickenbach M, Weber R, et al. Unsafe sex and increased incidence of hepatitis C virus infection among HIV-infected men who have sex with men: the Swiss HIV cohort study. Clin Infect Dis. 2005;41:395–402. doi: 10.1086/431486. [DOI] [PubMed] [Google Scholar]
- 51.Raymond HF, Hughes A, O'Keefe K, et al. Hepatitis C prevalence among HIV-positive MSM in San Francisco: 2004 and 2008. Sex Trans Dis. 2011;38:219–220. doi: 10.1097/OLQ.0b013e3181f68ed4. [DOI] [PubMed] [Google Scholar]
- 52.Raymond HF, Chu P, Nieves-Rivera I, et al. Hepatitis C infection among men who have sex with men, San Francisco, 2011. Sex Trans Dis. 2012;39:985–986. doi: 10.1097/OLQ.0b013e3182716e59. [DOI] [PubMed] [Google Scholar]
- 53.Rivas-Estilla AM, Ramirez-Valles E, Martinez-Hernandez R, et al. Hepatitis C virus infection among HIV-1 infected individuals from northern Mexico. Hepatol Res. 2007;37:311–316. doi: 10.1111/j.1872-034X.2007.00035.x. [DOI] [PubMed] [Google Scholar]
- 54.Roca B, Suarez I, Gonzalez J, et al. Hepatitis C virus and human immunodeficiency virus coinfection in Spain. J Infect. 2003;47:117–124. doi: 10.1016/s0163-4453(03)00067-7. [DOI] [PubMed] [Google Scholar]
- 55.Sulkowski MS, Moore RD, Mehta SH, et al. Hepatitis C and progression of HIV disease. JAMA. 2002;288:199–206. doi: 10.1001/jama.288.2.199. [DOI] [PubMed] [Google Scholar]
- 56.Sun HY, Chang SY, Yang ZY, et al. Recent hepatitis C virus infections in HIV-infected patients in Taiwan: incidence and risk factors. J Clin Microbiol. 2012;50:781–787. doi: 10.1128/JCM.06014-11. [DOI] [PMC free article] [PubMed] [Google Scholar]
- 57.Tseng YT, Sun HY, Chang SY, et al. Seroprevalence of hepatitis virus infection in men who have sex with men aged 18-40 years in Taiwan. J Formosan Med Assoc. 2012;111:431–438. doi: 10.1016/j.jfma.2011.06.022. [DOI] [PubMed] [Google Scholar]
- 58.Turner J, Bansi L, Gilson R, et al. The prevalence of hepatitis C virus (HCV) infection in HIV-positive individuals in the UK – trends in HCV testing and the impact of HCV on HIV treatment outcomes. J Viral Hep. 2010;17:569–577. doi: 10.1111/j.1365-2893.2009.01215.x. [DOI] [PubMed] [Google Scholar]
- 59.van de Laar TJ, van der Bij AK, Prins M, et al. Increase in HCV incidence among men who have sex with men in Amsterdam most likely caused by sexual transmission. J Infect Dis. 2007;196:230–238. doi: 10.1086/518796. [DOI] [PubMed] [Google Scholar]
- 60.Zhou J, Dore GJ, Zhang F, et al. Hepatitis B and C virus coinfection in The TREAT Asia HIV observational database. J Gastroenterol Hepatol. 2007;22:1510–1518. doi: 10.1111/j.1440-1746.2007.05062.x. [DOI] [PubMed] [Google Scholar]
- 61.Zhao YS, Su SI, Lv CX, et al. Seroprevalence of hepatitis C, hepatitis B virus and syphilis in HIV-1 infected patients in Shandong, China. Int J STD AIDS. 2012;23:639–643. doi: 10.1258/ijsa.2012.011411. [DOI] [PubMed] [Google Scholar]
- 62.Zhang X, Wang C, Hengwei W, et al. Risk factors of HIV infection and prevalence of co-infections among men who have sex with men in Beijing, China. AIDS. 2007;21(Suppl 8):S53–S57. doi: 10.1097/01.aids.0000304697.39637.4c. [DOI] [PubMed] [Google Scholar]
- 63.Vogt RL, Richmond-Crum S, Diwan A. Hepatitis C virus infection in a human immunodeficiency virus-positive cohort in Hawaii. J Infect Dis. 1997;176:542–543. doi: 10.1086/517287. [DOI] [PubMed] [Google Scholar]
- 64.Smith BD, Beckett GA, Yartel A, et al. Previous exposure to HCV among persons born during 1945–1965: prevalence and predictors, United States, 1999–2008. Am J Pub Health. 2014;104:474–481. doi: 10.2105/AJPH.2013.301549. [DOI] [PMC free article] [PubMed] [Google Scholar]
- 65.Nelson PK, Mathers BM, Cowie B, et al. Global epidemiology of hepatitis B and hepatitis C in people who inject drugs: results of systematic reviews. Lancet. 2011;378:571–583. doi: 10.1016/S0140-6736(11)61097-0. [DOI] [PMC free article] [PubMed] [Google Scholar]
- 66.Lansky A, Finlayson T, Johnson C, et al. Estimating the number of persons who inject drugs in the united states by meta-analysis to calculate national rates of HIV and hepatitis C virus infections. PLoS One. 2014;9:e97596. doi: 10.1371/journal.pone.0097596. [DOI] [PMC free article] [PubMed] [Google Scholar]
- 67.Centers for Disease Control Prevention. HIV surveillance report: diagnoses of HIV infection and AIDS in the United States and dependent areas, 2012. [Google Scholar]
- 68.Des JDC, Perlis T, Arasteh K, et al. Reductions in hepatitis C virus and HIV infections among injecting drug users in New York City, 1990–2001. AIDS. 2005;19:S20–S5. doi: 10.1097/01.aids.0000192066.86410.8c. [DOI] [PubMed] [Google Scholar]
- 69.Centers for Disease Control Prevention. HIV testing among men who have sex with men – 21 cities, United States, 2008. MMWR. 2011;60:694–699. [PubMed] [Google Scholar]
- 70.Nyamathi A, Robbins WA, Fahey JL, et al. Presence and predictors of hepatitis C virus RNA in the semen of homeless men. Biol Res Nurs. 2002;4:22–30. doi: 10.1177/1099800402004001004. [DOI] [PubMed] [Google Scholar]
- 71.Pasquier C, Bujan L, Daudin M, et al. Intermittent detection of hepatitis C virus (HCV) in semen from men with human immunodeficiency virus type 1 (HIV-1) and HCV. J Med Virol. 2003;69:344–349. doi: 10.1002/jmv.10295. [DOI] [PubMed] [Google Scholar]
- 72.Pekler VA, Robbins WA, Nyamathi A, et al. Use of ver-sant TMA and bDNA 3.0 assays to detect and quantify hepatitis C virus in semen. J Clin Lab Anal. 2003;17:264–270. doi: 10.1002/jcla.10107. [DOI] [PMC free article] [PubMed] [Google Scholar]
- 73.Leruez-Ville M, Kunstmann JM, De Almeida M, et al. Detection of hepatitis C virus in the semen of infected men. Lancet. 2000;356:42–43. doi: 10.1016/S0140-6736(00)02435-1. [DOI] [PubMed] [Google Scholar]
- 74.Centers for Disease Control Prevention. Sexual transmission of hepatitis C virus among HIV-infected men who have sex with men – New York city, 2005–2010. MMWR. 2011;60:945–950. [PubMed] [Google Scholar]
- 75.Taylor LE, DeLong AK, Maynard MA, et al. Acute hepatitis C virus in an HIV clinic: a screening strategy, risk factors, and perception of risk. AIDS Patient Care STDs. 2011;25:571–577. doi: 10.1089/apc.2011.0106. [DOI] [PMC free article] [PubMed] [Google Scholar]
- 76.Perlman DC, Jordan AE, Uuskula A, et al. An international perspective on using opioid substitution treatment to improve hepatitis C prevention and care for people who inject drugs: structural barriers and public health potential. Int J Drug Policy. 2015;26:1056–1063. doi: 10.1016/j.drugpo.2015.04.015. [DOI] [PMC free article] [PubMed] [Google Scholar]
- 77.Martin NK, Hickman M, Hutchinson SJ, et al. Combination interventions to prevent HCV transmission among people who inject drugs: modeling the impact of antiviral treatment, needle and syringe programs, and opiate substitution therapy. Clin Infect Dis. 2013;57(Suppl 2):S39–S45. doi: 10.1093/cid/cit296. [DOI] [PMC free article] [PubMed] [Google Scholar]
- 78.Frye V, Latka MH, Koblin B, et al. The urban environment and sexual risk behavior among men who have sex with men. J Urban Health. 2006;83:308–324. doi: 10.1007/s11524-006-9033-x. [DOI] [PMC free article] [PubMed] [Google Scholar]
- 79.Hagan H, Pouget ER, Des Jarlais DC. A systematic review and meta-analysis of interventions to prevent hepatitis C virus infection in people who inject drugs. J Infect Dis. 2011;204:74–83. doi: 10.1093/infdis/jir196. [DOI] [PMC free article] [PubMed] [Google Scholar]
- 80.Perlman DC, Des Jarlais DC, et al. Can HIV and HCV infection be eliminated among persons who inject drugs? J Addict Dis. 2015;34:198–205. doi: 10.1080/10550887.2015.1059111. [DOI] [PMC free article] [PubMed] [Google Scholar]
- 81.Martin NK, Vickerman P, Foster GR, et al. Can antiviral therapy for hepatitis C reduce the prevalence of HCV among injecting drug user populations? A modeling analysis of its prevention utility. J Hepatol. 2011;54:1137–1144. doi: 10.1016/j.jhep.2010.08.029. [DOI] [PubMed] [Google Scholar]
- 82.Vanhommerig JW, Stolte IG, Lambers FA, et al. Stabilizing incidence of hepatitis C virus infection among men who have sex with men in Amsterdam. J Acquir Immune Defic Syndr. 2014;66:e111–e115. doi: 10.1097/QAI.0000000000000208. [DOI] [PubMed] [Google Scholar]