Abstract
Informative gene selection can have important implications for the improvement of cancer diagnosis and the identification of new drug targets. Individual-gene-ranking methods ignore interactions between genes. Furthermore, popular pair-wise gene evaluation methods, e.g. TSP and TSG, are helpless for discovering pair-wise interactions. Several efforts to discover pair-wise synergy have been made based on the information approach, such as EMBP and FeatKNN. However, the methods which are employed to estimate mutual information, e.g. binarization, histogram-based and KNN estimators, depend on known data or domain characteristics. Recently, Reshef et al. proposed a novel maximal information coefficient (MIC) measure to capture a wide range of associations between two variables that has the property of generality. An extension from MIC(X; Y) to MIC(X1; X2; Y) is therefore desired. We developed an approximation algorithm for estimating MIC(X1; X2; Y) where Y is a discrete variable. MIC(X1; X2; Y) is employed to detect pair-wise synergy in simulation and cancer microarray data. The results indicate that MIC(X1; X2; Y) also has the property of generality. It can discover synergic genes that are undetectable by reference feature selection methods such as MIC(X; Y) and TSG. Synergic genes can distinguish different phenotypes. Finally, the biological relevance of these synergic genes is validated with GO annotation and OUgene database.
Cancer tissue sample microarray expression data typically possess a common property—the number of samples is much smaller than the number of features—here those features are genes1. Informative gene selection has important implications for the improvement of cancer diagnosis, the selection of targeted therapeutics, and the identification of new drug targets2,3. Individual-gene-ranking methods, such as the t test for binary class differentiation4 and the F test for multi-class differentiation rank genes by comparing the expression values of the same individual gene between different classes. Although these individual-gene methods may discover individual effect genes efficiently, they may have ignored interactions (i.e., redundancy and synergy) between genes4,5,6. The interactions between genes are critical in pathway dysregulations which trigger carcinogenesis7. Table 1 illustrates an example case of synergy between Gene X1 and Gene X2: 1) Knowledge regarding the state of only one of these two variables leaves the state of Y uncertain. 2) When states of both X1 and X2 are known, then the state of Y becomes certain.
Table 1. A typical pair-wise synergy between X1 and X2.
| Y | X1 | X2 | X1 ⊕ X2 |
|---|---|---|---|
| − | 1 | 1 | 0 |
| − | 0 | 0 | 0 |
| + | 1 | 0 | 1 |
| + | 0 | 1 | 1 |
⊕ is an exclusive-or operation.
Pair-wise gene evaluation has been implemented in several popular algorithms, including top scoring pair (TSP)8,9, top scoring genes (TSG)2, and doublets (sum, diff, mul and sign)7, which all compare expression values of the same sample between two different genes. However, these methods are incapable of discovering pair-wise interactions efficiently. For example, let X1 and X2 be two independent random variables; Y equals |X1–X2| and is binarized with a median (Fig. 1). Then, the Δ-score for TSP is 0.04, the χ2-score for TSG is 0.18, and the t-score is 0.04, 0.18, 3.42, and 0.56 for sum, diff, mul, and sign, respectively. The synergic pairs, X1 and X2, cannot be highlighted with these low scores calculated by these methods.
Figure 1. Synergic pairs conducted by function.
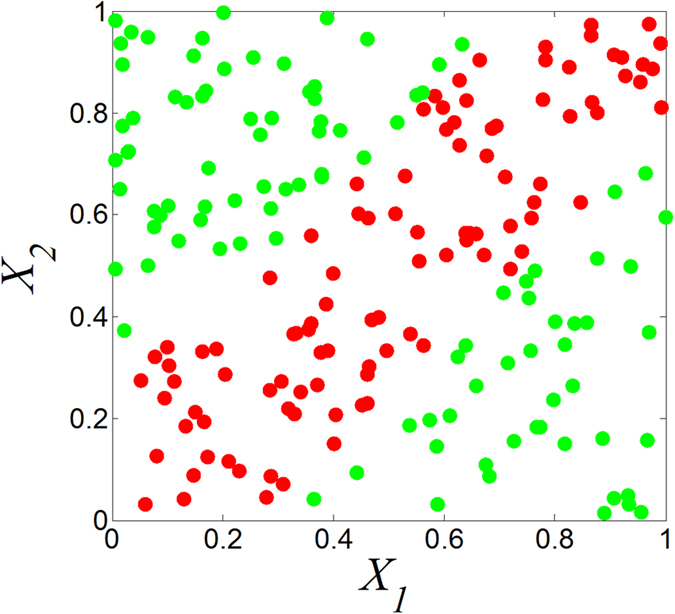
Y = |X1 – X2|(n = 200). Y is binarized with a median. Red point: positive sample. Green point: negative sample.
Based on information theory, the measure of I(X1; X2; Y)10,11 can be used to identify pair-wise interactions12,13,14. The interaction of a gene pair with respect to cancer is defined as
 |
Where I is the symbol for mutual information (MI), X1 and X2 are random variables representing the expression levels of the two genes and Y is a binary random variable representing the presence or absence of cancer15. A positive value of I(X1; X2; Y) indicates synergistic interactions, while a negative value of I(X1; X2; Y) indicates redundant interactions.
Several efforts have recently been made to discover pair-wise synergy even multivariate synergy among interacting genes on experimental biological data. The Anastassiou group proposed a systems-based approach called Entropy Minimization and Boolean Parsimony (EMBP) to identify modules of genes that are jointly associated with a phenotype from gene expression data15 and SNP data16. Anastassiou11 emphasized the significance of multivariate analysis such as EMBP for molecular systems biology and clarified the fundamental concepts by explaining the precise physical meaning. Watkinson et al.17 presented a novel dendrogram-based technique to identify synergies of pairwise genes. Hanczar et al.18 devised a histogram-based method called FeatKNN to detect the joint effect I(X1, X2; Y). Park et al.19 proposed a new approach for inferring combinatorial Boolean rules of gene sets for cancer classification by using a synergy network. Shiraishi et al.20 presented a rank-based non-parametric statistical test for measuring synergistic combinations between two gene sets. Ignac et al.21 used interaction distances (ID) to identify the most synergic pairs of markers such as SNPs.
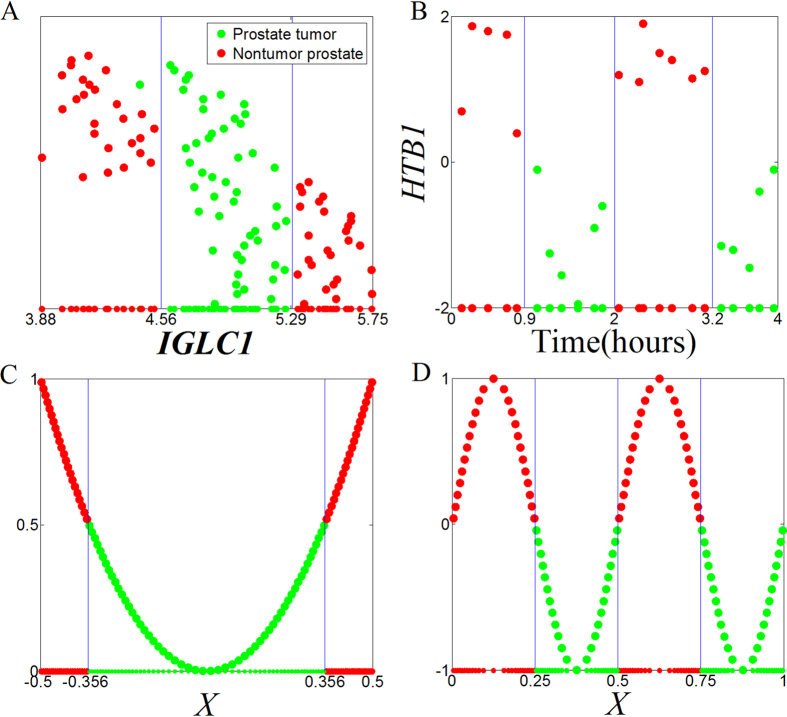
Binarization of continuous expression data simplifies the estimation of MI and provides simple logical functions connecting the genes within the found modules2,15. However, there are multitype complicated patterns in both real-world data (Fig. 2A,B) and simulation data (Fig. 2C,D); binarization might lead to loss of information11,21. For example, the IGLC1 gene for the prostate dataset must be trinarized, rather than binarized (Fig. 2C). Several methods have been proposed for the MI estimation, such as kernel density estimation22, histogram-based technique23, k-nearest-neighbor estimator24, B-spline functions25, Edgeworth26, adaptive partitioning27,28 and dendrogram-based method17. Khan et al.29 evaluated the relative performance of several MI estimation methods, and suggested that the most suitable estimation procedure would depend on known data or domain characteristics and exploratory data analysis. Recently, Reshef et al.30 presented a novel estimator for two variables called maximal information coefficient (MIC). MIC explores various binning strategies with different numbers of bins, and can capture a wide range of associations, both functional and non-functional, regardless of linear or non-linear relationships. Due to its generality, MIC is becoming widely accepted in scientific research fields31. Therefore, there is a large demand for extending MIC from two variables to three variables, even multivariate, to capture a wide range of synergistic interactions32.
Figure 2. Examples of scatter plots of discretization for gene expression.
(A,B) are real-word gene expression values for prostate dataset74 and yeast dataset75; the values of HTB1 gene are binarized with 0. C and D are simulation datasets from Y = 4·X2 and Y = sin (4·π·X), Y is binarized with 0.5 and 0, respectively. Red point: positive sample. Green point: negative sample.
In this paper, we first developed and described an algorithm to compute MIC(X1; X2; Y). We demonstrated the generality of MIC(X1; X2; Y) with simulation data. We identified the most synergic pairs of genes (not discovered by popular feature selection approaches) using MIC(X1; X2; Y) with several real-world, cancer gene expression profile datasets. Finally, we validated these synergic genes using classification performance, Gene Ontology annotation (GO), and the OUgene database33.
Calculation of MIC(X 1; X 2; Y) where Y is a discrete variable
Preliminary
Given a finite set Dn × 3 = {(x1, x2, y)| x1 ∈ X1, x2 ∈ X2, y ∈ Y}, where n is the sample size, X1 and X2 are two continuous independent variables, Y is the discrete dependent variable Y = {class1, class2,..., classP}, and P is the number of classes, we can partition X1, X2, and Y into x1 bins, x2 bins, and y bins, respectively. Here, y is fixed as P, because Y is a discrete variable. We denote such a partition x1-by-x2-by-y as grid G, and the distribution of the data points in D on the cells of G as D|G.
Definition 1 For a finite set  and positive integers x1, x2, y, define
 |
where the maximum is over all grids G with x1-by-x2-by-y, and I(D|G) is the interaction defined in formula (1).
Definition 2 The characteristic matrix M(D) of a set D of three-variable data is an infinite matrix with entries
 |
Definitions 3 The maximal interaction coefficient MIC(X1; X2; Y) of a set D of three-variable data with sample size n and grid size less than B(n) is defined as
 |
In this paper a equals 0.6, the default setting suggested by Reshef et al.30.
The maximal grid size B(n) and normalization of MIC(X 1; X 2; Y)
Formula (1) can be rewritten as
 |
 |
Here I(X2, Y|X1) and I(X1, Y|X2)are conditional mutual information.
According to formula (5) and knowing that the X1, x1-axis partition is fixed, i.e. that X1 is equipartitioned with x1 bins, the set D of three-variable data with sample size n can be subdivided into x1 subsets, and each subset has only two-variable (X2 and Y) and n/x1 samples. The mutual information for each subset can be normalized with log(min{x2, y}) and the maximal grid size B(n) for each subset should be (n/x1)a. Therefore, for set D, while the x1-axis partition is fixed, the normalization benchmark and B(n) are log (min{x2, y}) and (n/x1)a, respectively.
Similarly, for set D where the x2-axis partition is fixed, the normalization benchmark and B(n) are log (min{x1, y}) and (n/x2)a, respectively.
Approximation algorithm for MIC(X 1; X 2; Y)
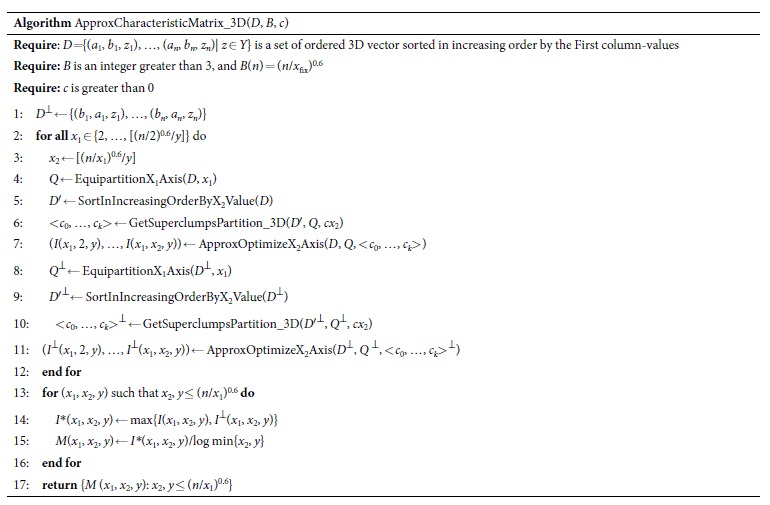
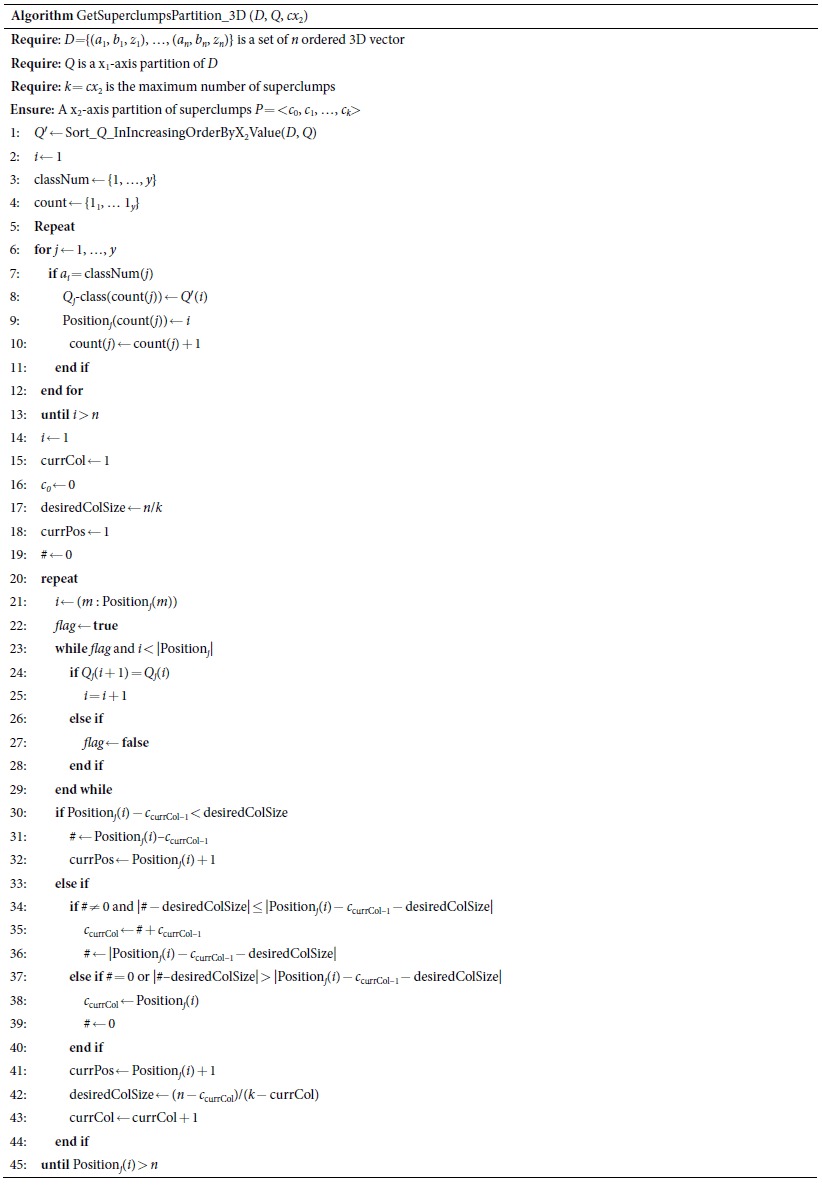
Here, we describe the heuristic algorithm, ApproxCharateristicMatrix_3D, for approximating the optimal MIC(X1; X2; Y). It includes four sub-algorithms: EquipartitionX1Axis, SortInIncreasingOrderByX2Value, GetSuperclumpsPartition_3D, and ApproxOptimizeX2Axis. In the dataset D, the first and second columns represent X1 and X2 respectively; the last column represents Y. n is the sample size. B defines the maximal grid size. The symbol “⊥” represents the dataset which is changed from (a1, b1, z1) to (b1, a1, z1). c represents the candidate partition point for x-axis. “log” is base-2 logarithm. xfix, representing the corresponding x-axis partition, is fixed (xfix ∈ {x1, x2}). The symbol “ ← ” is an assignment operator.
 |
 |
 |
EquipartitionX1Axis, SortInIncreasingOrderByX2Value and ApproxOptimizeX2Axis are nearly the same as EquipartitionYAxis, SortInIncreasingOrderByXValue, and ApproxOptimizeXAxis in Reshef et al.30, respectively, except that ApproxOptimizeX2Axis uses I(X1; X2; Y) in place of I(X; Y). Here we demonstrate an example of a superclumps partition (see Fig. 3) and list only the pseudo-code of GetSuperclumpsPartition_3D, which is our core algorithm for calculating interactions. The algorithm includes three steps: 1) divide the data into P parts according to Y; 2) fix an equipartition of size x1 on x1-axis; and 3) ensure points in the same superclump to be a unit in the same class, with the rank of x2-axis.
Figure 3. Schematic of getting superclumps partition for three variables.
The points with the same color belong to the same superclump.
Results
Generality of MIC(X 1; X 2; Y) according to simulation analysis
If X1 and X2 are statistically independent of Y, MIC(X1; X2; Y) should be close to 0. For example, let X and Y be two independent, random variables and Y is binarized with a median (sample size n = 200 and 500 replicates), then MIC(X; Y) = 0.1702 ± 0.0292. Similarly, let X1, X2 and Y be three independent, random variables, then MIC(X1; X2; Y) = 0.1562 ± 0.0230. MIC(X1; X2; Y) is reasonable in scope compared with MIC(X; Y), and decreases as the sample size grows (0.0596 ± 0.0012, n = 20000) and finally converges to 0.
If the state of Y is completely determined by the synergy between X1 and X2, then MIC(X1; X2; Y) should be 1, and MIC(X; Y) should be close to 0. As shown in Fig. 4, MIC(X1; X2; Y) = 1, MIC(X1;Y) = 0.0379 and MIC(X2; Y) = 0.0533. If Y is a noiseless function of X1 and X2, and X1 is fully redundant of X2, then MIC(X1; X2; Y) should be −1. For example,  and X1 = X2, MIC(X1; X2; Y) = −1, MIC(X1;Y) = 1 and MIC(X2;Y) = 1.
Figure 4. Y completely determined by the synergy between X1 and X2.
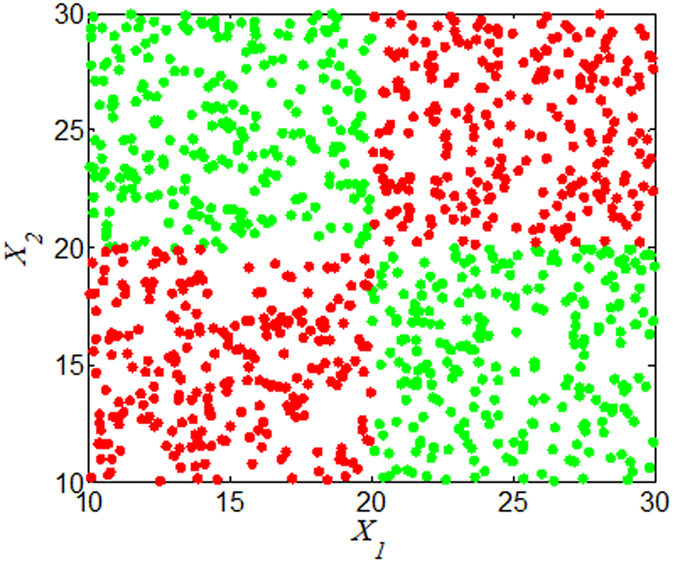
X1 and X2∈[10, 30],  and
and result from binarization vector of X1 and X2, respectively. Y =
  (n = 1000). Green and red dots represent Y = 1 and Y = 0, respectively.
If Y is a noiseless function of X1 and X2, then the joint effect, i.e., the sum of MIC(X1; X2; Y), MIC(X1; Y) and MIC(X2; Y), should be 1. Scores of the three components and the joint effect for 10 noiseless functions (Fig. 5) are listed in Table 2. All of the joint effects are close to 1 (0.9672~1.1675). This indicates that the value of MIC(X1; X2; Y) calculated with ApproxCharateristicMatrix_3D is credible, while the value of MIC(X; Y) calculated with ApproxMaxMI30 has been widely accepted. From all of the above, we deduce that MIC(X1; X2; Y) can capture a wide range of interactions, not limited to specific function types. That is, MIC(X1; X2; Y) has the property of generality.
Figure 5. Ten noiseless functions with Y = f (X1, X2).
Y is binarized with median, green and red dots represent Y=1 and Y=0, respectively.
Table 2. Mean scores of the three components and the joint effect for 10 noiseless functions (n = 1000, 1000 replicates).
| Function | Domain of X1 | Domain of X2 | Y = f(X1, X2) | MIC(X1; X2; Y) | MIC(X1; Y) | MIC(X2; Y) | Joint effect |
|---|---|---|---|---|---|---|---|
| A | [0, 1] | [0, 1] | x1+x2 | 0.3667 | 0.3817 | 0.3798 | 1.1283 |
| B | [0, 1] | [0, 1] | x1−x2 | 0.3793 | 0.3824 | 0.3663 | 1.1280 |
| C | [0, 1] | [0, 1] | ABS(x1−x2) | 0.8222 | 0.1287 | 0.1281 | 1.0790 |
| D | [0, 1] | [0, 1] | x1×x2 | 0.3215 | 0.4134 | 0.4144 | 1.1493 |
| E | [0, 1] | [0, 1] | x1/x2 | 0.3835 | 0.3804 | 0.3653 | 1.1292 |
| F | [5, 23.3] | [5, 23.3] | 10x1+10x2 | 0.2390 | 0.4657 | 0.4628 | 1.1675 |
| G | [0, 1] | [0, 1] | ABS(1000x1−1000x2) | 0.4555 | 0.3386 | 0.3381 | 1.1322 |
| H | [0, 1] | [0, 1] | ABS(ABS(x1−0.5)−ABS(x2−0.5)) | 0.7080 | 0.1295 | 0.1298 | 0.9672 |
| I | [0, 3.13] | [1.5, 4.75] | LOG2(ABS(SIN(x1)−COS(x2))) | 0.2853 | 0.3824 | 0.4274 | 1.0950 |
| J | [0, 3] | [0, 3] | SIN(x1)−SIN(x2) | 0.3044 | 0.3848 | 0.3832 | 1.0723 |
Informative genes of synergy pairs discovered by MIC(X 1; X 2; Y)
We employ MIC(X1; X2; Y) to detect pair-wise synergic genes in three real-world datasets. The literature resources, sample size, number of genes, and the number samples of each class in each dataset are summarized in Table 3.
Table 3. Three binary-class gene expression datasets.
Four popular gene selection methods, including MIC(X; Y), minimum-redundancy maximum-relevancy (mRMR)34, support vector machine recursive feature elimination (SVM-RFE)35,36 and TSG2, are chosen to compare with MIC(X1; X2; Y). The MIC(X; Y) estimator (setting a = 0.6 and c = 5) of Reshef et al.30 is available at http://www.exploredata.net/, MIQ-MRMR is available at http://home.penglab.com/, and an R Package implementation of SVM-RFE is available at http://www.uccor.edu.ar/paginas/seminarios/software/SVM-RFE.zip. The TSG algorithm from our previous report2 is available upon request.
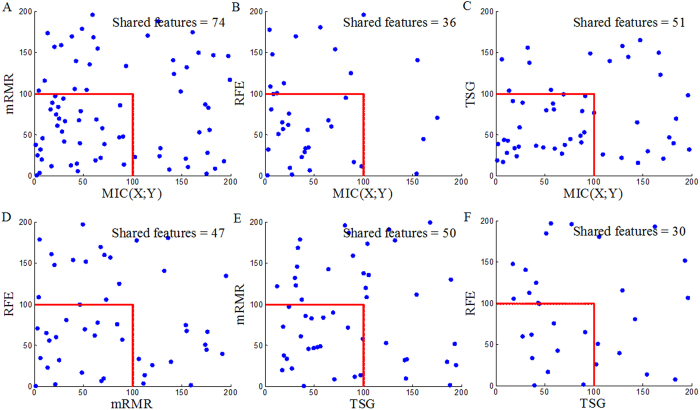
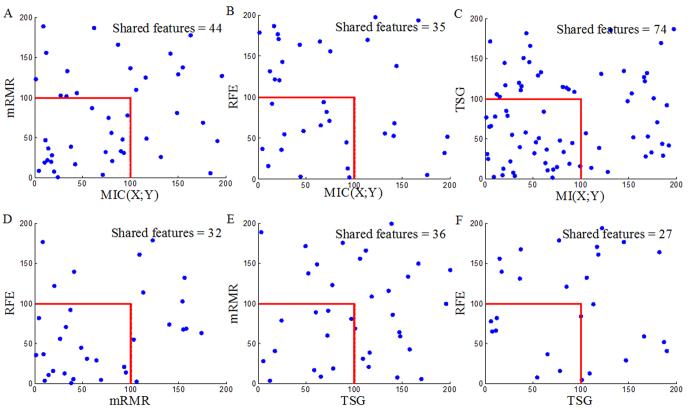
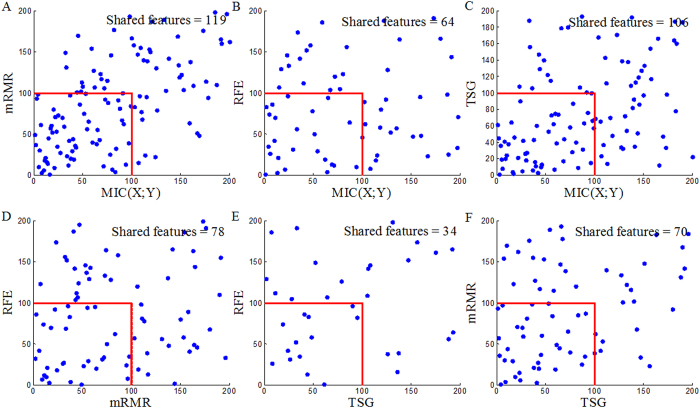
Each reference method ranks the top 200 genes (Top200s) for each dataset (Top200s are shown in the Supplementary Material Table S1-S3). The Top200s identified by different reference methods are compared with each other. We can observe significant overlaps between the Top 200s selected by the four reference methods, as shown in Figs 6, 7 and 8. This indicates that a considerable number of similar informative genes can be detected by these reference methods. MIC(X; Y) is an individual-gene-filter method and can only highlight genes that are individually discriminant. Although mRMR, SVM-RFE and TSG are not individual-gene-filter methods; the Top200s selected by them have considerable similarities to the Top200s selected by MIC(X; Y). This indicates that these methods can efficiently discover genes that are individually discriminant, but not specific to the genes have pair-wise synergy effects.
Figure 6. Overlaps among the Top200s selected by MIC(X; Y), MRMR, SVM-RFE and TSG in the Prostate dataset.
Figure 7. Overlaps among the Top200s selected by MIC(X; Y), MRMR, SVM-RFE and TSG in the DLBCL dataset.
Figure 8. Overlaps among the Top200s selected by MIC(X; Y), MRMR, SVM-RFE and TSG in the Lung dataset.
Now, we employ MIC(X1; X2; Y) to detect pair-wise synergic genes. MIC(X1; X2; Y) ranks the top 117, 117 and 110 pair-wise genes for Prostate, DLBCL and Lung1, respectively. After removing repeated genes, we obtain three Top200s (Top200s are shown in the Supplementary Material Table S1–S3). We compare our MIC(X1; X2; Y) results with the results from four above mentioned reference selection methods. Clearly, the Top200s selected by MIC(X1; X2; Y) has little overlap with the Top200s selected by the others (Figs 9, 10 and 11). We, therefore, deduce that MIC(X1; X2; Y) can discover new synergic genes and that the other four reference feature selection methods can only discover genes that are individually discriminant.
Figure 9. Overlaps between the Top200 selected by MIC(X1; X2; Y) and the Top200s selected by MIC(X; Y), MRMR, SVM-RFE and TSG in the Prostate dataset.
Figure 10. Overlaps between the Top200 selected by MIC(X1; X2; Y) and the Top200s selected by MIC(X; Y), MRMR, SVM-RFE and TSG in the DLBCL dataset.
Figure 11. Overlaps between the Top200 selected by MIC(X1; X2; Y) and the Top200s selected by MIC(X; Y), MRMR, SVM-RFE and TSG in the Lung dataset.
Synergic gene justification
We initially validate these synergic genes according to their prediction performance with a supported vector classifier (SVC). SVC is available at http://prtools.org/ software/. Fig. 12, illustrates the 10-fold cross-validation prediction accuracies using genes from Top1 to the Top200 selected by MIC(X1; X2; Y), as well as by MIC(X; Y), MRMR, SVM-RFE and TSG. MIC(X1; X2; Y) receives comparable accuracies. This indicates that these synergic genes have sufficient ability to distinguish tissue and cancer types, from the perspective of machine learning.
Figure 12. Prediction accuracy of five feature selection methods combined with SVC Classifier over three datasets.
Do the synergic genes selected by MIC(X1; X2; Y) have any biological relevance to tissue or cancer type? This is particularly relevant considering that even a random set of genes may be a good predictor of cancer sample definition37. Therefore, we further validated these synergic genes, using the Prostate dataset as an example, according to GO annotation and OUgene database.
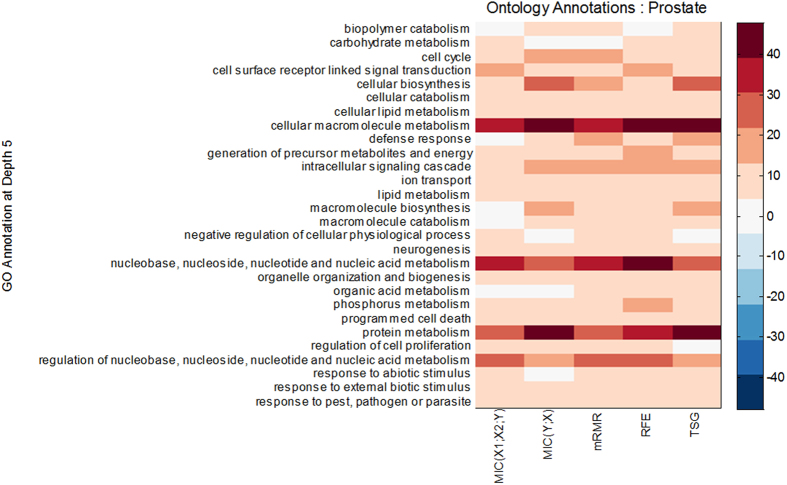
We used the GATHER system38 (http://gather.genome.duke.edu/) to query GO annotations associated with the Top200s selected by the five methods, as shown in Fig. 13. Although there is little overlap between the genes selected by MIC(X1; X2; Y) and the genes selected by the four reference methods (Figs 9, 10 and 11), synergic genes share the same four heavily marked terms with genes that are individually discriminant (Fig. 13). These four heavily marked GO terms are “cellular macromolecule metabolism,” “nucleobase, nucleoside, nucleotide and nucleic acid metabolism,” “protein metabolism,” and “regulation of nucleobase, nucleoside, nucleotide and nucleic acid metabolism”.
Figure 13. GO annotations for the Top200s selected by different methods in the Prostate dataset.
Deeper colors of one point in the figure means the terms covered with more genes. We have removed the terms in which the sum of genes number is less than 25 across all methods.
The current version of OUgene, a disease associated, over-expressed and under-expressed gene database, includes 7,238 gene entries, 1,480 diseases entries, and 56,442 PubMed links. We ranked the Top200 synergic genes out of the 12,600 genes in the Prostate dataset using MIC(X1; X2; Y). Of these Top200, 67 tumorigenesis genes were queried against OUgene, and 18 of them have been reported related to prostate cancer39,40,41,42,43,44,45,46,47,48,49,50,51,52,53,54,55,56 (Table 4).
Table 4. The 67 cancer related genes out of the Top200 selected by MIC(X1; X2; Y) in the Prostate dataset.
| Genes | Related tumors |
|---|---|
| ABCB1, AMACR, CAV1, CCND1, CSF2, DPT, E2F3, ETV4, GOT2, GREB1, HBP1, HCLS1, HMGA1, PAX2, SFRP1, SOX9, TRAF4, ZNF143 | Prostate |
| ABCA4, CASC3, CD81, COMP, MAP1LC3B, PPP3CA, SLN, TFAP2C, TRO | Breast cancer |
| DSC2, EDG4, FBLN1, GALNT3, KRT10, NDN | Ovarian carcinomas |
| CTSE, DNAJA1, LY6E | Pancreatic cancer |
| NR2F6, TERF2, TPP1 | Colorectal cancer |
| PCBP2, RAF1 | Glioma |
| COL6A1, CYP2A13 | Lung cancer |
| PPP2R5C | leukemia |
| PPP6C | Hepatocellular carcinoma |
| AGXT | Lymphomas |
| DIO2 | Thyroid carcinomas |
| DYRK2 | Lung adenocarcinomas |
| FGFBP1 | Gallbladder cancer |
| PROP1 | Pituitary adenoma |
| PITX3 | Liposarcoma |
| RFP | Oligodendroglioma |
| CDKN1C | Adrenal adenoma |
| VAV1 | Ovarian carcinomas, Leukemia |
| JAG1 | Breast cancer, Cervical cancer |
| PHGDH | Breast cancer, Cervical cancer |
| HYAL1 | Breast cancer, Laryngeal carcinoma, Pancreatic cancer |
| NCAM1 | Sarcoidosis, Leukemia, Lymphomas |
| PPP2R2A | Squamous cell carcinoma, Leukemia, Esophageal cancer, Lung cancer |
| GATA2 | Breast cancer, Leukemia, Neuroblastoma, Choriocarcinoma |
| THBS2 | Breast cancer, Adenocarcinoma, Colorectal cancer, Ovarian carcinomas |
| WNT5A | Breast cancer, Leukemia, Pancreatic cancer, Ovarian carcinomas, Melanoma |
| TGM2 | Adenocarcinoma, Neuroblastoma, Pancreatic cancer, Ovarian carcinomas, Lung cancer, Hepatocellular carcinoma, Melanoma |
| GSTP1 | Squamous cell carcinoma, Leukemia, Lymphomas, Ovarian carcinomas, Lung cancer, Hepatocellular carcinoma, Melanoma, Colon cancer, Glioblastoma multiforme, Astrocytoma, Osteosarcoma |
| BAI1 | Carcinoma |
| PTP4A3 | Carcinoma |
| TGFBR3 | Carcinoma |
Combined synergic and individual effect genes to improve the prediction performance
The MicroArray Quality Control (MAQC)-II project provided benchmark datasets for the development and validation of microarray-based predictive models57. We use the Breast Cancer dataset from MAQC-II to further evaluate the reliability of MIC(X1; X2; Y). This dataset is used to predict the pre-operative treatment response (pCR) and estrogen receptor status (erpos). It was originally grouped into two groups: a training set containing 130 samples (33 positivesand 97 negatives for pCR, 80 positives and 50 negatives for erpos), and a validation set containing 100 samples (15 positives and 85 negatives for pCR, 61 positives and 39 negatives for erps). Raw probe data (CEL files) for a set of Affymetrix Human Genome U133A Array microarray assays were obtained from GEO (GSE20194). The microarray chip had probe sets for 22283 features, which were normalized and summarized using the Robust Multi-array Average (RMA) method58 on perfect match probes only. Sequential forward selection (SFS) is used to select individually discriminant genes and synergic genes with MIC(X; Y) and MIC(X1; X2; Y), respectively: (i) Rank the genes separately by MIC(X; Y) or MIC(X1; X2; Y); (ii) select the Top200 genes (Listed in supplemental material Table S4–S7), and conduct 10-fold cross-validation (CV10) for the training sets based on SVC. Accuracy was denoted as CV10w (w = 1, …. 200); (iii) the genes with the highest CV10 accuracy were selected as informative genes for validation. We use the accuracy and Matthew correlation coefficient (MCC) to evaluate the predictive power of the analysis.
 |
 |
Here TP, TN, FP, FN denote true positives, true negatives, false positives and false negatives respectively. Greater accuracy and MCC represent better prediction ability of a model.
As shown in Table 5, for Breast erops, the accuracies of individual model and synergic model are 89% and 90%, the MCCs are 0.77 and 0.79, respectively. If we integrate the two models, the accuracy and MCC of combined model are improved into 92% and 0.83, respectively (Better results may be achieved while the redundancies among genes are removed). Similar improved effects are observed in the “Breast pCR” dataset analysis. These results demonstrate that synergic genes selected by MIC(X1; X2; Y) enhance the individually discriminant model for improving prediction performance.
Table 5. Results of independent test for erpos and pCR of Breast cancer.
| Dataset | Model | Number of genes | Validation accuracy | Validation MCC |
|---|---|---|---|---|
| Breast | ||||
| erpos | Individual model, genes selected by MIC(X; Y) | 8 | 89% | 0.77 |
| Synergic model, genes selected by MIC(X1; X2; Y) | 34 | 90% | 0.79 | |
| Combined model, genes selected by MIC(X; Y) and MIC(X1; X2; Y) | 42 | 92% | 0.83 | |
| Candidate model in reference 51 | 6 | 87% | 0.73 | |
| Best model in reference 51 | 316 | 90% | 0.79 | |
| Breast | ||||
| pCR | Individual model, genes selected by MIC(X; Y) | 59 | 82% | 0.36 |
| Synergic model, genes selected by MIC(X1; X2; Y) | 32 | 81% | 0.35 | |
| Combined model, genes selected by MIC(X; Y) and MIC(X1; X2; Y) | 91 | 84% | 0.37 | |
| Candidate model in reference 51 | 206 | 72% | 0.30 | |
| Best model in reference 51 | 40 | 73% | 0.38 | |
Discussion
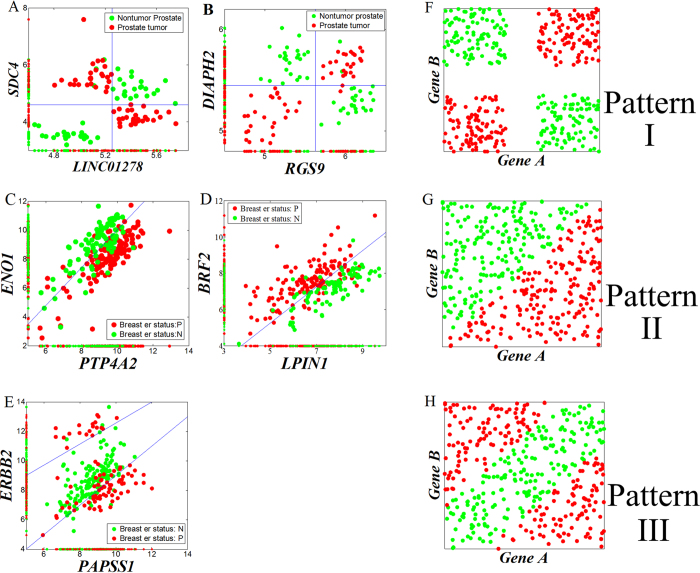
We scanned the Top200s genes selected by MIC(X1; X2; Y) on Prostate and Breast cancer datasets, and summarized three representative patterns of pair-wise synergy and their corresponding theoretic distribution (Fig. 14). Pattern I (Fig. 14A,B,F) results from the typical synergy of Fig. 4, Pattern II (Fig. 14C,D,G) results from the function y = x1–x2 (Fig. 5B), and Pattern III (Fig. 14E,H) results from the function y = |x1 – x2| (Fig. 5C). These patterns offer an efficient tool to infer pathogenic mechanism, even to provide a quantitative model, of pair-wise synergy genes. For Pattern I, Gene A and Gene B both could be on-off oncogenes (Fig. 14A) or tumor suppressor genes (Fig. 14B) which inhibit each other. For Pattern II, one could be an oncogene, and the other could be a tumor suppressor gene. Pattern III is similar to Pattern I, but Gene A and Gene B both could be non on-off oncogenes. The results indicate that although the synergy pattern is diversified in real-world datasets, the MIC(X1; X2; Y) method can explore them well. For the pair-wise synergy ERBB2-PAPSS1, they have been widely reported to correlate with breast cancer59,60,61,62, as well as the ENO1- PTP4A2 pair63,64,65,66. For the BRF2-LIPIN1 pair, BRF2 is related to tumor angiogenesis67. LIPIN1 has been reported to correlate with non-tumorous diseases such as rhabdomyolysis68, Type 2 diabetes69, metabolic syndrome70 and acute myoglobinuria71. Recently, LIPIN1 was reported to regulate breast adenocarcinoma cell proliferation rate72. For the SDC4-LINC01278 pair, SDC4 has been reported to correlate with tumors73, but LINC01278 has not. For the RGS9-DIAPH2 pair, neither of them has been reported to correlate with cancer. However, MIC(X1; X2; Y) suggests that LINC01278, RGS9 and DIAPH2 are important informative genes for prostate tumors, and should be given proper attention.
Figure 14. Three representative patterns of pair-wise synergy identified by MIC(X1, X2: Y) method.
(A–E) are from real-world datasets, (F–H) are the corresponding hypothetical extreme examples.
“MIC is a great step forward, but there are many more steps to take”32. In this article we took such a step—the extension of two variables to three variables which consider pair-wise interaction. Based on “exploring various binning strategies with different number of bins”, Reshef et al.30 employed a clump (points in the same clump to be a unit) partition technique to reduce computing time and improve estimation accuracy of MI in a two-dimensional space. This technique does not work in a three-dimensional space, because the definition of clump/superclump has changed. We re-defined superclumps as “points in the same superclump to be a unit in the same class, with the rank of x2-axis” for considering three variables as a whole, and designed a novel algorithm illustrated in Fig. 3 to overcome this barrier. However, complicated diseases such as cancer are often related to collaborative effects involving interactions of multiple genes. Multivariate analysis, just as Anastassiou group11,15,16,17, Park et al.19 and Shiraishi et al.20 did, is going to be the trend. An extension from MIC(X1; X2; Y) to MIC-based multivariate association networks is therefore still desire.
Additional Information
How to cite this article: Chen, Y. et al. Discovering Pair-wise Synergies in Microarray Data. Sci. Rep. 6, 30672; doi: 10.1038/srep30672 (2016).
Supplementary Material
Acknowledgments
This work was supported by the research was supported by a Grant from the National Natural Science Foundation of China (61300130 to Z.Y.), the Science and Technology Planning Projects of Changsha, China (K1406018-21 to Z.Y.). We thank Dr. Alicia K. Byrd for helpful suggestion.
Footnotes
Author Contributions Y.C., D.C. and Z.Y. conceived and designed the experiments. Y.C. performed the experiments. Y.C., J.G. and Z.Y. analyzed the data. Y.C., D.C., J.G. and Z.Y. wrote the paper. Y.C. and D.C. prepared figures and tables. All the authors reviewed the manuscript.
References
- Liu Q. et al. Feature selection and classification of MAQC-II breast cancer and multiple myeloma microarray gene expression data. PloS One 4, e8250 (2009). [DOI] [PMC free article] [PubMed] [Google Scholar]
- Wang H., Zhang H., Dai Z., Chen M. S. & Yuan Z. TSG: a new algorithm for binary and multi-class cancer classification and informative genes selection. BMC Med Genomics 6, S3 (2013). [DOI] [PMC free article] [PubMed] [Google Scholar]
- Cai H., Ruan P., Ng M. & Akutsu T. Feature weight estimation for gene selection: a local hyperlinear learning approach. BMC Bioinformatics 15, 70 (2014). [DOI] [PMC free article] [PubMed] [Google Scholar]
- Sandhu R. et al. Graph curvature for differentiating cancer networks. Sci. Rep. 5, 12323 (2015). [DOI] [PMC free article] [PubMed] [Google Scholar]
- Hsueh Y. Y. et al. Synergy of endothelial and neural progenitor cells from adipose-derived stem cells to preserve neurovascular structures in rat hypoxic-ischemic brain injury. Sci. Rep. 5, 14985 (2015). [DOI] [PMC free article] [PubMed] [Google Scholar]
- Weng P. H. et al. Chrna7polymorphisms and dementia risk: interactions with apolipoprotein ε4 and cigarette smoking. Sci. Rep. 6, 27231 (2016). [DOI] [PMC free article] [PubMed] [Google Scholar]
- Chopra P., Lee J., Kang J. & Lee S. Improving cancer classification accuracy using gene pairs. PloS One 5, e14305 (2010). [DOI] [PMC free article] [PubMed] [Google Scholar]
- Geman D., d’Avignon C., Naiman D. Q. & Winslow R. L. Classifying gene expression profiles from pairwise mRNA comparisons. Stat. Appl. Genet. Mol. 3, Article19 (2004). [DOI] [PMC free article] [PubMed] [Google Scholar]
- Tan A. C., Naiman D. Q., Xu L., Winslow R. L. & Geman D. Simple decision rules for classifying human cancers from gene expression profiles. Bioinformatics 21, 3896–3904 (2005). [DOI] [PMC free article] [PubMed] [Google Scholar]
- Matsuda H. Physical nature of higher-order mutual information: intrinsic correlations and frustration. Phys. Rev. E 62, 3096–3102 (2000). [DOI] [PubMed] [Google Scholar]
- Anastassiou D. Computational analysis of the synergy among multiple interacting genes. Mol. Syst. Biol. 3, 83 (2007). [DOI] [PMC free article] [PubMed] [Google Scholar]
- Gusareva E. S. et al. Genome-wide association interaction analysis for alzheimer’s disease. Neurobiol. Aging 35, 2436–2443 (2014). [DOI] [PMC free article] [PubMed] [Google Scholar]
- Guo X. et al. Genome-wide interaction-based association of human diseases–a survey. Tsinghua Sci. Technol. 19, 596–616 (2014). [Google Scholar]
- Isir A. B., Baransel C. & Nacak M. An information theoretical study of the epistasis between the cnr1 1359 g/a, polymorphism and the taq1a, and taq1b drd2, polymorphisms: assessing the susceptibility to cannabis addiction in a turkish population. J. Mol. Neurosci. 58, 456–460 (2016). [DOI] [PubMed] [Google Scholar]
- Varadan V. & Anastassiou D. Inference of disease-related molecular logic from systems-based microarray analysis. PLoS Comput. Biol. 2, e68 (2006). [DOI] [PMC free article] [PubMed] [Google Scholar]
- Varadan V., Miller D. M. & Anastassiou D. Computational inference of the molecular logic for synaptic connectivity in C. elegans. Bioinformatics 22, e497–e506 (2006). [DOI] [PubMed] [Google Scholar]
- Watkinson J., Wang X., Zheng T. & Anastassiou D. Identification of gene interactions associated with disease from gene expression data using synergy networks. BMC Syst. Biol. 2, 10 (2008). [DOI] [PMC free article] [PubMed] [Google Scholar]
- Hanczar B., Zucker J. D., Henegar C. & Saitta L. Feature construction from synergic pairs to improve microarray-based classification. Bioinformatics 23, 2866–2872 (2007). [DOI] [PubMed] [Google Scholar]
- Park I., Lee K. H. & Lee D. Inference of combinatorial boolean rules of synergistic gene sets from cancer microarray datasets. Bioinformatics 26, 1506–1512 (2010). [DOI] [PubMed] [Google Scholar]
- Shiraishi Y., Okadahatakeyama M. & Miyano S. A rank-based statistical test for measuring synergistic effects between two gene sets. Bioinformatics 27, 2399–2405 (2011). [DOI] [PubMed] [Google Scholar]
- Ignac T. M., Skupin A., Sakhanenko N. A. & Galas D. J. Discovering Pair-Wise Genetic Interactions: An Information Theory-Based Approach. PloS One 9, e92310 (2014). [DOI] [PMC free article] [PubMed] [Google Scholar]
- Moon Y. I., Rajagopalan B. & Lall U. Estimation of mutual information using kernel density estimators. Phys. Rev. E 52, 2318 (1995). [DOI] [PubMed] [Google Scholar]
- Butte A. J. & Kohane I. S. Mutual information relevance networks: functional genomic clustering using pairwise entropy measurements. Pac. Symp. Biocomput. 5, 418–429 (2000). [DOI] [PubMed] [Google Scholar]
- Kraskov A., Stögbauer H. & Grassberger P. Estimating mutual information. Phys. Rev. E 69, 066138 (2004). [DOI] [PubMed] [Google Scholar]
- Daub C. O., Steuer R., Selbig J. & Kloska S. Estimating mutual information using B-spline functions–an improved similarity measure for analysing gene expression data. BMC Bioinformatics 5, 1 (2004). [DOI] [PMC free article] [PubMed] [Google Scholar]
- Van Hulle M. M. Edgeworth approximation of multivariate differential entropy. Neural Comput. 17, 1903–1910 (2005). [DOI] [PubMed] [Google Scholar]
- Darbellay G. A. & Vajda I. Estimation of the information by an adaptive partitioning of the observation space. IEEE T. Inform. Theory 45, 1315–1321 (1999). [Google Scholar]
- Cellucci C. J., Albano A. M. & Rapp P. E. Statistical validation of mutual information calculations: Comparison of alternative numerical algorithms. Phys. Rev. E 71, 066208 (2005). [DOI] [PubMed] [Google Scholar]
- Khan S. et al. Relative performance of mutual information estimation methods for quantifying the dependence among short and noisy data. Phys. Rev. E 76, 026209 (2007). [DOI] [PubMed] [Google Scholar]
- Reshef D. N. et al. Detecting novel associations in large data sets. Science 334, 1518–1524 (2011). [DOI] [PMC free article] [PubMed] [Google Scholar]
- Zhang Y. et al. A Novel Algorithm for the Precise Calculation of the Maximal Information Coefficient. Sci. Rep. 4, 6662 (2014). [DOI] [PMC free article] [PubMed] [Google Scholar]
- Speed T. A correlation for the 21st century. Science 334, 1502–1503 (2011). [DOI] [PubMed] [Google Scholar]
- Pan X. & Shen H. B. Ougene: a disease associated over-expressed and under-expressed gene database. Sci. Bull. 61, 752–754 (2016). [Google Scholar]
- Peng H., Long F. & Ding C. Feature selection based on mutual information criteria of max-dependency, max-relevance, and min-redundancy. IEEE T. Pattern Anal. 27, 1226–1238 (2005). [DOI] [PubMed] [Google Scholar]
- Guyon I., Weston J., Barnhill S. & Vapnik V. Gene selection for cancer classification using support vector machines. Mach Learn 46, 389–422 (2002). [Google Scholar]
- Liu Q. et al. Gene selection and classification for cancer microarray data based on machine learning and similarity measures. BMC Genomics 12, S1 (2011). [DOI] [PMC free article] [PubMed] [Google Scholar]
- Venet D., Dumont J. E. & Detours V. Most random gene expression signatures are significantly associated with breast cancer outcome. PloS Comput. Biol. 7, e1002240 (2011). [DOI] [PMC free article] [PubMed] [Google Scholar]
- Chang J. T. & Nevins J. R. GATHER: a systems approach to interpreting genomic signatures. Bioinformatics 22, 2926–2933 (2006). [DOI] [PubMed] [Google Scholar]
- Ahmed F., Shiraishi T., Vessella R. L. & Kulkarni P. Tumor necrosis factor receptor associated factor-4: an adapter protein overexpressed in metastatic prostate cancer is regulated by microRNA-29a. Oncol. Rep. 30, 2963–2968 (2013). [DOI] [PubMed] [Google Scholar]
- Andrews C. & Humphrey P. A. Utility of ERG versus AMACR expression in diagnosis of minimal adenocarcinoma of the prostate in needle biopsy tissue. Am. J. Surg. Pathol. 38, 1007–1012 (2014). [DOI] [PubMed] [Google Scholar]
- Chen Y. C. et al. Macrophage migration inhibitory factor is a direct target of HBP1-mediated transcriptional repression that is overexpressed in prostate cancer. Oncogene 29, 3067–3078 (2010). [DOI] [PubMed] [Google Scholar]
- Daniels T. et al. Antinuclear autoantibodies in prostate cancer: immunity to LEDGF/p75, a survival protein highly expressed in prostate tumors and cleaved during apoptosis. The Prostate 62, 14–26 (2005). [DOI] [PubMed] [Google Scholar]
- Feng S. et al. Relaxin promotes prostate cancer progression. Clin. Cancer. Res. 13, 1695–1702 (2007). [DOI] [PubMed] [Google Scholar]
- He Y. et al. Tissue-specific consequences of cyclin D1 overexpression in prostate cancer progression. Cancer Res. 67, 8188–8197 (2007). [DOI] [PubMed] [Google Scholar]
- Jing C. et al. Identification of the messenger RNA for human cutaneous fatty acid-binding protein as a metastasis inducer. Cancer Res. 60, 2390–2398 (2000). [PubMed] [Google Scholar]
- Joesting M. S. et al. Identification of SFRP1 as a candidate mediator of stromal-to-epithelial signaling in prostate cancer. Cancer Res. 65, 10423–10430 (2005). [DOI] [PubMed] [Google Scholar]
- Maruta S. et al. E1AF expression is associated with extra‐prostatic growth and matrix metalloproteinase-7 expression in prostate cancer. Apmis. 117, 791–796 (2009). [DOI] [PubMed] [Google Scholar]
- Rae J. M. et al. GREB1 is a novel androgen‐regulated gene required for prostate cancer growth. The Prostate 66, 886–894 (2006). [DOI] [PubMed] [Google Scholar]
- Sinha D., Joshi N., Chittoor B., Samji P. & D’Silva P. Role of Magmas in protein transport and human mitochondria biogenesis. Hum. Mol. Genet. 19, 1248–1262 (2010). [DOI] [PMC free article] [PubMed] [Google Scholar]
- Tao T. et al. Autoregulatory feedback loop of EZH2/miR-200c/E2F3 as a driving force for prostate cancer development. BBA-Gene Regul Mech 1839, 858–865 (2014). [DOI] [PubMed] [Google Scholar]
- Ueda T. et al. Hyper‐expression of PAX2 in human metastatic prostate tumors and its role as a cancer promoter in an in vitro invasion model. The Prostate 73, 1403–1412 (2013). [DOI] [PubMed] [Google Scholar]
- Wakasugi T. et al. ZNF143 interacts with p73 and is involved in cisplatin resistance through the transcriptional regulation of DNA repair genes. Oncogene 26, 5194–5203 (2007). [DOI] [PubMed] [Google Scholar]
- Wang H. et al. SOX9 is expressed in human fetal prostate epithelium and enhances prostate cancer invasion. Cancer Res. 68, 1625–1630 (2008). [DOI] [PubMed] [Google Scholar]
- Wei J. J. et al. Regulation of HMGA1 expression by microRNA-296 affects prostate cancer growth and invasion. Clin. Cancer. Res. 17, 1297–1305 (2011). [DOI] [PMC free article] [PubMed] [Google Scholar]
- Wu H. C. et al. Significant association of caveolin-1 (CAV1) genotypes with prostate cancer susceptibility in Taiwan. Anticancer Res. 31, 745–749 (2011). [PubMed] [Google Scholar]
- Zhu Y. et al. Inhibition of ABCB1 expression overcomes acquired docetaxel resistance in prostate cancer. Mol. Cancer. Ther. 12, 1829–1836 (2013). [DOI] [PMC free article] [PubMed] [Google Scholar]
- Shi L. et al. The microarray quality control (maqc)-ii study of common practices for the development and validation of microarray-based predictive models. Nat. Biotechnol. 28, 827–838 (2010). [DOI] [PMC free article] [PubMed] [Google Scholar]
- Irizarry R. A. et al. Exploration, normalization, and summaries of high density oligonucleotide array probe level data. Biostatistics 4, 249–264 (2003). [DOI] [PubMed] [Google Scholar]
- Wesoła M. & Jeleń M. A comparison of ihc and fish cytogenetic methods in the evaluation of her2 status in breast cancer. Adv. Clin. Exp. Med. 24, 899–904 (2015). [DOI] [PubMed] [Google Scholar]
- Bièche I. et al. Erbb2, status and benefit from adjuvant tamoxifen in er α-positive postmenopausal breast carcinoma. Cancer Lett. 174, 173–178 (2001). [DOI] [PubMed] [Google Scholar]
- Zhang Y., Wang Y., Wan Z., Liu S., Cao Y. & Zeng Z. Sphingosine kinase 1 and cancer: a systematic review and meta-analysis. PloS One 9, e90362 (2014). [DOI] [PMC free article] [PubMed] [Google Scholar]
- Xu Y. et al. Effect of estrogen sulfation by sult1e1 and papss on the development of estrogen-dependent cancers. Cancer Sci. 103, 1000–1009 (2012). [DOI] [PMC free article] [PubMed] [Google Scholar]
- Gao J. et al. Role of enolase-1 in response to hypoxia in breast cancer: exploring the mechanisms of action. Oncology Reports 29, 1322–1332 (2013). [DOI] [PubMed] [Google Scholar]
- Tu S. H. et al. Increased expression of enolase α in human breast cancer confers tamoxifen resistance in human breast cancer cells. Breast Cancer Res. T. 121, 539–553 (2010). [DOI] [PubMed] [Google Scholar]
- Andres S. A., Wittliff J. L. & Cheng A. Protein tyrosine phosphatase 4a2 expression predicts overall and disease-free survival of human breast cancer and is associated with estrogen and progestin receptor status. Horm. Cancer 4, 208–221 (2013). [DOI] [PMC free article] [PubMed] [Google Scholar]
- Hardy S., Wong N. N., Muller W. J., Park M. & Tremblay M. L. Overexpression of the protein tyrosine phosphatase prl-2 correlates with breast tumor formation and progression. Cancer Res. 70, 8959–8967 (2010). [DOI] [PubMed] [Google Scholar]
- Lu M. et al. Tfiib-related factor 2 over expression is a prognosis marker for early-stage non-small cell lung cancer correlated with tumor angiogenesis. PloS One 9, e88032 (2014). [DOI] [PMC free article] [PubMed] [Google Scholar]
- Michot C. et al. Lpin1, gene mutations: a major cause of severe rhabdomyolysis in early childhood. Hum. Mutat. 31, E1564–E1573 (2010). [DOI] [PubMed] [Google Scholar]
- Zhang R. et al. Genetic variants of lpin1, indicate an association with type2 diabetes mellitus in a chinese population. Diabetic Med. 30, 118–122 (2013). [DOI] [PubMed] [Google Scholar]
- Bego T. et al. Association of pparg and lpin1 gene polymorphisms with metabolic syndrome and type 2 diabetes. Med. Glas. 8, 76–83 (2011). [PubMed] [Google Scholar]
- Zeharia A. et al. Mutations in lpin1 cause recurrent acute myoglobinuria in childhood. Am. J Hum. Genet. 83, 489–494 (2008). [DOI] [PMC free article] [PubMed] [Google Scholar]
- Brohée L. et al. Lipin-1 regulates cancer cell phenotype and is a potential target to potentiate rapamycin treatment. Oncotarget 6, 11264–11280 (2015). [DOI] [PMC free article] [PubMed] [Google Scholar]
- Huang C. P., Cheng C. M., Su H. L. & Lin Y. W. Syndecan-4 promotes epithelial tumor cells spreading and regulates the turnover of pkcα activity under mechanical stimulation on the elastomeric substrates. Cell. Physiol. Bioche. 36, 1291–1304 (2015). [DOI] [PubMed] [Google Scholar]
- Singh D. et al. Gene expression correlates of clinical prostate cancer behavior. Cancer cell 1, 203–209 (2002). [DOI] [PubMed] [Google Scholar]
- Spellman P. T. et al. Comprehensive identification of cell cycle–regulated genes of the yeast Saccharomyces cerevisiae by microarray hybridization. Mol. Biol. Cell. 9, 3273–3297 (1998). [DOI] [PMC free article] [PubMed] [Google Scholar]
- Gordon G. J. et al. Translation of microarray data into clinically relevant cancer diagnostic tests using gene expression ratios in lung cancer and mesothelioma. Cancer Res. 62, 4963–4967 (2002). [PubMed] [Google Scholar]
- Shipp M. A. et al. Diffuse large B-cell lymphoma outcome prediction by gene-expression profiling and supervised machine learning. Nat. Med. 8, 68–74 (2002). [DOI] [PubMed] [Google Scholar]
Associated Data
This section collects any data citations, data availability statements, or supplementary materials included in this article.


