

Abstract
We have previously developed a new method for the development and maintenance of uveal melanoma (UM) xenografts in immunodeficient mice. Here, we compare the genetic profiles of the primary tumors to their corresponding xenografts that have been passaged over time. The study included sixteen primary UMs and corresponding xenografts at very early (P1), early (P4), and late (P9) in vivo passages. The tumors were analyzed for mutation status of GNAQ, GNA11, GNAS, GNA15, BAP1, and BRAF, chromosomal copy number alterations using Affymetrix GeneChip® Genome‐Wide Human SNP6.0 arrays, gene expression profiles using GeneChip® Human Exon 1.0 ST arrays, BAP1 mRNA and protein expression, and MAPK pathway status using Reverse Phase Protein Arrays (RPPA). The UM xenografts accurately recapitulated the genetic features of primary human UMs and they exhibited genetic stability over the course of their in vivo maintenance. Our technique for establishing and maintaining primary UMs as xenograft tumors in immunodeficient mice exhibit a high degree of genetic conservation between the primary tumors and the xenograft tumors over multiple passages in vivo. These models therefore constitute valuable preclinical tool for drug screening in UM.
Keywords: Uveal melanoma, GNAQ/GNA11/BAP1 mutations, Genome profiling, Gene expression profiling, RPPA, Xenografts
Highlights
-
►
Uveal melanoma (UM) prognosis is poor due to a high risk of metastatic disease.
-
►
New therapies are needed to improve the outcome.
-
►
We have developed and characterized a panel of primary human UM xenografts.
-
►
These models closely imitate many important genetic aspects of the human disease.
-
►
They are valuable preclinical tool for drug screening and study tumor progression.
1. Introduction
With 6 new cases per million per year, uveal melanoma (UM) is the most common primary intraocular tumor in adults. Despite a 10‐year local control rate of 95%, over 50% of UM patients die from metastases, confined to the liver in 90% of cases. Very few studies have been specifically devoted to metastatic UM patients, and only 80 publications over the last 30 years providing data on the efficacy of treatments were identified by Augsburger et al. in a recent meta‐analysis (Augsburger et al., 2009). Moreover, very few published studies were prospective clinical trials, including no randomized phase III trial, confirming the lack of effective therapies in this rare cancer. In a retrospective series of 470 consecutive metastatic patients managed at the Institut Curie between 2000 and 2008, the median overall survival was 13 months, with a statistically significant difference according to the first treatment in the metastatic setting, i.e. 28 months for surgery, 12 months for any systemic treatment, and 4 months for best supportive care (Mariani et al., 2009).
Clinical and pathological risk factors for metastasis include age at diagnosis, large tumor diameter and thickness, anterior location, ciliary body involvement, retinal detachment, extrascleral extension, and epithelioid cell type. More recently, genome‐wide techniques of genomic and gene expression profiling can now be used to systematically study tumors and improve the characterization of high‐risk UM. Genetic features such as monosomy 3, overrepresentation of 8q, and a few other genomic alterations, have been shown to be poor prognostic parameters (Damato et al., 2010; Onken et al., 2007; Prescher et al., 1992; Trolet et al., 2009). Moreover, the gene expression signature reported by Onken et al. identified two molecular classes of UM with low risk (Class 1) and high risk (Class 2) of metastasis (Onken et al., 2010, 2012). Finally, mutations in the GNAQ/GNA11 genes activating the MAP kinase pathway (Onken et al., 2008; Van et al., 2009, 2010) and in the BAP1 (BRCA1‐associated protein 1) gene (Harbour et al., 2010) have recently been described in UM. Whereas GNAQ and GNA11 mutational status does not impact the outcome of UM patients (Bauer et al., 2009; Van et al., 2010), BAP1 mutations have been correlated with high‐risk metastatic Class 2 patients (Harbour et al., 2010).
In order to improve the outcome of UM patients, new therapies are therefore warranted. However, because of the very low incidence of this disease, it would be difficult to conduct numerous clinical trials to test the efficacy of innovative therapeutic agents administered alone or in combination. It is therefore mandatory to develop preclinical models that accurately reproduce the molecular features of human UM and display a high predictive value for clinical efficacy in patients. One main category of preclinical cancer models generally used in preclinical investigations consists of xenografts obtained from human tumor fragments and transplanted directly into immunodeficient mice, without any intermediate in vitro passage, recently called “Tumorgrafts” (Garber, 2009). “Tumorgrafts” accurately reproduce the marked heterogeneity of human cancers, particularly when large panels of a specific tumor type are available, but with possible modification of the distribution of various submolecular categories of tumors. Furthermore, procedures for assessment of therapeutic efficacy have been well standardized and facilitate evaluation of combined therapies, particularly for the purposes of objective biostatistical analysis. We have recently reported the establishment and characterization of UM xenografts obtained from patient tumor samples (primary ocular tumors or metastases) (Némati et al., 2010). Our first characterization included comparative histopathological analyzes of both xenografts and the corresponding patient tumors, as well as determination of several molecular markers and chromosome 3 status.
In the view of targeted and personalized therapies, we have in this study assessed the relevance of our UM xenografts as preclinical tool by complete molecular characterization including genetic, genomic, gene, and protein expression profiles, as well as Gene Expression Profiling (GEP) classification, on an extended series of cases. Comparison of xenografts to the original patient tumor samples, and to xenografts at various subsequent in vivo passages, showed that UM xenografts accurately reproduce human UM of bad prognosis. Moreover, these models keep their original molecular features during in vivo maintenance in immunodeficient mice. Therefore, our models constitute relevant preclinical tools to study new treatment strategies.
2. Materials and methods
2.1. Tumor samples
Human uveal melanoma xenografts have previously been established and characterized from primary intraocular (obtained after enucleation) or metastatic tumor samples (Némati et al., 2010). Among these 25 preclinical models, 15 were included in this study, 110 obtained from primary intraocular tumors (MP034/038/041/042/047/055/065/071/077/080), 4 from liver metastases (MM026/052/066/074), and 1 from cutaneous metastasis (MM033). For each model, when DNA, RNA, and proteins could be obtained (Table 1S, supplementary data), the study included samples from the original patient tumors and xenografts at very early (P1), early (P4) and late (P9) in vivo passages in SCID mice (Némati et al., 2010). For one model (MM066), mutations could not be screened due to the low amount of available material. Finally, we compared the mutational status and the 15 genes expression profiling (Onken et al., 2010, 2012) classification of tumors that failed to grow in mice with that of tumors that produced successful xenografts in a set of 52 samples (41 primary tumors and 11 metastases). Among these 52 UM tumors, 26 developed available in vivo preclinical models.
2.2. Mutation screening
The mutational status of G proteins genes (including GNAQ, GNA11, and other G α‐subunits such as GNAS and GNA15), BAP1, and BRAF genes, were assessed. The 21 members of GNα subunit of G receptor protein were not tested, two other members of GNα family mutated in others tumor types, GNAS and GNA15, were analyzed. Specific mutations and primers for all these genes are detailed in Table 2S, supplementary data. PCR amplicons were purified and sequenced with dideoxynucleotides using BigDye Terminator v1.1 (Life Technologies, Villebon, France) and 3.2 pmol of specific primers, and analyzed with a capillary sequencing device (3500xL Genetic Analyzer, Life Technologies).
BAP1 mutations were detected using a heteroduplex detection method (Caux‐Moncoutier et al., 2011; Houdayer et al., 2010; Weber et al., 2007) (Enhanced Mismatch Mutation Analysis, EMMA), followed by a specific standard mutation screen to confirm abnormal peaks. Briefly, 4 different multiplex PCRs were setup to amplify the 17 coding exons. As uveal melanoma genomes show monosomy or isodisomy for chromosome 3, a normal DNA was mixed with the samples to form heterodimers during the EMMA process. Data were analyzed using dedicated software (Emmalys, Fluigent, Paris, France). Abnormal peaks, compared to standard BAP1 peaks, were sequenced individually, using specific primers (Table 3S, supplementary data). Mutation consequences were predicted using by Alamut software (Interactive Biosoftware, Rouen, France), Mutations were classified as deleterious when leading to a stop codon, a frameshift, or a missense with likely significant modifications of the protein; or none‐deleterious when the sequence was wild‐type, contains reported polymorphisms or variations without predicted coding or splicing consequences.
Finally, the BRAF V600 mutation (substitution of a glutamic acid for a valine at codon 600 in exon 15) was also assessed by PCR (primers shown in Table 2S Supplementary data). Sequencing of BRAF amplicons was performed on both strands on samples and a positive control (rhabdomyosarcoma cell line A673) using a BigDye Terminator v3.1 cycle sequencing kit and 3130xL or 3500xL analyzers (Life Technologies).
2.3. DNA extraction and array hybridization
Genomic DNA was purified using a phenol/chloroform method and controlled on 0.5% agarose gel. Five hundred ng of DNA were used to perform Genome‐wide Human SNP Array 6.0 (Affymetrix, Buxks, Santa Clara, CA) assay according to the manufacturer's protocol at the Institut Curie microarray core facility. Briefly, DNA was split to perform two independent digestions with StyI or NspI enzymes. Dedicated adapters were ligated to DNA before running 7 independent PCR reactions, using Titanium™ Taq DNA polymerase (Ozyme, Saint‐Quentin‐en‐Yvelines, France). The PCR products were then controlled in 2% agarose gel, pooled, and fragmented using DNase I enzyme. Size of resulting DNA was checked by gel electrophoresis before terminal labeling and SNP6.0 microarray hybridizations. After hybridization, microarrays were stained, washed and scanned using GeneChip Scanner 3000 system (Affymetrix). Data were controlled with Affymetrix the Genotyping Console Software (Affymetrix): contrast QCs were higher than 0.4 (mean = 1.16), call rates were higher than 86% (mean = 91.8%) and MAPD was less than 0.4 (mean = 0.35).
2.4. RNA extraction and array hybridization
Total RNA was isolated from frozen biopsies using miRNAeasy mini kit (Qiagen, Courtaboeuf, France) and quality control was performed using RNA 6000 Nano LabChip kit (Agilent Technologies, Massy, France) and a NanoDrop spectrophotometer (Thermo, Palaiseau, France). Total RNAs RIN values were between 7.2 and 10 (average: 9.2). GeneChip Human Exon 1.0 ST arrays (Affymetrix) were hybridized according to Affymetrix recommendations using the Ambion WT Expression Kit protocol (Life Technologies) and Affymetrix labeling and hybridization kits. Hundred ng of total RNA were processed in parallel with an external MAQC A RNA to control robustness of data. Labeled DNA mean yield was 7.7 μg (min: 3.9 μg; max: 5.5 μg). GeneChip Human Exon 1.0 ST microarrays (Affymetrix) were hybridized with 4.7 μg of labeled DNA. Raw data, transcript data and exon data were controlled with Expression Console Software (Affymetrix) in the Institut Curie microarray core facility.
2.5. Microarray analysis – genome arrays
Data were analyzed using Partek Genomics Suite software, version 6.5, build 6.10.0915 (Partek, St Louis, USA) using Partek's default parameters. Data were also analyzed and visualized using R software (version 2.12). Files obtained from Genotyping Console Software (Affymetrix) were imported to R, segmented using pruned DPA algorithm (Rigaill, 2010) and calling was estimated by the GLAD method (Hupé et al., 2004).
2.6. Microarray analysis – transcriptome arrays
Transcriptome profiling of patient tumors and corresponding xenografts was defined using Human Exon 1.0 ST Array (Affymetrix). Analyzes were performed with R software (version 2.12). Analyzes were performed at the gene level using custom Brainarray Chip Description Files (CDF) based on Entrez Gene database (version 13) (Dai et al., 2005). This custom CDF improved the quality of the data and consequently the results of the related gene expression studies. Data were normalized by the RMA method (Gautier et al., 2004) and the expression of 22,517 genes was compared. Comparison of gene expression between patient tumors and xenografts was performed using the linear models method with Limma package in R Software (Smyth, 2004, 2005). This analysis was a paired analysis per model. P‐values adjusted by Benjamini and Hochberg <0.01 were considered statistically significant (Benjamini and Hochberg, 1995). Gene set enrichments were calculated using functions from the EMA package (Servant et al., 2010) based on hypergeometric tests from GOStats package (Falcon and Gentleman, 2007).
2.7. Determination of the 15 gene expression profiling (GEP) assay
As described by Onken et al. (2010, 2012), a 15 GEP assay, composed of 3 control genes and 12 discriminating genes, was performed on 67 tumor samples, including 15 xenografts and 52 patient tumors (41 primary tumors and 11 metastases). One μg of total RNA was reverse transcribed using SuperScript™ II Reverse Transcriptase kit (Life technologies) and tested using dedicated TaqMan Gene Expression Assays. After reverse transcription, complementary DNA was adjusted at 0.5 ng/μL and 5 ng were loaded per lane of the microfluidic card, to measure 16 genes in triplicates. Classes were determined using Support Vector Machine (SVM) classification algorithm, as previously described (Onken et al., 2010).
2.8. Determination of BAP1 mRNA and protein expression
To associate genomic and transcriptomic status of BAP1, a relative quantification was achieved using a TaqMan approach. A specific primer/probes set (assay id: Hs01109276_g1, Life Technologies) that measures the junction of exon 16 and 17 was used to performed the relative quantification to GAPDH expression (Hs03929097_g1). The relative quantitative PCR was achieved with 2 ng of cDNA following Life Technologies recommendations. The relative expression of BAP1 mRNA was calculated according the 2−δCT calculation (2‐δCT = 2−(CT BAP1 − CT GAPDH)).
Immunohistochemical study was performed using mouse antihuman BAP1 antibody (monoclonal mouse anti BAP1 (C4), Santa Cruz Biotechnology, Inc, Santa Cruz, CA). The sections were deparaffinized in toluene (3 changes), rehydrated through gradated alcohols (3 changes), and rinsed in distilled water. Heat‐induced epitope retrieval was performed at 97° for 20 min in EDTA buffer pH 9.0. Antibody incubations and detection were carried out at 24 °C on Leica Bond instrument. Endogenous peroxidase activity was blocked with hydrogen peroxide. Bap1 antibody was diluted to 1:100 and incubated 15 min at room temperature. The HRP polymer complex was visualized with 3.3 diamino‐benzidene. Slides were washed in distilled water, counterstained with hematoxylin, dehydrated, and mounted with permanent media. Appropriated positive controls were included with the study sections. For each tumor, cell localization, % of positive tumor cells and immunostaining intensity were defined. We then defined a histological score as: % of BAP1‐positive tumor cells × intensity.
2.9. Reverse Phase Protein Array study (RPPA)
For RPPA, samples were deposited onto nitrocellulose covered Nexterion NC‐C slides (Schott, Jena, Germany) using the 2470 Arrayer (Aushon Biosystems, Billerica, MA). Five serial dilutions, ranging from 1 to 0.0625 mg/ml, and four technical replicates per dilution were deposited for each sample. Arrays were revealed with specific antibodies or without primary antibody (negative control), using Autostainer Plus (Dako, Trappes, France). Briefly, slides are incubated with avidin, biotin and peroxydase blocking reagents (Dako) before saturation with TBS containing 0.1% Tween‐20 and 5% BSA (TBST‐BSA). Slides are then probed overnight at 4 °C with primary antibodies diluted in TBST‐BSA. After washes with TBST, arrays are probed with horseradish peroxidase‐coupled secondary antibodies (Jackson ImmunoResearch Laboratories, Newmarket, UK) diluted in TBST‐BSA for 1 h at RT. To amplify the signal, slides are incubated with the Western Blot Amplification Module Kit (Bio‐Rad Laboratories, Hercules, CA) for 15 min at RT. The arrays are washed with TBST, probed with Cy5‐Streptavidin (Jackson ImmunoResearch Laboratories) diluted in TBST‐BSA for 1 h at RT and washed again in TBST. For staining of total proteins, arrays are incubated 15 min in 7% acetic acid and 10% methanol, rinsed twice in water, incubated 10 min in Sypro Ruby (Invitrogen) and rinsed again. The processed slides are dried by centrifugation and scanned using a GenePix 4000B microarray scanner (Molecular Devices, Sunnyvale, CA). Spot intensity is determined with MicroVigene software (VigeneTech, Carlisle, MA). Quantification of the data is performed using SuperCurve (Hu et al., 2007) and data are normalized according to negative control slides and Sypro Ruby slides. Data from individual RPPA arrays were then scaled to zero mean and unit variance, and a median polish procedure (Mosteller and Tukey, 1977; Häusler et al., 2005) was applied to remove the sample loading biases (this was carried out on a larger set of 71 antibodies assayed on a total of 141 sample lysates, data not shown in this publication). Differential abundance of the proteins between primary tumors and different xenograft passages was assessed using paired T tests assuming equal variance. Primary antibodies were from Cell Signaling Technology (Danvers, MA): anti‐eIF4E, anti‐phospho‐p38, anti‐phospho‐Mek1/2, anti‐Mek1/2, anti‐phospho‐p44/p42 MAP kinase, anti‐p44/p42 MAP kinase, anti‐phospho‐c‐Jun. Anti‐phospho‐MSK1 was from Epitomics (Burlingame, CA).
3. Results
3.1. Mutational status
We initially assessed the status of genes recurrently found to be mutated in UM in patient tumors and their corresponding xenografts at different in vivo passages. GNAQ and GNA11 mutations were found in 4 and 10 cases of the 15 xenografts studied, respectively, with total concordance between xenografts, regardless of the number of passages (Table 1). No mutations were observed in GNAS and GNA15 genes. Overall, 94% of the xenografted tumors studied display GNAQ or GNA11 mutations, a percentage fairly similar to that reported in UM patients. Most of the GNAQ mutations observed were missense mutations in exon 5 (c.626A > C) changing a glycine to a proline, leading to a major modification of the alpha subunit. GNA11 mutations were mostly found in exon 5 on the same Gln209.
Table 1.
Genetic and genomic characteristics of patient's tumors and corresponding xenografts.
| Models | Gene mutations | Chromosome imbalances | Class | |||||||||||||||||||||
|---|---|---|---|---|---|---|---|---|---|---|---|---|---|---|---|---|---|---|---|---|---|---|---|---|
| GNAQ | GNA11 | BAP1 | 1p | 1q | 3 | 6p | 6q | 8p | 8q | 16q | CN | GE | ||||||||||||
| P | X | P | X | P | X | P | X | P | X | P | X | P | X | P | X | P | X | P | X | P | X | X | X | |
| MP34 | 0 | 0 | + | + | 0 | 0 | −1p | +1q° | −3p | +6p° | −6q° | −8p | +8q° | N | ? | |||||||||
| MP38 | + | + | 0 | 0 | + | + | N | N | N | N | isod | −3 | N | N | N | N | +8p | +8p | +8q | +8q | N | N | 2 | 2 |
| MP41 | 0 | 0 | + | + | 0 | 0 | −1p | −1p | +1q | +1q | N | N | +6p | +6p° | −6q | −6q | −8p | −8p | +8q° | +8q° | −16q | −16q | 1 | 1 |
| MP42 | 0 | 0 | + | + | + | + | 2 | |||||||||||||||||
| MP47 | 0 | 0 | + | + | + | + | −1p | N | −3 | N | −6q | −8p | +8q | N | 2 | 2 | ||||||||
| MP55 | 0 | 0 | + | + | + | + | N | N | N | N | −3 | −3 | +6p | +6p | −6q | −6q | +8p | +8p | +8q | +8q | N | N | 2 | 2 |
| MP65 | 0 | 0 | + | + | + | + | −1p | N | N | +1q | −3 | −3 | N | N | −6q | −6q | +8p | +8p | +8q | +8q | N | N | 2 | 2 |
| MP71 | + | + | 0 | 0 | 0 | 0 | N | −1p | N | +1q | −3 | −3 | +6p | N | −6q | −6q | N | N | +8q | +8q | −16q | −16q | 2 | 2 |
| MP77 | 0 | 0 | + | + | 0 | 0 | −1p | −1p | +1q | +1q | −3 | −3 | +6p | +6p | −6q | −6q | +8p | +8p | +8q | +8q | −16q | −16q | 2 | 2 |
| MP80 | 0 | 0 | + | + | 0 | 0 | N | N | N | N | −3 | −3 | N | N | N | N | −8p | −8p | +8q | +8q | −16q | −16q | 2 | 2 |
| MM26 | + | + | 0 | 0 | 0 | 0 | −1p° | −1p° | +1q | +1q | −3 | −3 | +6p° | +6p° | −6q° | −6q° | −8p | −8p | +8q | +8q | −16q | −16q | 2 | 1 |
| MM33 | + | + | 0 | 0 | 0 | 0 | −1p | −1p | +1q | +1q | N | N | +6p | N | −6q | −6q | +8p | +8p | +8q | +8q | N | N | 1 | 1 |
| MM52 | 0 | 0 | 0 | 0 | + | + | −1p | −1p | N | N | −3 | −3 | N | N | −6q | −6q | N | +8p | N | +8q | N | N | 2 | 2 |
| MM66 | 0 | + | 0 | Isod | Isod | +1q | +1q | N | N | +6p | +6p° | −6q | −6q | +8p | +8p | +8q | +8q | N | N | 1 | 1 | |||
| MM74 | 0 | 0 | + | + | + | + | N | N | N | N | −3 | −3 | N | N | −6q | −6q | −8p | −8p | +8q | +8q | −16q | −16q | 2 | 2 |
Abbreviations: P, patient's tumors; X, corresponding xenografts; Gene mutations: 0, non mutated; +, mutated; Chromosome imbalances: isod, isodisomy; −, loss; +, gain; °, partial alteration; N, normal; empty case, no data available; Class: CN, Classification by Chromosome 3 Copy Number; GE, Classification by Gene Expression (8); 1, low‐risk tumors; 2, high‐risk tumors; ?, CN class not determined for MP34 (partial monosomy 3).
BAP1 deleterious mutations were detected in 7/15 xenografts (47%) and also showed complete concordance with the mutational status of the corresponding patient tumors (Table 1). Frameshift truncated mutations were found in 4 models (MP042: c.662del/p.Glu221GlyfsX10; MP047: c.862_920del, p.Ala288GlnfsX90; MP065: c.1717del, p.Leu573TrpfsX3; MM074: c.790del, p.Arg264GlufsX2). A nonsense mutation was found in MM052 (c.781C > T, p.Gln261X). A non‐truncated mutation was detected in MP055 modifying the aminoacid 172, a serine to an arginine (c.516C > G, p.Ser172Arg). Finally, in MP038 was detected a deletion of 14 pb in intron 2 (c.68‐9_72del) leading putatively to the loss of a splice site.
No BRAF mutations were detected, as previously reported in UM patients (Table 1).
We then evaluated whether mutational status could impact in vivo growth of patient tumors transplanted into mice. Overall, 52 samples (41 primary tumors and 11 metastases) xenografted into SCID mice were available for genetic analyzes. Among these samples, 22/41 primary tumors and 4/11 metastases were successfully grown after in vivo transplantation. As shown in Table 4S supplementary data, a significantly lower proportion of GNAQ‐mutated tumors were able to grow in mice (p < 10−3) and, inversely, a significantly higher proportion of GNA11‐mutated tumors were able to grow after in vivo transplantation (p < 0.05). No correlation was observed between the capacity of tumors to grow in immunodeficient mice and their mutational status of BAP1 (Table 4S supplementary data).
3.2. Genomic alterations
Thirty‐five uveal melanoma samples were analyzed on SNP arrays, including 12 patient tumors (7 ocular tumors and 5 liver metastases) and 23 corresponding xenografts at several passages in mice (10 at very early, 8 at early and 5 at late in vivo passages) (see Table 1S for details on analyzed samples). Among all these tumor samples, detection of copy number alterations revealed that 18 tumors (51%) presented a loss of chromosome 1p, 22 tumors (63%) a gain of 1q, 26 tumors (74%) a loss of 3, 16 tumors (46%) a gain of 6p, 27 tumors (77%) a loss of 6q, 30 tumors (86%) a gain of entire 8q and 4 with a partial gain of 8q, and 16 tumors (46%) a loss of 16q. These genomic profiles revealed an overrepresentation (10/15) of high risk tumors (also called “class 2”). When considering tumors according to their origin (primary ocular tumors or liver metastases), 2/10 models from primary tumors and 2/5 models from metastases are considered less aggressive based on their genomic profiles.
As indicated above, one of the primary objectives of this study was to evaluate the genomic stability of tumors during the in vivo transplantation process of human UM and the in vivo maintenance of UM xenografts. The observed alterations in 12 models for which patient tumors (Figure 1A) and corresponding xenografts (Figure 1B) are available suggest a high level of conservation of genomic profiles. Chromosomes frequently altered in up to 50% of cases in patient's tumors, i.e. chromosomes 1, 3, 6, 8, and 16, are the same than in corresponding xenografts. The comparison of the frequency of alterations shows that xenografts have the same DNA damages as the patient's tumors but with higher frequencies, probably due to clonal selection occurring during the passages in mice.
Figure 1.
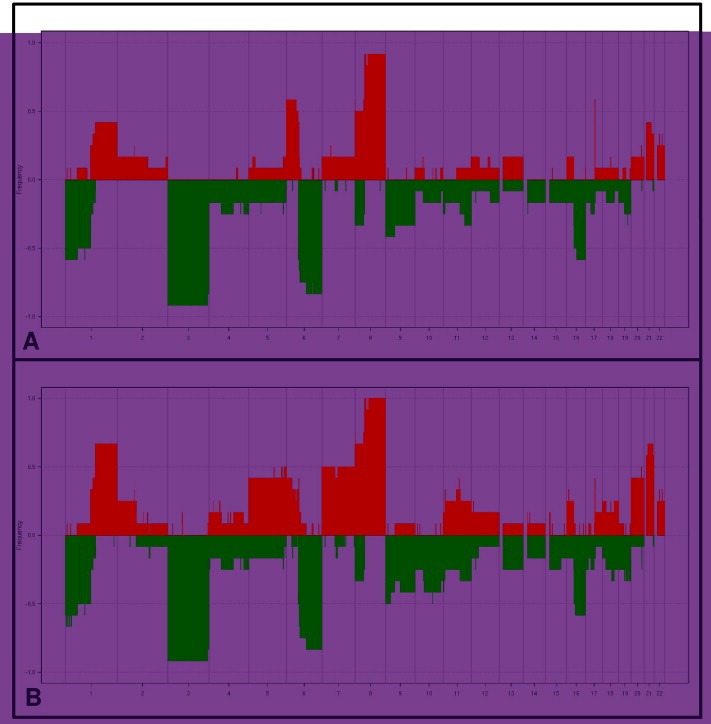
Frequency of chromosomal alterations observed in 12 patient tumors (A) and corresponding xenografts (B). The values correspond to the percentages of gained and lost segments identified. Red: gain. Green: loss. More than one half of tumors presented known high‐risk alterations such as Loss 1p, Loss 3, and Gain 8q.
We could compare the genomic profiles of 4 models at late passage (P9), with the original patient tumors and we found a high level of conservation of genomic profiles. Given the long interval between the first and 9th passages (between 18 and 38 months), we can conclude on a high degree of genomic stability of these primary human UM xenografts (example for one model in Figure 1S, supplementary data).
To further evaluate the concordance between tumors, the correlation based on smoothened copy number value from our 35 samples was calculated. Comparison of the 12 patient tumors (primary tumors and metastases) and corresponding xenografts showed marked similarities, with a total correlation score of 0.89. This strong correlation per model is significantly higher than the correlation observed between all samples by study of correlation distributions with Kolmogorov–Smirnov test (p < 2.2e‐16).
The main genomic alterations of each xenograft and corresponding patient's tumors are presented in Table 1. According to chromosome imbalances, genomic classification was determined based on monosomy of chromosome 3 which is associated to bad prognosis. In this way, in genomic classification, class 2 tumors corresponded to monosomic 3 tumors and class 1 tumors were disomic. Based on this genomic classification, among the 10 primary tumors models, 7 models were class 2, 1 was class 1 and 2 were undetermined (MP034 presented a partial deletion of chromosome 3 and MP042 was only analyzed by FISH). Among the 5 metastasis models, 3 were classified class 2 and 2 were classified class 1 (Table 1).
3.3. Gene expression profiles of intraocular and metastatic UM samples
Forty four UM samples were analyzed on Affymetrix GeneChip® Human Exon 1.0 ST arrays, including 12 patient tumors, 32 xenografts at very early (n = 15), early (n = 13), and late (n = 4) in vivo passages. In addition to genomic profiles, the stability of gene expression profiles among patient tumor samples and their corresponding xenografts was also evaluated. Due to the different origin of the two types of tumors, i.e. from primary intraocular and metastatic lesions, clustering of the tumors was first evaluated to determine whether all models could be analyzed together. Hierarchical clustering on the 12 samples of patient tumors performed on all 22,517 genes demonstrated mixed data with no organ bias (data not shown). All data were therefore analyzed together.
Hierarchical clustering, performed on the 10 models for which RNAs from patient tumors and xenografts at very early and late in vivo passages were available, showed that 5 patient tumors and xenografts, regardless of the number of passages, clustered together (50%), and that 9 xenografts/P1 and xenografts/P4 clustered together (90%) (Figure 2A). RNAs from xenografts/P9 were available for only 4 models in which RNAs from patient UM were not available, preventing analysis of this late passage due to lack of statistical power.
Figure 2.
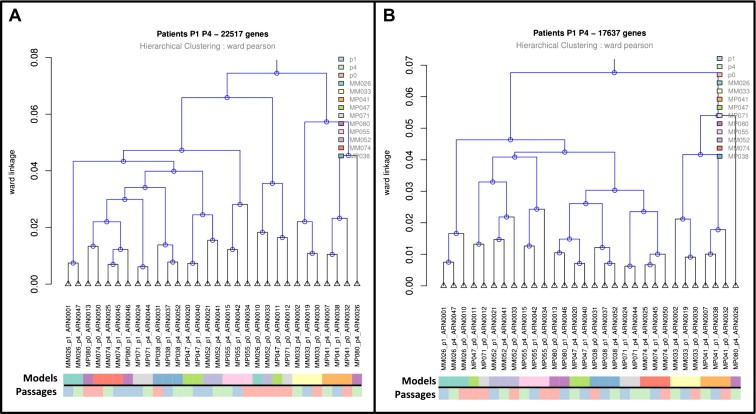
Gene expression study. A. Hierarchical clustering of paired patient tumors (p0) and corresponding xenografts passages 1 (p1) and 4 (p4). Hierarchical clustering was based on 22,517 genes of array. B. Hierarchical clustering of paired patient tumors (p0) and corresponding xenografts, passages 1 (p1) and 4 (p4). Clustering was based on 17,637 genes (genes remaining after excluding genes from immune system, extracellular matrix and angiogenesis). Pearson's correlation as metric to measure the distance between pairs of observations and Ward's method as linkage criterion to measure the distance between sets of observations as a function of the pairwise distances between observations were used. Samples were cluster together based on transcriptomic profiles. The shorter were the branches the more similar the samples. Color code distinguished models and passages: On the first line, each sample from the same model has the same color code, On the second line, patients (p0) are in orange, xenografts p1 in blue and xenografts p4 in green.
As shown in Table 2, we identified about 700 genes differentially expressed between patient tumors and xenografts (P1 and P4), representing 3% of all genes available on the microarrays. In contrast, no genes were differentially expressed (FDR < 0.01) between xenografts at very early and early in vivo passages. About two‐thirds of the 700 genes differentially expressed between patient tumors and xenografts were overexpressed in patient tumors, and about one‐third were overexpressed in xenografts (Table 2). Enrichment analysis of these differentially expressed genes by hypergeometric tests revealed gene overexpression in the immune system, extracellular matrix and angiogenesis biological process categories in patient tumors compared to xenografts; conversely, gene overexpression in the cell cycle, DNA repair and kinase activity biological process categories were found in xenografts compared to patient tumors (Table 5S, supplementary data).
Table 2.
Differentially expressed genes between patient tumors and corresponding xenografts (P1 and P4).
| FDR 1% | 22,517 genes (all genes) | 17,637 genesa | ||||
|---|---|---|---|---|---|---|
| Total | Up in P | Up in X | Total | Up in P | Up in X | |
| Pts/P1 | 698 (3.10%) | 485 (2.15%) | 213 (0.95%) | 174 (0.99%) | 103 (0.58%) | 71 (0.40%) |
| Pts/P4 | 769 (3.42%) | 436 (1.94%) | 333 (1.48%) | 248 (1.41%) | 102 (0.58%) | 146 (0.83%) |
| P1/P4 | 0 | 0 | 0 | 0 | 0 | 0 |
Abbreviations: P, patients; X, xenografts.
Genes belonging to the immune system, extracellular matrix and angiogenesis were excluded from the analysis.
Such down‐regulation of genes belonging to the immune system, extracellular matrix and angiogenesis may be due to the presence of human stromal cells in patient tumors and murine stromal cells in xenografts, and may explain the relatively low clustering of patient tumors and xenografts. To evaluate the importance of these genes in this comparison, we therefore excluded from the microarray genes related to the immune system, extracellular matrix and angiogenesis (Gene Ontology annotation), resulting in the analysis of 17,637 genes out of 22,517 of the original dataset. Under these conditions, 8 patient tumors and xenografts, regardless of the number of passages, clustered together (80%) and 9 xenografts/P1 and xenografts/P4 clustered together (90%) (Figure 2B). Differential analysis of these remaining genes revealed a variation of about 1% between patient tumors and xenografts (Table 2).
3.4. Determination of a 15 gene expression profiling (GEP) assay
A 15 gene expression profiling (GEP) assay classifying primary uveal melanomas into two prognostic subgroups (class 1‐low metastatic risk and class 2‐high metastatic risk) has been recently validated in a prospective study (Onken et al., 2010, 2012). We have therefore performed this assay in 52 patient tumor samples and 14 xenografts in order to (i) evaluate the potential correlation between GEP‐defined risk classes and in vivo tumor take rate, (ii) characterize our xenograft panel with regard to this classification, and (iii) examine the maintenance of the GEP status between patient tumors and corresponding xenografts. In the 52 studied patient tumors, the GEP assay classification identified 20 class 1 and 32 class 2 tumors. The percentage of tumor‐take into immunodeficient mice was 40% for the class 1 tumors (8 out of 20) and 59% for the class 2 tumors (19 out of 32). Although there is a trend indicating a higher tumor take of class 2 high‐risk tumors as compared with class 1, the differences observed were not statistically significant. As shown in Table 1, among the 14 xenografts analyzed, 10 were classified as high risk and 4 as low‐risk by using GEP. Classification in high/low risk by using genomic alteration signature (Trolet et al., 2009) also identified 10 class 2 and 3 class 1 tumors. The classification into the groups following the two methods was the same in 12 out of 14 models (see Table 1). These data confirm that poor prognosis uveal melanoma tumors are overrepresented in our panel. Importantly, a complete concordance was found between patient tumors and their corresponding xenografts in terms of GEP classification, further indicating the maintenance of transcriptional profile during the grafting process.
3.5. Quantification of BAP1 expression
BAP1 mRNA was relatively expressed at low levels in both patients' tumors (0.001–0.039) and corresponding xenografts (0.001–0.032) (Table 6S, supplementary data). Nevertheless, we observed lower expression levels in BAP1 deleterious mutated tumors (Figure 3A) and a good correlation of BAP1 mRNA expression between xenografted tumors and corresponding patients' tumors. Similarly, in BAP1 wild‐type patients' tumors and xenografts, BAP1 protein was highly expressed with a median histological score of 170 and 200, respectively; in contrast, BAP1 was not or slightly expressed in all BAP1‐mutated tumors (Figure 3B). Moreover, there is a very good correlation of the BAP1 protein expression between patients' tumors and xenografts. It is noteworthy to note that, in all BAP1 non‐mutated tumors except one model (MP71), BAP1 protein was localized into the nucleus (Figure 3C).
Figure 3.
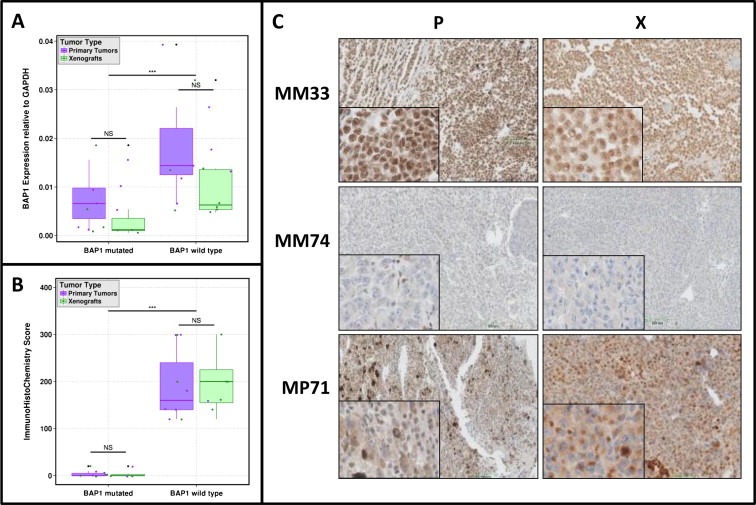
Determination of BAP1 mRNA (A) and protein (B) expression in patients and xenograft tumors according BAP1 status (deleterious mutations taken into account). Wilcoxon test was performed to determined significance in BAP1 expressions between primary tumors and xenografts (according BAP1 status subgroups). Wilcoxon test was also performed to determined significance in BAP1 expressions between BAP1 mutated versus non mutated models. NS: no significance, ∗∗∗p value < 0.01. C. BAP1 IHC protein expression in 3 models and corresponding patients tumors.
3.6. Specific status of signaling pathways and protein expression profiles
Mutations in the GNAQ/GNA11 genes are known to activate the MAP kinase pathway (Van et al., 2009), which possibly contributes to the tumorigenesis process. In order to evaluate if xenografts show expression levels of this pathway comparable to the patients' tumors, we studied the expression levels and the phosphorylation status of proteins involved in the MAPK pathway by RPPA. Different paired comparisons have been performed, i.e. patient tumors/xenografts P1 (10 pairs) or P4 (10 pairs) or P9 (4 pairs), and xenografts P1/xenografts P4 (13 pairs) or xenografts P4/xenografts P9 (6 pairs). Our data show a slight increase in the levels of total MEK1/2 and total p44/p42MAPK protein levels in xenografts compared to the patients' tumors. However, levels of phospho‐MEK1/2 and phospho‐p44/p42 remain stable (Figure 4 and Table 7S, supplementary data). In addition, levels of phosphorylated MSK1, a direct downstream target of p44/p42MAPK, are similar between patient samples and xenografts. In conclusion, the activation status of the MAPK pathway, as measured by the level of phosphorylated proteins, is not significantly altered between patient's tumors and xenografts.
Figure 4.
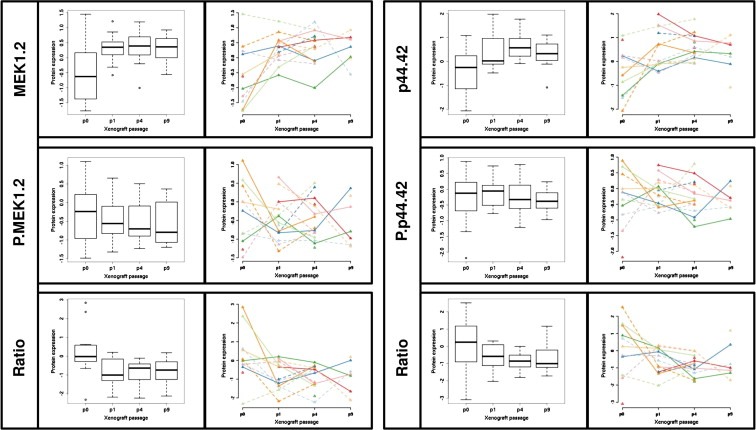
Determination by RPPA analyzes of the MEK1.2 and p44.42.MAP.kinase proteins and their respective phosphorylated form and ratio (phosphorylated protein/total protein). For each protein, patients (p0) and when available their corresponding xenograft at different passages (p1, p4 and p9) are represented. Protein expression is represented or by boxplots or by dots and lines per models. To distinguish models different colors and different line types were used.
4. Discussion
The aim of this study was to perform a large molecular characterization of our unique panel of primary human UM xenografts and evaluate the similarity between established xenografts and their corresponding patient tumors as an essential step to validate the relevance of these models in preclinical setting. In this way we have conducted mutational studies of selected genes, copy number/allele frequency, gene expression profile, multi‐gene prognostic assay, and activation status of MAP kinase pathway.
This issue is of particular importance in the presence of alterations that play an oncogenic role, and could have prognostic or therapeutic implications in UM patients (Harbour et al., 2010; Häusler et al., 2005; Onken et al., 2010; Trolet et al., 2009; White et al., 2006). A majority of studied tumors were defined by at least genomic alterations of chromosomes 3 and 8, as previously associated with high risk of metastasis in UM patients (Harbour et al., 2010; Häusler et al., 2005; Onken et al., 2010; Trolet et al., 2009; White et al., 2006), and were classified as class 2 after SVM classification by gene expression profiling assay (Onken et al., 2010, 2012). This observation is concordant with our first report showing that in vivo tumor growth of UM samples were significantly correlated with low metastasis‐free survival of patients (Némati et al., 2010). This observation also underlines the fact that our UM xenografts constitute a panel of poor prognosis tumors for which precisely new efficient treatments are required. However, it is important to note that low and high risk classes defined by both genomic and gene expression profiling are represented. Moreover, we demonstrated a high correlation between genetic/genomic alterations observed in patient tumors and their corresponding xenografts. Few other publications have addressed this issue. Focusing on two specific markers (KRAS gene mutation and SMAD4/DPC4 expression) in 12 models of pancreatic carcinoma, Rubio‐Viqueira et al. showed a high degree of concordance between primary tumors and xenografted tumors (Rubio‐Viqueira et al., 2006). Similarly, a high level of stability was observed in various cancer types including BRCA1‐mutated ovarian carcinoma (Indraccolo et al., 2006; Press et al., 2008), glioblastoma (Claes et al., 2008; Jeuken et al., 2000), breast cancers (Bergamaschi et al., 2009; Plater et al., 2010; Marangoni et al., 2007; Reyal et al., 2012), synovial sarcoma (Subramaniam et al., 2006), and acute lymphoblastic leukemia (Borgmann et al., 2000). Data reported in this study, and by other authors, therefore support the fact that primary human cancer xenografts accurately reproduce the genetic and genomic alterations of the original patient tumors.
To allow the use of primary human xenografts for pharmacological assessments, two very important questions are raised, namely (i) are genetic/genomic/gene expression profiles modified during the in vivo transplantation process and (ii) are these profiles modified during in vivo maintenance of the model. Despite the extensive use of primary human xenografted tumors, very few published studies have evaluated the stability of these parameters. Comparison of genomic profiles between xenografts and patient tumors in four types of cancer, i.e. breast cancers (Reyal et al., 2012), gynecologic tumors (Bergamaschi et al., 2009), pancreatic adenocarcinomas (Armengol et al., 2000), and glioblastomas (Jeuken et al., 2000), demonstrated that both samples matched in the same cluster, suggesting genetic stability during the in vivo transplantation process. In our study, we observed that a very small proportion of genes, i.e. about 3% of the 22,517 genes studied, were differentially expressed between patient tumors and their corresponding xenografts and that an exquisite gene expression stability was observed in xenografts at different in vivo passages. Two‐thirds of the 3% of differentially expressed genes corresponded to stromal components, namely immune response, response to wounding, extracellular matrix component, cell adhesion, and angiogenesis, as previously observed with our breast cancer xenografts (Reyal et al., 2012). Nevertheless, in contrast with the breast cancer models, 1% of genes were overexpressed in UM xenografts compared to the corresponding patient tumors. Because of the high occurrence of BAP1 gene mutations in UM and their impact onto protein expression, we have studied BAP1 protein expression, showing a strong correlation between the BAP1 protein level and the wild‐type status of the gene. Moreover, as for other molecular analyzes, we have observed a strong correlation between patients' tumors and corresponding xenografts. Finally, our comparative analysis of MAP kinase activation status by RPPA showed that, although total MEK1/2 and p44/p42MAPK protein levels are slightly increased in xenografts compared to patients' tumors, no significant changes occur at the level of the phosphorylated proteins during the in vivo transplantation process and throughout the different passages. Therefore, we consider that the expression status of the MAPK pathway is conserved between patients' tumors and corresponding xenografts. Our data clearly indicates that our preclinical UM xenografts constitute a relevant tool for pharmacological assessments. According to the molecular assessment, our panel of xenografts could represent a valuable tool to test therapeutic efficacy of standard and innovative treatments in humans. In the context of UM, in which a number of targeted therapies are currently under investigation (Patel et al., 2011), our models offer well‐defined tumors in terms of signaling pathways, gene and protein expression. Based on these features, preclinical trials may hopefully define the best compound(s) and the best combination(s) of treatments to be translated into clinical trials. In this view, systematic genetic analysis of primary tumors is therefore recommended in the future, from enucleations or transvitreal or transcleral needle biopsies, to allow future adjuvant trials based on newly identified biological targets. Such approaches should therefore improve the outcome of UM patients.
Conflict of interest statement
CL, DG, SPN, FN, BT, LD, PM, AR, XSG, JC, PH, LDK, TD, SRR, MHS, EB, JWH, SS, and DD have no conflicts to disclose.
Supporting information
Supplementary data
Figure 1S Example of MM066 SNP6.0 microarrays analyzes. Chromosomes 3, 6 and 8 are presented for MM066 patient and corresponding 3 passages available for this model. For each chromosome, the four samples are overlapping according a color code. At the top is presented the copy number and at the bottom the corresponding status (normal, gain or loss). Black: MM066 patient (P0), Green: MM066 passage 1 (P1), Pink: MM066 passage 4 (P4), Yellow: MM066 passage 9 (P9).
Acknowledgments
The authors would like to thank Caroline Hego, Cécile Reyes and Benoît Albaud (Platform of Molecular Biology facilities, Translational Research Department, Institut Curie) for their expertise on SNP arrays and Exon arrays; Aurélie Barbet, Floriane Bard et Caroline Lecerf (RPPA platform, Translational Research Department, Institut Curie) for their expertise on protein arrays; Pierre Gestraud for his biostatistics assistance; Olivier Lantz, Jordan Madic, and Patricia de Cremoux for providing GNAQ, GNA15, and BRAF primers, respectively; Laurence Tremolet of the sequencing platform of Institut Curie; the group of Pr Dominique Stoppa‐Lyonnet for the Emma technique and analysis; Lucie Hebert and Virginie Jacquemin for BAP1 mutation analysis; Fondation de France (grant 12062) for their support.
Supplementary data 1.
1.1.
Supplementary data related to this article can be found at http://dx.doi.org/10.1016/j.molonc.2013.02.004.
Laurent Cécile, Gentien David, Piperno-Neumann Sophie, Némati Fariba, Nicolas André, Tesson Bruno, Desjardins Laurence, Mariani Pascale, Rapinat Audrey, Sastre-Garau Xavier, Couturier Jérôme, Hupé Philippe, de Koning Leanne, Dubois Thierry, Roman-Roman Sergio, Stern Marc-Henri, Barillot Emmanuel, Harbour J. William, Saule Simon, Decaudin Didier, (2013), Patient‐derived xenografts recapitulate molecular features of human uveal melanomas, Molecular Oncology, 7, doi: 10.1016/j.molonc.2013.02.004.
References
- Armengol, G. , 2000. DNA copy number changes and evaluation of MYC, IGF1R, and FES amplification in xenografts of pancreatic adenocarcinoma. Cancer Genet. Cytogenet. 116, (2) 133–141. [DOI] [PubMed] [Google Scholar]
- Augsburger, J.J. , Corrêa, Z.M. , Shaikh, A.H. , 2009. Effectiveness of treatments for metastatic uveal melanoma. Am. J. Ophthalmol. 148, (1) 119–127. [DOI] [PubMed] [Google Scholar]
- Bauer, J. , 2009. Oncogenic GNAQ mutations are not correlated with disease-free survival in uveal melanoma. Br. J. Cancer 101, (5) 813–815. [DOI] [PMC free article] [PubMed] [Google Scholar]
- Benjamini, Y. , Hochberg, Y. , 1995. Controlling the false discovery rate: a practical and powerful approach to multiple testing. J. Roy. Statist. Soc. Ser. B 57, (1) 289–300. [Google Scholar]
- Bergamaschi, A. , 2009. Molecular profiling and characterization of luminal-like and basal-like in vivo breast cancer xenograft models. Mol. Oncol. 3, (5–6) 469–482. [DOI] [PMC free article] [PubMed] [Google Scholar]
- Borgmann, A. , 2000. Childhood all blasts retain phenotypic and genotypic characteristics upon long-term serial passage in NOD/SCID mice. Pediatr. Hematol. Oncol. 17, (8) 635–650. [DOI] [PubMed] [Google Scholar]
- Caux-Moncoutier, V. , 2011. EMMA, a cost- and time-effective diagnostic method for simultaneous detection of point mutations and large-scale genomic rearrangements: application to BRCA1 and BRCA2 in 1,525 patients. Hum. Mutat. 32, (3) 325–334. [DOI] [PubMed] [Google Scholar]
- Claes, A. , 2008. Phenotypic and genotypic characterization of orthotopic human glioma models and its relevance for the study of anti-glioma therapy. Brain Pathol. 18, (3) 423–433. [DOI] [PMC free article] [PubMed] [Google Scholar]
- Dai, M. , 2005. Evolving gene/transcript definitions significantly alter the interpretation of GeneChip data. Nucleic Acids Res. 33, (20) e175 [DOI] [PMC free article] [PubMed] [Google Scholar]
- Damato, B. , Dopierala, J.A. , Coupland, S.E. , 2010. Genotypic profiling of 452 choroidal melanomas with multiplex ligation-dependent probe amplification. Clin. Cancer Res. 16, (24) 6083–6092. [DOI] [PubMed] [Google Scholar]
- Falcon, S. , Gentleman, R. , 2007. Using GOstats to test gene lists for GO term association. Bioinformatics 23, (2) 257–258. [DOI] [PubMed] [Google Scholar]
- Garber, K. , 2009. From human to mouse and back: ‘tumorgraft’ models surge in popularity. J. Natl. Cancer Inst. 101, (1) 6–8. [DOI] [PubMed] [Google Scholar]
- Gautier, L. , Cope, L. , Bolstad, B.M. , Irizarry, R.A. , 2004. Affy-analysis of Affymetrix GeneChip data at the probe level. Bioinformatics 20, (3) 307–315. [DOI] [PubMed] [Google Scholar]
- Harbour, J.W. , 2010. Frequent mutation of BAP1 in metastasizing uveal melanomas. Science 330, (6009) 1410–1413. [DOI] [PMC free article] [PubMed] [Google Scholar]
- Häusler, T. , 2005. Loss of heterozygosity of 1p in uveal melanomas with monosomy 3. Int. J. Cancer 116, (6) 909–913. [DOI] [PubMed] [Google Scholar]
- Houdayer, C. , 2010. Enhanced mismatch mutation analysis: simultaneous detection of point mutations and large scale rearrangements by capillary electrophoresis, application to BRCA1 and BRCA2. Methods Mol. Biol. 653, 147–180. [DOI] [PubMed] [Google Scholar]
- Hu, J. , 2007. Non-parametric quantification of protein lysate arrays. Bioinformatics 23, (15) 1986–1994. [DOI] [PubMed] [Google Scholar]
- Hupé, P. , 2004. Analysis of array CGH data: from signal ratio to gain and loss of DNA regions. Bioinformatics 20, (18) 3413–3422. [DOI] [PubMed] [Google Scholar]
- Indraccolo, S. , 2006. Establishment and characterization of xenografts and cancer cell cultures derived from BRCA1 -/- epithelial ovarian cancers. Eur. J. Cancer 42, (10) 1475–1483. [DOI] [PubMed] [Google Scholar]
- Jeuken, J.W. , 2000. Genetic reflection of glioblastoma biopsy material in xenografts: characterization of 11 glioblastoma xenograft lines by comparative genomic hybridization. J. Neurosurg. 92, (4) 652–658. [DOI] [PubMed] [Google Scholar]
- Marangoni, E. , 2007. A new model of patient tumor-derived breast cancer xenografts for preclinical assays. Clin. Cancer Res. 13, (13) 3989–3998. [DOI] [PubMed] [Google Scholar]
- Mariani, P. , 2009. Surgical management of liver metastases from uveal melanoma: 16 years' experience at the Institut Curie. Eur. J. Surg. Oncol. 35, (11) 1192–1197. [DOI] [PubMed] [Google Scholar]
- Mosteller, F. , Tukey, J. , 1977. Data Analysis and Regression: a Second Course in Statistics s.l.: Addison-Wesley Pub. Co. [Google Scholar]
- Némati, F. , 2010. Establishment and characterization of a panel of human uveal melanoma xenografts derived from primary and/or metastatic tumors. Clin. Cancer Res. 16, (8) 2352–2362. [DOI] [PubMed] [Google Scholar]
- Onken, M.D. , 2012. Collaborative ocular oncology group report number 1: prospective validation of a multi-gene prognostic assay in uveal melanoma. Ophthalmology 119, (8) 1596–1603. [DOI] [PMC free article] [PubMed] [Google Scholar]
- Onken, M.D. , 2008. Oncogenic mutations in GNAQ occur early in uveal melanoma. Invest. Ophthalmol. Vis. Sci. 49, (12) 5230–5234. [DOI] [PMC free article] [PubMed] [Google Scholar]
- Onken, M.D. , 2007. Loss of heterozygosity of chromosome 3 detected with single nucleotide polymorphisms is superior to monosomy 3 for predicting metastasis in uveal melanoma. Clin. Cancer Res. 13, (10) 2923–2927. [DOI] [PubMed] [Google Scholar]
- Onken, M.D. , Worley, L.A. , Tuscan, M.D. , Harbour, J.W. , 2010. An accurate, clinically feasible multi-gene expression assay for predicting metastasis in uveal melanoma. J. Mol. Diagn. 12, (4) 461–468. [DOI] [PMC free article] [PubMed] [Google Scholar]
- Patel, M. , 2011. Therapeutic implications of the emerging molecular biology of uveal melanoma. Clin. Cancer Res. 17, (8) 2087–2100. [DOI] [PubMed] [Google Scholar]
- Plater, L.D. , 2010. Establishment and characterisation of a new breast cancer xenograft obtained from a woman carrying a germline BRCA2 mutation. Br. J. Cancer 103, (8) 1192–1200. [DOI] [PMC free article] [PubMed] [Google Scholar]
- Prescher, G. , Bornfeld, N. , Horsthemke, B. , Becher, R. , 1992. Chromosomal aberrations defining uveal melanoma of poor prognosis. Lancet 339, (8794) 691–692. [PubMed] [Google Scholar]
- Press, J.Z. , 2008. Xenografts of primary human gynecological tumors grown under the renal capsule of NOD/SCID mice show genetic stability during serial transplantation and respond to cytotoxic chemotherapy. Gynecol. Oncol. 110, (2) 256–264. [DOI] [PubMed] [Google Scholar]
- Reyal, F. , 2012. Molecular profiling of patient-derived breast cancer xenografts. Breast Cancer Res. 14, (1) R11 [DOI] [PMC free article] [PubMed] [Google Scholar]
- Rigaill, G. , 2010. Pruned Dynamic Programming for Optimal Multiple Change-point Detection ArXiv; (e-prints) [Google Scholar]
- Rubio-Viqueira, B. , 2006. An in vivo platform for translational drug development in pancreatic cancer. Clin. Cancer Res. 12, (15) 4652–4661. [DOI] [PubMed] [Google Scholar]
- Servant, N. , 2010. EMA – a R package for easy microarray data analysis. BMC Res. Notes 3, 277 [DOI] [PMC free article] [PubMed] [Google Scholar]
- Smyth, G.K. , 2004. Linear models and empirical Bayes methods for assessing differential expression in microarray experiments. Stat. Appl. Genet. Mol. Biol. 3, p. Article 3 [DOI] [PubMed] [Google Scholar]
- Smyth, G.K. , 2005. Limma: linear models for microarray data. In Dans R., Gentleman V., Carey S., Dudoit W.H.R.(Eds.), Bioinformatics and Computational Biology Solutions Using R and Bioconductor s.l.: Springer; 397–420. [Google Scholar]
- Subramaniam, M.M. , 2006. Tissue microarray profiling of primary and xenotransplanted synovial sarcomas demonstrates the immunophenotypic similarities existing between SYT-SSX fusion gene confirmed, biphasic, and monophasic fibrous variants. Virchows Arch. 449, (4) 435–447. [DOI] [PubMed] [Google Scholar]
- Trolet, J. , 2009. Genomic profiling and identification of high-risk uveal melanoma by array CGH analysis of primary tumors and liver metastases. Invest. Ophthalmol. Vis. Sci. 50, (6) 2572–2580. [DOI] [PubMed] [Google Scholar]
- Van, C.D. , 2009. Frequent somatic mutations of GNAQ in uveal melanoma and blue naevi. Nature 457, (7229) 599–602. [DOI] [PMC free article] [PubMed] [Google Scholar]
- Van, C.D. , 2010. Mutations in GNA11 in uveal melanoma. N. Engl. J. Med. 363, (23) 2191–2199. [DOI] [PMC free article] [PubMed] [Google Scholar]
- Weber, J. , 2007. High-throughput simultaneous detection of point mutations and large-scale rearrangements by CE. Electrophoresis 28, (23) 4282–4288. [DOI] [PubMed] [Google Scholar]
- White, J.S. , 2006. Correlation of comparative genomic hybridization results of 100 archival uveal melanomas with patient survival. Cancer Genet. Cytogenet. 170, (1) 29–39. [DOI] [PubMed] [Google Scholar]
Associated Data
This section collects any data citations, data availability statements, or supplementary materials included in this article.
Supplementary Materials
Supplementary data
Figure 1S Example of MM066 SNP6.0 microarrays analyzes. Chromosomes 3, 6 and 8 are presented for MM066 patient and corresponding 3 passages available for this model. For each chromosome, the four samples are overlapping according a color code. At the top is presented the copy number and at the bottom the corresponding status (normal, gain or loss). Black: MM066 patient (P0), Green: MM066 passage 1 (P1), Pink: MM066 passage 4 (P4), Yellow: MM066 passage 9 (P9).