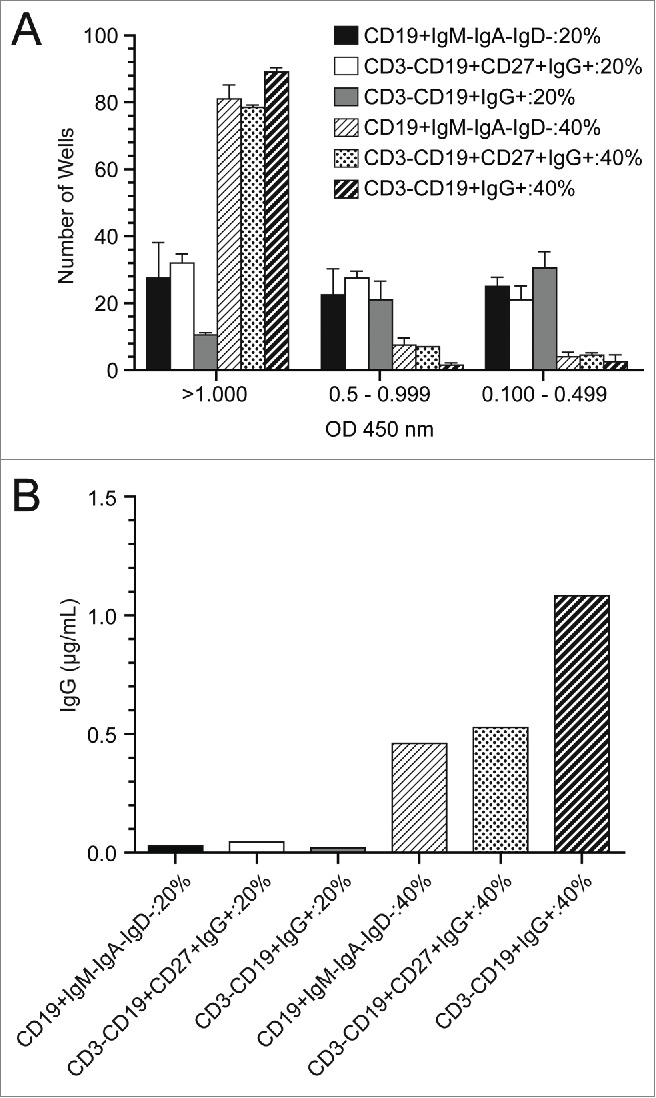
Figure 4.

Optimization of single memory B ELISPOT assays (A) Single B cells were sorted using a number of different flow cytometric staining panels and capture media with either 20% or 40% addition of fetal bovine serum. Cells were cultured for 14 d in the presence of IL-21 and feeder cells expressing huCD40L. Bars (mean with SD) indicate the number of wells out of a 96-well plate that resulted in expression of IgG as measured by a total IgG ELISA. Results are grouped into a high (>1 .000), medium (0.5–0.999) and low (0.100–0.499) optical density readouts. (B) Supernatants from 2 96-well plates for each condition were pooled and assayed for IgG concentration in an ELISA assay.
