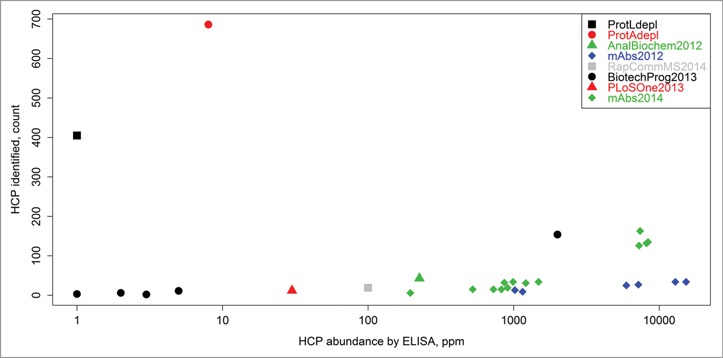
Figure 2.

Counts of HCP identities versus total HCP content (ppm measurement by ELISA) as reported herein, as well as in previous LC-MS-based HCP studies. The previous works are labeled as follows: AnalBiochem2012,5 mAbs2012,11 RapCommMS2014,14 BiotechProg2013,4 PLoSOne2013,10 and mAbs2014.6 “ProtAdepl” and “ProtLdepl” represent the highest counts of HCPs identified in this report by either Protein A or Protein L depletion, respectively. The methodology presented in this article was able to detect ∼100 times more HCPs compared to other techniques that analyzed samples with low starting HCP concentrations (< 10 ppm range).
