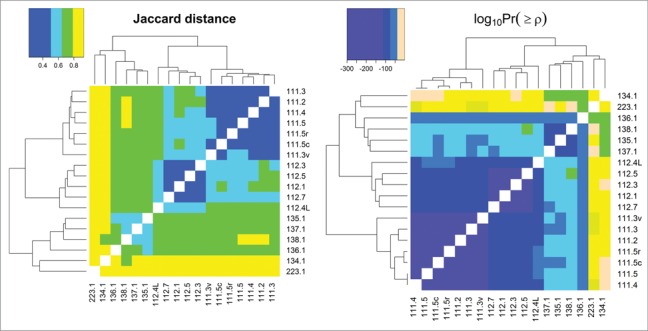
Figure 4.

Jaccard distances and log base 10 of statistical significances of Spearman correlations between all samples analyzed in this study. Pairwise comparisons that have darker shades of purple have more HCP overlap (as seen in the Jaccard distance heat map) and are more significantly correlated with respect to individual protein abundances (as seen in the log10Pr(≥ρ) heat map); those that are more peach-colored, have less overlap and are less correlated, respectively.
