

Abstract
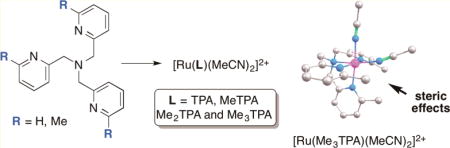
Four complexes of the general formula [Ru(L)(CH3CN)2](PF6)2, [L = TPA (5), MeTPA (6), Me2TPA (7), and Me3TPA (8)] [TPA = tris[(pyridin-2-yl)methyl]amine, where methyl groups were introduced consecutively onto the 6-position of py donors of TPA, were prepared and characterized by various spectroscopic techniques and mass spectrometry. While 5 and 8 were isolated as single stereoisomers, 6 and 7 were isolated as mixtures of stereoisomers in 2:1 and 1.5:1 ratios, respectively. Steric effects on ground state stability and thermal and photochemical reactivities were studied for all four complexes using 1H NMR and electronic absorption spectroscopies and computational studies. These studies confirmed that the addition of steric bulk accelerates photochemical and thermal nitrile release.
Graphical abstract
INTRODUCTION
Compounds that undergo photochemical cleavage reactions have important applications in materials science,1 chemistry, and biology.2 The binding of compounds to photolabile protecting groups, also known as photocaging, gives researchers the ability to achieve spatial and temporal control over release of an active agent using light. For decades, chemists have employed organic protecting groups as photocages.3,4 More recently, metal complexes have become an important class of photocaging groups.5 Metal complexes hold several advantages over their organic counterparts. An important aspect is that their photochemistry can be tuned over a broad range of the visible spectrum by manipulating the ancillary ligands.6,7 Metal complexes also bind to functional groups that cannot be caged with organic fragments, including nitrogen-containing heterocycles,8–15 thioethers16–18 and nitriles.19–28 Thus, metal complexes offer an orthogonal approach to organic caging methods.
Nitriles are a robust pharmacophore found in many biologically active compounds, including over 30 drugs currently used in the clinic.29 Despite their prevalence in biological tools and drugs, nitriles are a functional group that to date cannot be protected with an organic fragment. Thus, metal complexes are the only option for photocaging nitriles, and represent an attractive target for further development. Seminal studies established that the caging group Ru(bpy)2 (bpy =2,2′-bipyridine) can be used to cage 5-cyanouracil (5CNU), a cytotoxic agent that inhibits pyrimidine catabolism in vivo.20 Later work showed that [Ru(tpy)(5CNU)3]2+ (tpy = 2,2′:6′,2″-terpyridine) releases the same agent in cervical cancer cells when irradiated with visible light.23 In addition, the Ru(bpy)2 photocaging group was applied to a series of nitrile-based protease inhibitors, initiating enzyme inhibition against purified cysteine cathepsins only upon photoactivation, as well as cathepsin activities in lysates and live cells.21,24,30,31
Pioneering work in neuroscience demonstrated that ruthenium complexes can be used to cage neurotransmitters without causing toxicity.8,32–34 Since then, most efforts in developing ruthenium-based photocaging groups focused on planar, heteroaromatic ligands similar to bpy, where ancillary ligands are typically bi- or tridentate possess denticities of three or below. We recently reported that a ruthenium fragment based on the tetradentate ligand tris[(pyridin-2-yl)methyl]-amine (TPA, Figure 1) is an effective photocaging group for nitriles.25 Even though the Ru(TPA) motif had been investigated in photochemical molecular machines and switches,35–38 oxidation39–49 and hydrogenation50 catalysts, DNA metallointercalators,51 and for proton-coupled electron transfer properties,52–56 its behavior as a photocaging group had only been investigated for release of nitric oxide.57 Gratifyingly, Ru(TPA) showed promising activity as a caging group for nitriles, including stability in buffer and high selectivity for enzyme inhibition under dark versus light conditions. We also disclosed a solid-phase method that can be used to synthesize and screen derivatives of TPA as ligands for ruthenium caging groups to rapidly assess effects of the ancillary ligand on tuning spectral properties and photoreactivity for nitrile release.27
Figure 1.
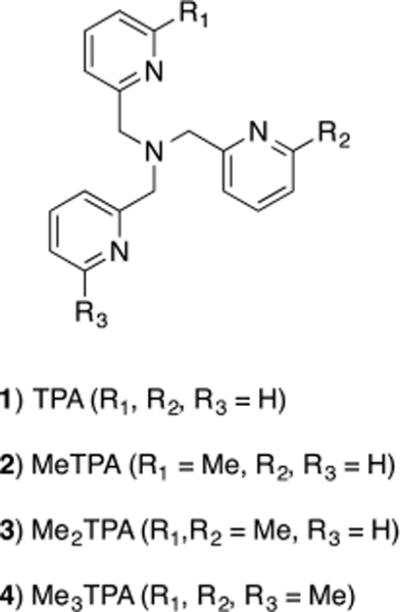
Structures of the tetradentate ligands TPA (1), MeTPA (2), Me2TPA (3), and Me3TPA (4).
Beyond tuning the identity of the donor atom or increasing conjugation, steric effects are known to control photochemical reactivity in ruthenium complexes. The introduction of steric bulk is used to distort the octahedral field, lower the bond dissociation energy and bring dissociative triplet metal-centered (3MC) states closer in energy to triplet metal-to-ligand charge transfer (3MLCT) states, which are generated by photoexcitation.16 Thus, more efficient photodissociation can occur in distorted complexes. For example, sterically encumbered analogs of bpy, such as 6,6′-dimethyl-2,2′-bipyridine, undergo efficient release from ruthenium complexes upon irradiation with visible light, which opens coordination site for DNA binding.58 More recently, steric effects have also been used to increase the quantum yields of monodentate pyridine release from ruthenium caging groups.12,59 Given the success already demonstrated in these reports, we hypothesized that introducing steric bulk could prove favorable in controlling the photoreactivity of Ru(TPA) complexes. However, steric effects on photodissociation have not been investigated systematically in these complexes, including studies geared toward controlling efficiency of ligand release.
In this Article, we report a systematic study to determine the role of steric effects in Ru(TPA) and related complexes used to cage the model nitrile CH3CN. Four complexes were synthesized and characterized structurally and photochemically, where methyl groups were introduced consecutively onto the 6-position of the pyridine donors. In addition, calculations were used to gain insight into ground state stabilities as well as the thermal and photochemical reactivities. These studies confirm that steric effects can facilitate nitrile release, both from the ground state and from excited states accessed by photoexcitation.
EXPERIMENTAL SECTION
General Considerations
NMR spectra were recorded on a Varian FT-NMR Mercury-400 MHz spectrometer. Mass spectra were recorded on a Time-of-Flight Micromass LCT Premier XE Spectrometer. IR spectra were recorded on a Nicolet FT-IR spectrophotometer (KBr pellet). UV–vis spectra were recorded on a Varian Cary 50 spectrophotometer. All reactions were performed under ambient atmosphere unless otherwise noted. Anaerobic reactions were performed by purging the reaction solutions with Ar or N2. Ligands 1–460 and complex [Ru(TPA)(CH3CN)2](PF6)2 (5)25 were synthesized according to literature procedures.
Synthesis of Ru Complexes
[Ru(MeTPA)(CH3CN)2](PF6)2 (6)
A pressure flask was charged with cis-[RuCl2(Me2SO)4] (30 mg, 0.062 mmol), MeTPA ligand (19 mg, 0.062 mmol) and MeOH (6 mL). The solution was deoxygenated by bubbling Ar through a submerged needle for 15 min, sealed and refluxed at 70 °C for 4 h under inert atmosphere during which time the reaction color changed from pale yellow to dark yellow. The reaction mixture was cooled to RT and concentrated in vacuo to give a dark yellow solid. The crude reaction mixture containing [Ru(MeTPA)(DMSO)Cl)]Cl (34 mg, 0.062 mmol), as 2:1 mixture of stereoisomers, was dissolved in a 1:1 mixture of H2O and CH3CN (6 mL) under argon atmosphere and the resulting solution was refluxed at 80 °C for 16 h under inert atmosphere. Ice cold water (5 mL) was added to the reaction mixture followed by a saturated solution of aqueous NH4PF6 (2 mL), resulting in a pale yellow precipitate that was isolated by centrifugation, washed with ice-cold H2O and dried under reduced pressure to get the title complex as a yellow solid (45 mg, 0.058 mmol) obtained as a 2:1 mixture of two isomers in 94% overall yield. 1H NMR (400 MHz C3D6O): δ 9.37 (d, 2H, J = 5.7 Hz), 9.07 (d, 2H, J = 5.7 Hz), 8.90 (d, 2H, J = 5.7 Hz), 7.95–7.86 (m, 5H), 7.82 (t, 2H, J = 7.7 Hz), 7.75–7.65 (m, 4H), 7.62 (d, 2H, J = 5.7 Hz), 7.55 (t, 1H, J = 7.7 Hz), 7.51–7.43 (m, 4H), 7.42–7.35(m, 6H), 7.26(d, 2H, J = 7.7 Hz), 7.04 (d, 1H, J = 7.7 Hz), 5.44–5.36 (m, 6H), 5.26–5.18 (m, 6H), 5.00–4.83 (m, 6H), 3.13 (s, 3H), 2.97 (s, 6H), 2.88 (s, 6H), 2.86 (s, 3H), 2.55 (s, 3H), 2.54 (s, 6H). IR (KBr) νmax (cm−1): 3854, 3839, 3801, 3750, 3675, 3649, 3421, 2934, 2853, 2279, 1734, 1707, 1610, 1575, 1508, 1460, 1386, 1312, 1226, 1167, 1039, 995, 839, 788, 772, 739. ESMS calcd for C23H26N6Ru (M+2): 244, found 244. UV–vis (acetonitrile): λmax = 370 (ɛ = 10 000 M−1cm−1). Anal. Calcd for C23H26F12N6P2Ru (6·2.5 H2O): C, 33.59; H, 3.80; N, 10.22. Found: C, 33.35; H, 3.41; N, 10.49.
[Ru(Me2TPA)(CH3CN)2](PF6)2 (7)
Complex 7 was synthesized using the same method as with 6, starting from Me2TPA (33 mg, 0.103 mmol). After 2 steps, 7 was obtained as a 1.5:1 mixture of two isomers in 89% overall yield (73 mg, 0.092 mmol). 1H NMR (400 MHz C3D6O): δ 9.61 (d, 1.5H, J = 5.6 Hz), 9.03 (d, 1H, J = 5.6 Hz), 7.89–7.84 (m, 2H), 7.79–7.71 (m, 5H), 7.62–7.55 (m, 2H), 7.51 (d, 1H, J = 7.6 Hz), 7.46 (d, 3H, J = 7.6 Hz), 7.43–7.39 (m, 2.5H), 7.32–7.29 (m, 5H), 7.26 (d, 1H, J = 7.6 Hz), 7.10 (d, 1H, J = 7.6 Hz), 5.49–5.39 (m, 5H), 5.22–5.17 (m, 5H), 4.94 (d, 1H, J = 17.9 Hz), 4.90 (s, 3H), 4.76 (d, 1H, J = 17.9 Hz), 3.18 (s, 3H), 2.97 (s, 3H), 2.92 (s, 7.5H), 2.90 (s, 9H), 2.59 (s, 4.5H), 2.55 (s, 3H). IR (KBr) νmax (cm−1): 3854, 3839, 3737, 3676, 3402, 2940, 2281, 1992, 1735, 1716, 1610, 1574, 1508, 1461, 1438, 1386, 1354, 1271, 1233, 1171, 1096, 1037, 998, 970, 839, 789, 770, 739, 644, 611. ESMS calcd for C24H28N6Ru (M+2): 251, found 251. UV–vis: λmax (acetonitrile) = 365 (ɛ = 9700 M−1cm−1). Anal. Calcd for C24H28F12N6P2Ru: C, 36.42; H, 3.57; N, 10.62. Found: C, 36.46; H, 3.58; N, 10.38.
[Ru(Me3TPA)(CH3CN)2](PF6)2 (8)
A pressure flask was charged with cis-[RuCl2(Me2SO)4] (30 mg, 0.062 mmol) and ligand 4 (21 mg, 0.062 mmol) in dry EtOH (5 mL) was deoxygenated by bubbling Ar through a submerged needle for 10 min in a sealable tube. The reaction mixture was sealed and refluxed for 18 h at 90 °C under Ar atmosphere. The reaction mixture was cooled to RT and concentrated in vacuo, giving a mixture of [Ru(Me3TPA)Cl(Me2SO)]Cl complexes, as judged by 1H NMR and UV–vis spectroscopic analysis of the crude reaction mixture. The crude mixture was dissolved in a 1:1 mixture of H2O and CH3CN (5 mL) and the resulting solution was heated under argon atmosphere to reflux at 80 °C for 18 h. After the mixture was cooled to RT, Ar was flowed over the mixture for 1 h to expel acetonitrile. The reaction mixture was transferred to a solution of NH4PF6 at 0 °C (15 mL), resulting in formation of a pale yellow precipitate that was isolated by centrifugation. The pellet was washed several times with cold water. After drying in vacuo, complex 8 was isolated as a yellow solid (42 mg, 84%). Crystals suitable for X-ray crystallographic analysis were obtained by diffusing Et2O into a solution of 8 in MeCN: mp =220 °C (decomp). 1H NMR (400 MHz C3D6O): δ 7.79 (t, 2H, J = 7.7 Hz), 7.58 (t, 1H, J = 7.7 Hz), 7.45 (d, 2H, J = 7.7 Hz), 7.35 (d, 2H, J = 7.7 Hz), 7.29 (d, 1H, J = 7.7 Hz), 7.11 (d, 1H, J = 7.7 Hz), 5.49 (part of an AB system, 2H, JAB = 15.6 Hz), 5.17 (part of an AB system, 2H, JAB = 15.6 Hz), 4.82 (s, 2H), 3.35 (s, 3H), 2.97 (s, 6H), 2.94 (s, 3H), 2.60 (s, 3H). IR (KBr): νmax (cm−1) 3903, 3854, 3839, 3821, 3802, 3751, 3735, 3677, 3567, 3261, 3005, 2941, 2361, 1772, 1699, 1611, 1575, 1541, 1522, 1508, 1473, 1458, 1396, 1355, 1238, 1222, 1174, 1098, 1034, 992, 969, 838, 790, 739, 644, 612. ESMS calcd for C25H30N6Ru (M+2): 258, found 258. UV–vis: λmax (acetonitrile) = 360 (ɛ = 5600 M−1 cm−1). Anal. Calcd for C25H30F12N6P2Ru: C, 37.28; H, 3.75; N, 10.43. Found: C, 37.51; H, 3.84; N, 10.38.
Photochemistry
Photolysis and ligand exchange quantum yield experiments were performed with a 150 W Xe arc lamp (USHIO) contained in a MilliArc lamp housing unit and powered by an LPS-220 power supply equipped with an LPS-221 igniter (PTI). A 395 nm long pass filter (CVI Melles Griot) was used for the photolysis experiments, and a 400 nm bandpass filter (Thorlabs) with a 335 nm long-pass filter were used together for the ligand exchange quantum yield experiments. The samples were dissolved in either CH2Cl2 with 10 mM Bu4NCl or H2O with <5% acetone. Potassium tris(ferrioxalate) was used as the chemical actinometer to determine the photon flux of the lamp with λirr = 400 nm (2.1 × 10⁻⁸ mol photons/min).61 For NMR studies, solutions of 5 and 6 in CD3CN (3 mM) were dried with 4 Å molecular sieves. After filtration, solutions were irradiated in NMR tubes with a long wave UV TLC lamp (8W, 365 nm) at a distance of 13 cm from the lamp to the tubes, and 1H NMR spectra were recorded at 1 h intervals from t = 0–5 h. To analyze the photoproducts of 6 by NMR, the complex was dissolved in CD3OD to ~3 mM and irradiated (150 W Xe arc lamp, λirr ≥ 395 nm selected using a long-pass filter). The 1H NMR spectra were collected using a Bruker 400 MHz DPX spectrophotometer. The resulting photoproduct was isolated by drying the sample in the NMR tube with air to remove the CD3OD solvent, then CD3CN was added to the dried sample in the NMR tube and the solution was kept in the dark by wrapping the tube in aluminum foil, and the NMR spectrum was collected after 16 h. To analyze the chloride-bound samples, 6 was irradiated in CD3OD as described above, then ~10 mg of CaCl2 was added to the solution. The sample was wrapped in aluminum foil and kept in the dark overnight to allow the exchange of Ru-bound CD3OD for Cl−, and the NMR spectrum was collected after 16 h.
Computational Details
Electronic structure calculations were carried out with the Gaussian09 software package62 using the BP86 density functional.63,64 The SDD basis set and effective core potential65,66 were used for Ru atom and the 6-31G(d) basis set67,68 was used for the other atoms. Solvation effects in acetonitrile were incorporated by using the implicit SMD solvation model69 and were included during structure optimization. All of the optimized structures were confirmed as minima by harmonic vibrational frequency calculations and the converged wave functions were tested for the SCF stability. The triplet metal-centered states (3MC) were fully optimized using the SCF method. The 3MC states have been modeled as five-coordinate Ru complexes. The identities of the 3MC electronic configurations were confirmed by S2 expectation values ⟨S2⟩ and by plots of the spin density (isovalue = 0.004 au, visualized using GaussView70). TD-DFT calculations71,72 were performed in dichloromethane solvent with the same density functional and basis sets using ground state geometries to characterize the photoproduct from complex 5. The electronic transitions were checked by visualizing the canonical orbitals (isovalue = 0.05 au) using GaussView. To explore the potential energy surfaces for CH3CN dissociation from Ru complexes, relaxed potential energy surface scans were performed by stretching the Ru–NCCH3 bond and optimizing the remaining coordinates.
RESULTS AND DISCUSSION
Synthesis
Complexes for our study were synthesized starting from the known tetradentate ligands tris[(pyridin-2-yl)methyl]amine (TPA, 1), [(6-methylpyridin-2-yl)methyl]bis-[(pyridin-2-yl)methyl]amine (MeTPA, 2), bis[(6-methylpyridin-2-yl)methyl][(pyridin-2-yl)methyl]amine (Me2TPA, 3), and tris[(6-methylpyridin-2-yl)methyl]amine (Me3TPA, 4).60 Treating ligands 1–3 with 1 equiv of cis-[RuCl2(Me2SO)4] in MeOH at 70 °C for 4 h, followed by concentration resulted in the metalation and afforded mixtures of [Ru(L)Cl(Me2SO)]Cl complexes, where L = 1–3.73 Heating each of these mixtures of complexes in 1:1 CH3CN/H2O at 80 °C for 16 h, followed by precipitation with NH4PF6 gave [Ru(TPA)(CH3CN)2](PF6)2 (5), [Ru(MeTPA)(CH3CN)2](PF6)2 (6), and [Ru(Me2TPA)-(CH3CN)2](PF6)2 (7) as yellow solids, in yields ranging from 48% to 94%. Complex 5 was isolated as a single isomer, whereas complexes 6 and 7 were obtained as 2:1 and 1.5:1 mixtures of stereoisomers, respectively. Structural assignments for major and minor isomers of 6 and 7 are provided below. Applying the same two-step procedure to the ligand Me3TPA resulted in <20% conversion, as judged by 1H NMR spectroscopic analysis, with the remainder of the material being unreacted ligand 4. Further inspection of each step confirmed that metalation of 4 with cis-[RuCl2(Me2SO)4] was significantly slower than with ligands 1–3, and thus would require more forcing conditions. Heating ligand 4 at 90 °C with 1 equiv of cis-[RuCl2(Me2SO)4] in EtOH for 18 h led to higher conversion to [Ru(Me3TPA)Cl(Me2SO)]Cl, which proceeded readily to form [Ru(Me3TPA)(CH3CN)2](PF6)2 (8) upon heating in 1:1 CH3CN/H2O at 80 °C for 18 h, followed by precipitation with NH4PF6. Using these optimized conditions, complex 8 was isolated in 84% overall yield in 2 steps from 4.
X-ray Crystallographic Studies
Complexes 5 and 8 were characterized by X-ray crystallography. Diffusion of Et2O into a solution of 5 or 8 in CH3CN furnished small yellow blocks suitable for X-ray crystallographic analysis. Parameters of data collections are described in Table 1. Tables 2 and 3 describe selected bond distances and bond angles, respectively.
Table 1.
X-ray Crystallographic Data for 525 and 8
| [Ru(TPA)(CH3CN)2] (PF6)2 (5) | [Ru(Me3TPA)(CH3CN)2] (PF6)2 (8) | ||
|---|---|---|---|
| empirical formula | C49.50H57F24N15.50P4Ru2 | C27H33F12N6.50P2Ru | |
| formula weight | 1651.12 | 839.61 | |
| crystal system | triclinic | monoclinic | |
| space group |
|
C12/c1 | |
| a (Å) | 12.1129(8) | 12.5538(11) | |
| b (Å) | 12.2928(8) | 12.7608(11) | |
| c (Å) | 21.8490(15) | 39.841(4) | |
| α (deg) | 94.436(3) | 90 | |
| β (deg) | 97.000(3)° | 93.501(3) | |
| γ (deg) | 91.324(3)° | 90 | |
| V (Å3) | 3217.7(4) | 6370.5(10) | |
| Z | 4 | 8 | |
| final R indices[I > 2σ(I)] | R1 = 0.0579, wR2 = 0.1853 | R1 = 0.0530, wR2 = 0.1239 | |
| R indices (all data) | R1 = 0.0771, wR2 = 0.1952 | R1 = 0.0543, wR2 = 0.1245 |
Table 2.
A Comparison of X-ray Data and DFT Calculations for Selected Bond Distances (Å) for 525 and 8
| bond | complex 5
|
complex 8
|
||
|---|---|---|---|---|
| X-ray data | DFT calcd | X-ray data | DFT calcd | |
| Ru1–N1 | 2.031(5) | 2.007 | 2.064(2) | 2.017 |
| Ru1–N2 | 2.062(4) | 2.087 | 2.128(3) | 2.158 |
| Ru1–N3 | 2.053(4) | 2.095 | 2.055(2) | 2.093 |
| Ru1–N4 | 2.071(4) | 2.085 | 2.125(3) | 2.162 |
| Ru1–N5 | 2.056(4) | 2.064 | 2.130(2) | 2.156 |
| Ru1–N6 | 2.037(5) | 2.020 | 2.028(2) | 1.999 |
Table 3.
Comparison of X-ray Data and DFT Calculations for Selected Bond Angles (deg) for 525 and 8
| bond angle | complex 5
|
complex 8
|
||
|---|---|---|---|---|
| X-ray data | DFT calcd | X-ray data | DFT calcd | |
| N1–Ru1–N2 | 96.4(2) | 98.3 | 96.1(1) | 100.3 |
| N1–Ru1–N4 | 99.5(2) | 98.3 | 101.6(1) | 97.9 |
| N1–Ru1–N5 | 93.9(2) | 95.3 | 104.9(1) | 101.7 |
| N1–Ru1–N6 | 88.8(2) | 87.3 | 79.9(1) | 83.8 |
| N2–Ru1–N3 | 81.7(2) | 81.5 | 80.4(1) | 82.7 |
| N2–Ru1–N5 | 90.4(2) | 90.3 | 89.9(1) | 85.9 |
| N2–Ru1–N6 | 89.1(2) | 90.0 | 91.7(1) | 89.5 |
| N3–Ru1–N4 | 82.6(2) | 82.0 | 81.9(1) | 78.9 |
| N3–Ru1–N5 | 82.6(2) | 82.6 | 83.4(1) | 82.0 |
| N3–Ru1–N6 | 94.8(2) | 94.8 | 92.0(1) | 92.8 |
| N4–Ru1–N5 | 90.0(2) | 88.2 | 87.4(1) | 94.8 |
| N4–Ru1–N6 | 89.7(2) | 90.8 | 89.5(1) | 88.1 |
Complex 5 crystallized in the triclinic space group with Z = 4.74 Two nearly identical dications of [Ru(TPA) (CH3CN)2]2+ are located in the asymmetric unit. Because of their similarity, structural parameters for only one of the two dications are described herein; parameters for the second dication can be found in the Supporting Information. The coordination environment around the ruthenium center in the dication [Ru(TPA) (CH3CN)2]2+ (Figure 2A) possesses a distorted octahedral geometry, with bond angles ranging from 81.7(2)° to 99.5(2)°. The two bound CH3CN ligands are in different chemical environments, with one CH3CN group cis and one trans to the basic nitrogen donor N3. Despite this fact, the Ru1–N1 and Ru1–N6 bond distances to nitrile are identical within error at 2.031(5) and 2.037(5) Å, respectively. Ruthenium–nitrogen bond distances to the three pyridine donors and one basic nitrogen (N2–N5) range only slightly from 2.053(4) to 2.071(4) Å.
Figure 2.
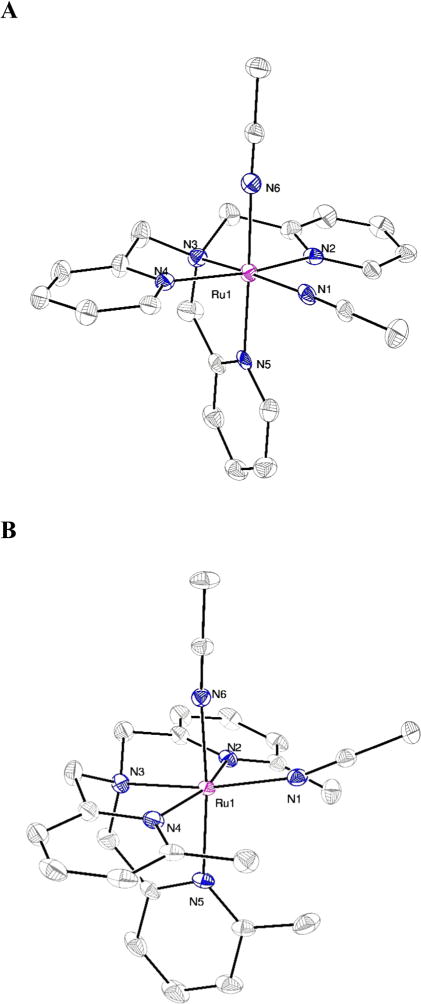
ORTEP diagrams of the dication [Ru(TPA)(MeCN)2]2+ from compound 5 (A)25 and [Ru(Me3TPA)(MeCN)2]2+ from compound 8 (B). Thermal ellipsoids are shown at 50% probability. Hydrogen atoms are omitted for clarity.
Complex 8 crystallized in the monoclinic space group C12/c1 with Z = 8. Data for the two dications in the asymmetric unit were similar, thus data for only one of the two are presented in Tables 2 and 3 and Figure 2B. Similar to 5, the dication [Ru(Me3TPA)(CH3CN)2]2+ of 8 possesses a distorted octahedral geometry. Most of the bond angles in 8 are in good agreement with angles observed in 5, varying by only three degrees, with the exception of angles involved with the nitrile donors. As shown in Figure 2B, introduction of the methyl groups into the ligand results in a severe distortion of the N1–Ru1–N5 bond angle to 104.9(1)°, as compared with the same three atoms of 5, which showed a bond angle of only 93.9(2)°. This distortion results in a contraction of the bond angle between the two nitrile donors in 8, with N1–Ru1–N6 equal to 79.9(1)°, as compared to 88.8(2)° for 5. As opposed to 5, bond distances to the two nitriles of 8 are not identical within error. The Ru1–N1 distance of 2.064(2) Å of 8 is considerably longer than the Ru1–N6 distance of 2.028(2) Å, presumably because of steric crowding by the three methyl groups present on the ligand Me3TPA. As expected, ruthenium bond distances to the three pyridine N-donors in 8 (N2, N4 and N5) are also considerably longer than those observed for 5, ranging from 2.125(3) to 2.130(2) Å.
Electronic Absorption Data
Complexes 5–7 show maxima in acetone, DMSO, and CH3CN ranging from 365 to 380 nm, consistent with metal-to-ligand charge transfer (MLCT) bands. The spectra of these complexes are largely independent of solvent, consistent with the [Ru(L)-(CH3CN)2]2+ dications remaining intact in weakly and strongly coordinating solvents, where L = 1–3. In contrast, spectra for 8 become broader in acetone and DMSO relative to CH3CN, with increased absorbance at wavelengths >400 nm, consistent with dynamic behavior between [Ru(Me3TPA)(CH3CN)2]2+ and solvent. Exchange of bound CH3CN groups with solvents was explored further with 1H NMR spectroscopic analysis.
1H NMR Spectroscopic Data
1H NMR spectroscopic analysis was used to gain further insight into the structures of complexes 5–8 in solution, and to measure ratios of isomers for compounds 6 and 7. 1H NMR spectroscopic analysis of complex 5 in acetone-d6/D2O (9:1) indicated the presence of two distinct CH3CN ligands, with singlets at 2.88 and 2.47 ppm, consistent with the structure shown in Figure 2A with one CH3CN group cis and one CH3CN trans to the basic nitrogen of TPA. The CH3CN group containing N6 is assigned as the farthest upfield signal at 2.47 ppm, based on NOESY data.25 This structural assignment is further supported by the fact that an upfield shift is expected for this CH3 group, due to shielding effects of the two cis-pyridine rings’ π-systems. Doublets at 9.18 and 8.83 ppm, integrating for 1 and 2 protons, respectively, are assigned as resonances belonging to the 6-pyridyl C–H protons of TPA based on their downfield nature and 5.9 Hz coupling constants.75 These data are consistent with [Ru(TPA)-(CH3CN)2]2+ containing a plane of symmetry where two pyridyl groups are equivalent (see pyridine rings containing N2 and N4 donors, Figure 2A). In addition, two doublets and one singlet, each integrating for two protons, are observed between 5.25 and 4.86 ppm. 1H COSY analysis indicates coupling between doublets at 5.25 and 5.15 ppm. With coupling constants of 15.6 Hz observed by 1H NMR spectroscopy, which are in the range for geminal coupling, these protons are assigned as two CH2 units, related by the plane of symmetry, each possessing diasterotopic protons. The last singlet present at 4.86 ppm is assigned to a CH2 unit with equivalent protons. In this case, the plane of symmetry passing through the pyridine and two MeCN ligands bisects the two protons, making them equivalent by symmetry so geminal coupling is not observed.
Spectral data from 5 were used to assign the structures of major and minor isomers for 6 and 7, based on the aforementioned considerations of symmetry. Ruthenium complexes derived from MeTPA were isolated as a 2:1 mixture of stereoisomers, complexes 6a and 6b, respectively. The spectrum of 6a and 6b in acetone-d6 shows three doublets that are furthest downfield from 9.4 to 8.8 ppm, which are assigned as 6-pyridyl C–H protons based on arguments presented with 5. The major isomer 6a contains pyridine donors that are nonequivalent by symmetry. Thus, two signals are observed. In the minor isomer 6b, the two pyridyl donors are equivalent by symmetry, thus only one signal at 9.05 ppm is observed. In addition, the methyl group present in 6a breaks the plane of symmetry observed with 5, making each of the three CH2 units nonequivalent, giving 6a a total of 6 diasterotopic protons that are evident in the spectrum from 5.5 to 4.7 ppm. Complexes derived from Me2TPA were isolated as a 1.5:1 mixture, complexes 7a and 7b, respectively. The major isomer 7a shows a 6-pyridyl C–H resonance at 9.6 ppm, whereas the minor isomer 7b shows a resonance at 9.05 ppm. Two doublets and a singlet are observed as major peaks in the region from 5.5 to 4.6 ppm, consistent with the plane of symmetry present in 7a. Signals for the six diasterotopic protons belonging to the CH2 units of 7b are observed as minor peaks. In both cases, placing the 6-methylpyridyl group in the axial position leads to the least stable isomer. These product ratios are in good agreement with DFT calculations that measured relative thermodynamic stabilities for 6a/b and 7a/b (vide infra).
1H NMR spectra were recorded for the Me3TPA complex 8 in multiple solvents. In acetone-d6, complex 8 displays many of the same features present in 5, including 3-, 4-, and 5-pyridyl C–H protons present in a 2:1 ratio from 7.8 to 7.05 ppm, as well as two doublets and a singlet present from 5.5 to 4.7 ppm, assigned to the CH2 units. These data are consistent with the plane of symmetry present in 8. Resonances assigned to the 6-ethylpyridyl groups are located at 3.35 and 2.97 ppm, integrating for 3 and 6 protons, respectively. Resonances assigned to the bound CH3CN groups occur at 2.94 and 2.60 ppm, with one upfield and one downfield signal, the same as observed with 5. Interestingly, the signal for the downfield CH3CN group is not evident in the spectrum of 8 recorded in CD3CN. Immediately upon dissolution of 8 in CD3CN, the resonance for the downfield N1 CH3CN group disappears and a strong peak at 2.05 ppm is observed, consistent with free CH3CN. The signal for the upfield N6 CH3CN group at 2.4 ppm remains unchanged and does not decrease in intensity, even after storing in CD3CN solution for 18 h in the dark. These data are consistent with one CH3CN ligand (see N1, Figure 2B) undergoing facile exchange in coordinating solvents, whereas in weakly coordinating solvents, such as acetone-d6, the N1 CH3CN group remains bound.
Photochemical Studies
Photochemical studies were carried out with 5 and 6 in CH2Cl2 with 10 mM Bu4NCl and in aqueous solution. Control experiments using electronic absorption spectroscopy confirm that 5 and 6 are stable in the dark for over 1 h, whereas 7 and 8 show spectral changes over the same time period (Figures S4–6). These data are consistent with 7 and 8 showing a higher rate of thermal ligand exchange than 5 and 6, making photochemical release data for 7 and 8 difficult to investigate. Therefore, photochemical studies with 7 and 8 were not undertaken. The photoinduced reactions of 5 and 6 in CH2Cl2 with 10 mM Bu4NCl and in H2O (<5% acetone) were monitored by electronic absorption spectroscopy and the resulting spectra as a function of irradiation time are shown in Figures 4A and 4B, respectively (λirr ≥ 395 nm). The exchange of CH3CN for Cl− or H2O in 5 occurs with a decrease in the absorption feature at 375 nm and a concomitant increase in the peak at 475 nm with an isosbestic point at 398 nm in the Cl− system (Figure 4A), and an increase in the peak at 397 nm with an isosbestic point at 384 nm is observed in H2O (Figure 4C). The quantum yield for this ligand exchange in 5 was measured as 0.016(1) in CH2Cl2 with 10 mM Bu4NCl and 0.0090(2) in H2O (λirr = 400 nm). Similar irradiation of complex 6, which exists in two isomers (6a and 6b, Figure 5A), exhibits analogous spectral changes but no isosbestic point is observed in the electronic absorption spectra upon irradiation due to either the formation of more than one photoproduct or different rates of reaction of the two isomers (Figures 4B and 4D). The presence of two photoactive isomers of 6 in solution precludes measurement of an accurate quantum yield of ligand dissociation; however, an apparent quantum yield of 0.041(4) was determined by monitoring the decrease in absorbance of the reactant peak at 370 nm at early irradiation times (0–15 min) in CH2Cl2 with 10 mM Bu4NCl, and a value of 0.011(2) was measured in H2O using the same procedure (λirr = 400 nm). This increase in efficiency for 6a/b relative to 5 by addition of a methyl substituent is consistent with a stabilized 3MC state due to the addition of steric bulk, which distorts the pseudo-octahedral geometry around the Ru(II) center; this effect has been demonstrated in a variety of related Ru(II)-diimine complexes.76,77
Figure 4.
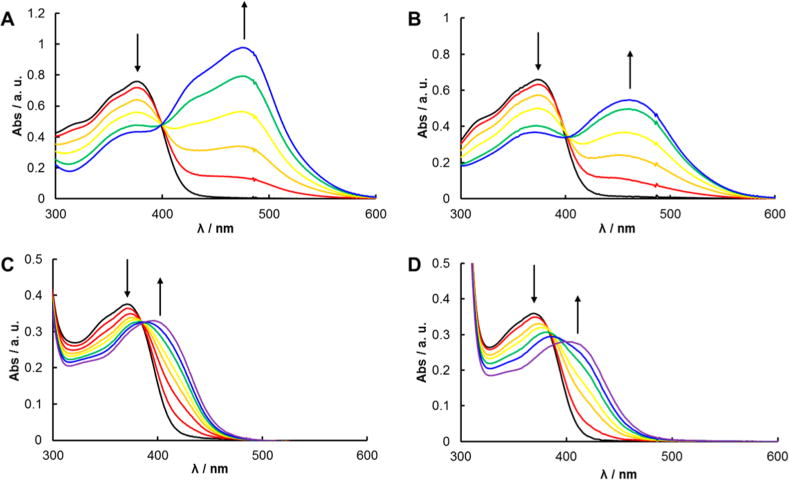
Electronic absorption spectra of 5 (A) and 6 (B) irradiated for 0–45 min with λirr ≥ 395 nm in CH2Cl2 with 10 mM Bu4NCl, and for 5 (C) and 6 (D) irradiated for 0–25 min with λirr ≥ 395 nm in H2O (<5% acetone).
Figure 5.
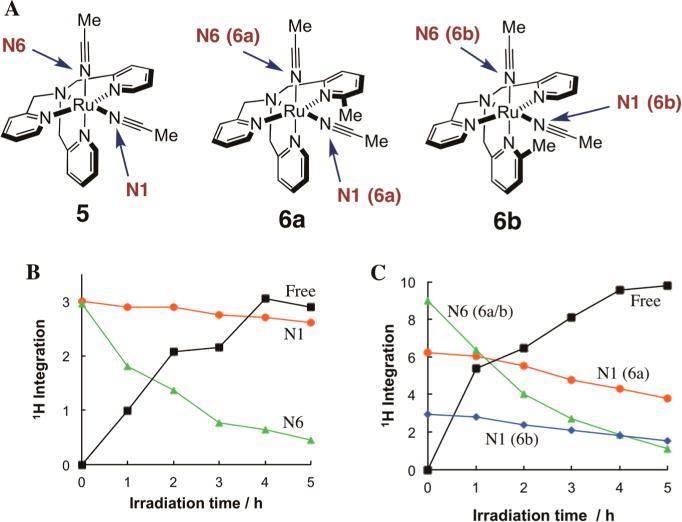
(A) Methyl proton labeling scheme for 5 and 6a–b. Plots of integration vs irradiation time in CD3CN with λirr = 365 nm determined by 1H NMR for (B) 5 (3 mM), Ru–N1 (red filled circle), Ru–N6 (green filled triangle), free CH3CN (black filled square), and (C) 6a/b (3 mM), Ru–N1 (6a) (red filled circle), Ru–N1 (6b) (blue filled diamond), Ru–N6 (6a) and Ru–N6 (6b) (green filled triangle), free CH3CN (black filled square).
To unequivocally gain structural information on the photoproducts, samples of 5 and 6a/b were photolyzed in CD3CN with λirr = 365 nm and monitored by 1H NMR spectroscopy. In addition to determination of the products following CH3CN ligand exchange, these experiments also provide evidence that no other photochemical pathways are operative in CD3CN (Figures S1–2). When a CH3CN ligand is exchanged for CD3CN, the electronic and chemical structures of the complex do not change, such that the signals for the protons of all remaining bound ligands on the complex remain unchanged. In this case, if no other photochemistry is taking place, then the only changes observed are the concomitant loss of the signal of the bound CH3CN ligand and the growth of that associated with free CH3CN. The labeling scheme for the CH3CN ligands and a plot of the integration of the CH3CN protons as a function of irradiation time are provided in Figure 5.
The sample for 5 consisted of a single isomer, whereas 6 was composed of the two isomers 6a and 6b in a 2:1 ratio, respectively. As expected from previous work with 5, the CH3CN ligand coordinated trans to a pyridine, labeled as N6 (Figure 5A), is exchanged for CD3CN much more facile exchange than the N1 CH3CN ligand (Figure 5B). For 6a/b (Figure 5C), the N6 acetonitrile ligands exchanged on a similar time scale to that observed with 5. However, the N1 CH3CN ligand for 6a/b underwent more rapid exchange than that observed for 5. This finding indicates that the placement of the methyl group on the TPA ligand generally increases the photolability of the CH3CN ligands.
The irradiation of the 2:1 mixture of 6a/6b in weakly coordinating CD3OD resulted in unexpected isomerization that provides an inversion of the isomer ratio. 1H NMR spectra of a solution of 6a/6b in CD3OD were recorded as a function of irradiation time (λirr ≥ 395 nm; Figure S7). Prior to photolysis, three doublets appear furthest downfield at 8.72 and 9.20 ppm, corresponding to the protons in the 6-position of the two inequivalent pyridyl rings in 6a, and at 8.91 ppm, corresponding to the protons in the 6-position of the two equivalent pyridyl rings in 6b (Figure S7A). The 2:1 6a:6b mixture of isomers is evident by the equal integrations of these three doublets. Upon irradiation, as free CH3CN appears along with the loss of bound CH3CN (Figure S7B), the three downfield doublets decrease in intensity while two new small doublets at 8.92 and 9.08 ppm and one large doublet at 9.11 ppm grow as a function of irradiation time (Figure S7A). The 1H NMR spectrum of the photoproduct is consistent with [Ru(MeTPA) (CH3CN)(CD3OD)]2+ in two different isomers, 6a-CD3OD or 6b-CD3OD, whose structures are depicted in Figure 6. The two small doublets, corresponding to 6a-CD3OD, integrate to one proton each, while the large doublet, corresponding the 6b-CD3OD, integrates to 4 protons; these integrations translate to a 1:2 ratio of 6a-CD3OD and 6b-CD3OD, respectively. It may be concluded from the change in distribution of isomers that a pyridyl arm of the MeTPA ligand is labile and is able to replace the weakly coordinated CD3OD ligand, as shown in Figure 6. Conversely, this process does not occur when the sample is irradiated in CD3CN, discussed above, because CD3CN is a much stronger ligand than CD3OD, such that it is not displaced by the pyridine arm of MeTPA.
Figure 6.
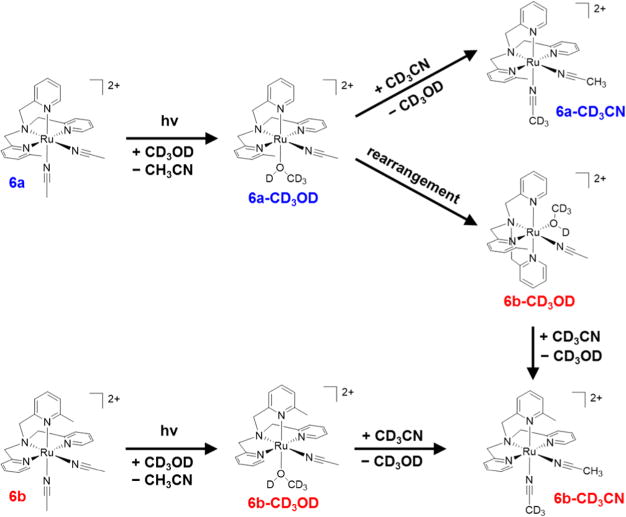
Scheme representing the photodissociation of CH3CN in 6a and 6b in CD3OD followed by removing the CD3OD solvent and redissolving in CD3CN.
To confirm the inversion of isomer distribution, the irradiated sample containing 6a-CD3OD and 6b-CD3OD was dried by removing the CD3OD solvent, and the product was dissolved in CD3CN. The CD3CN solvent displaced the weaker CD3OD ligand to provide [Ru(MeTPA)(CH3CN)-(CD3CN)]2+ (6a-CD3CN and 6b-CD3CN, Figure 6), which are expected to have identical chemical shifts in the aromatic region of the 1H NMR spectrum compared to 6a and 6b, but with different integrations as determined by the isomer ratio. These two spectra are compared in Figure S8, showing the initial 2:1 mixture of 6a and 6b in CD3CN and the 1:2 mixture of 6a-CD3CN and 6b-CD3CN products.
Analysis of the chloride-substituted [Ru(MeTPA)(CH3CN)-Cl]+ product (6a-Cl/6b-Cl) by 1H NMR was achieved by irradiation of 6a/6b in CD3OD with λ ≥ 395 nm until the CH3CN trans to py/Me-py was fully replaced by CD3OD, followed by addition of excess CaCl2, a CD3OD-soluble source of Cl− ions. The solution was allowed to react in the dark overnight, and the resulting NMR spectrum shows formation of 6a-Cl and 6b-Cl in a 1:2 isomer ratio, respectively (Figure S9). The two small doublets at 8.76 and 9.16 ppm correspond to the protons in the 6-position of the inequivalent pyridyl groups in 6a-Cl, and the large doublet at 8.95 ppm corresponds to the protons in the 6-position of the two equivalent pyridyl groups in 6b-Cl. The scheme depicting the photochemical release of CH3CN, rearrangement of the MeTPA ligand, and coordination of chloride is provided in Figure 7.
Figure 7.
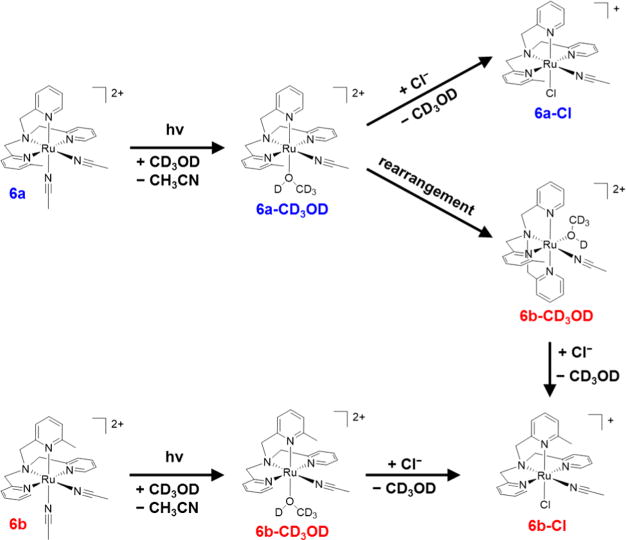
Schematic representation of the photosubstitution of CH3CN in complexes 6a and 6b in CD3OD followed by addition of Cl−.
COMPUTATIONAL CHEMISTRY
Calculated Structures and Energies
Calculations were carried out to gain insight into the structure and thermal reactivities of 5–8. As illustrated in Tables 2 and 3, the DFT-calculated structures are in good agreement with the X-ray crystallographic data for complexes 5 and 8. However, the agreement is not quantitatively accurate plausibly because of the lack of crystal packing effect in the calculated structures. Calculations were performed in order to understand the relative stabilities of the isomers of complexes 6 and 7 (Table S1, Figure S3). Compound 6a is found to be lower in energy (ΔE = 3.1 kcal/mol) than its isomer 6b, and 7a is calculated to be about 1 kcal/mol more stable than 7b. These results are consistent with the observations from the NMR data, which show 6a and 7a are the major isomers for complexes 6 and 7, respectively. Inspection of the molecular geometries shows that in complex 6a, the methyl group on the N2-pyridine moiety has one cis-pyridine group at the N5 position while the methyl group in 6b has two cis-pyridine groups at the N2 and N4 positions. Consequently, the methyl moiety in the former complex is embedded in an environment that is sterically less crowded than that in the latter compound. In addition, as displayed in Figure 8, there is an unfavorable steric interaction between the methyl moiety and the acetonitrile ligand at the N1 position in complex 6b. The acetonitrile ligand bends away from the methyl group to relieve this repulsion and, as a result, the angle N6–Ru–N1 is contracted to about 83.6° giving rise to a distorted octahedral geometry of the complex. Complex 7b containing two methyl-pyridine moieties cis to each other is found to be less stable than 7a having two methyl-pyridine moieties trans to each other (Figure S3).
Figure 8.
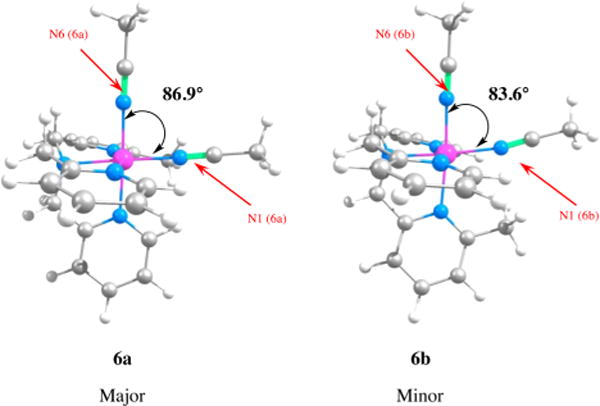
Calculated optimized structures of 6a and 6b. The acetonitrile ligand at the N1 position in 6b bends away from the methyl group of the N5-pyridine moiety and it leads to a distorted octahedral geometry with the N6–Ru–N1 angle squeezed to 83.6°.
Thermal Dissociation Properties
As observed by 1H NMR spectroscopy, the CH3CN ligand at the N1 position in complex 8 is found to be labile as it dissociates immediately upon dissolution of the complex in CD3CN in the absence of light. In contrast, no CH3CN dissociation was found for complex 5 under similar conditions. Relaxed potential energy scans were performed for 5 and 8 to gain insights into these different dissociation behaviors. The Ru–NCCH3 bonds were elongated at N1 and N6 positions for each of the complexes with an increment of 0.1 Å in each step while the rest of the molecule was reoptimized. As illustrated in Figure 9, the dissociation of the CH3CN ligand at the N1 position in complex 8 is associated with an estimated energy barrier of about 12 kcal/mol. The estimated barriers for the dissociation events of N6-CH3CN in complex 8 and the two CH3CN ligands in 5 are found to be higher, ranging from 20 to 21 kcal/mol. These results are consistent with 1H NMR spectroscopic data, which showed that complex 8 undergoes rapid dissociation of the N1 CH3CN ligand. In contrast, the N6 CH3CN ligand of 8 and the N1 and N6 CH3CN groups of 5 show no measurable dissociation under ambient conditions, as judged by 1H NMR spectroscopic analysis.
Figure 9.
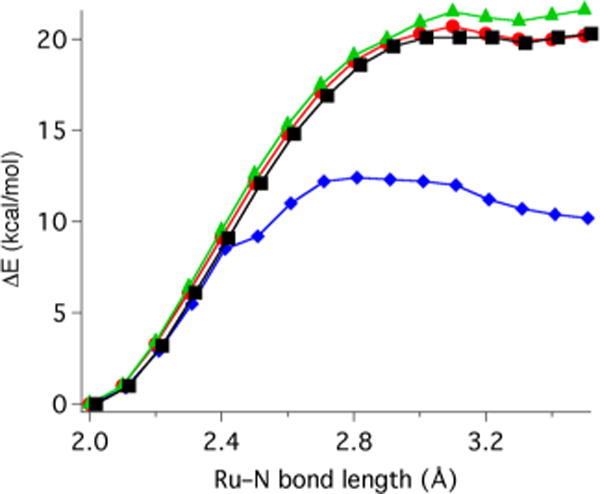
Relaxed potential energy scans of Ru–N1 and Ru–N6 acetonitrile ligands in complexes 5 (Ru–N1, green filled triangle; Ru–N6, black filled square) and 8 (Ru–N1, blue filled diamond; Ru–N6, red filled circle). The Ru–N bond is elongated by 0.1 Å in each step and the rest of the molecular geometry is reoptimized.
Differences in thermal dissociation behavior between 5 and 8 can be explained by considering their respective ground state structures. The N1 CH3CN ligand in 8 is sterically encumbered between the three methyl-substituted pyridine moieties while the absence of the methyl groups on the pyridine moieties in 5 gives rise to a less sterically crowded environment for the N1 CH3CN ligand. In order to relieve the steric congestion the N1–Ru–N6 angle decreases by 3.5° from 5 to 8, and the Ru–N1–C(CH3CN) bond angle decreases from 177.3° in 5 to 170.6° in 8. Consequently, the Ru–NCCH3 interaction in 8 is weakened and the N1 CH3CN ligand becomes more susceptible to dissociation compared to that in complex 5. Dissociation of the N1 CH3CN ligand in 8 relieves the steric repulsion present between the two CH3CN ligands. The Ru–N–C(CH3CN) bond angle at the N1 position in 8 is calculated to deviate significantly from the linear arrangement when compared to all other Ru–N–C(CH3CN) bond angles (177–178°) of complexes 5 and 8. As a result, the release of the N1 CH3CN ligand is calculated to be facile in 8 with an estimated activation barrier of about 12 kcal/mol, which is the lowest among the barriers of all CH3CN dissociations in 5 and 8.
The relaxed potential energy scans were also performed for the major and minor isomers of complexes 6 and 7 to gain further insights into their dissociation behaviors. The Ru–NCCH3 bonds were elongated at N1 and N6 positions for each of the complexes with an increment of 0.1 Å in each step while the rest of the molecule was reoptimized (Figure S10). In both complexes the energy barrier for dissociation of the N1-CH3CN ligand is the lowest in the case of minor isomer, 16.7 kcal/mol for 6b and 15.1 kcal/mol for 7b, whereas in 6a and 7a the barriers are somewhat higher, 19.0 and 17.2 kcal/mol, respectively. In both minor isomers 6b and 7b, methyl groups of the axial pyridyl donors distort the CH3CN ligand at the N1 position, decreasing the N6–Ru–N1 bond angle, and making the CH3CN ligand more labile. Taken together, these results indicate that addition of steric bulk around the N1 CH3CN groups can be used to tune dissociation energies between 12 and 22 kcal/mol for 5–8.
Photochemical Dissociation Properties
DFT calculations were used to gain further insight into the excited state behaviors of 5, 6a, and 6b. Excited state energies were not examined for 7a/b and 8, because of their higher rates of thermal ligand exchange. In our previous study we used SCF calculations to characterize the 3MLCT states for the Ru complexes with quinoline and bipyridine acceptor ligands.28 In our present study the Ru complexes have pyridine ligands which are known to be poorer acceptors than the quinoline and bipyridine ligands. We were unable to optimize the 3MLCT states for the Ru-pyridine complexes with SCF calculations. After many attempts, we concluded that these 3MLCT states are high in energy and without stable minima, causing the calculations to converge to lower energy 3MC states. The six coordinate 3MC states can lose a CH3CN ligand from N1 or N6 to yield more stable five coordinate complexes that are 45–50 kcal/mol above the S0 ground state for 5 (see Figure 10). Loss of CH3CN from N6 leads to 3MC1, a trigonal bipyramidal complex (with N3–Ru–N1 as the axis) that is 5 kcal/mol more stable than the loss of CH3CN from N1 which forms 3MC2, a square pyramidal structure (with Ru–N3 as the axis).28 These results are in good agreement with previous observations,25 which showed that photochemical dissociation of the N6 CH3CN is significantly more facile than the N1 CH3CN for Ru-quinoline and Ru-bipyridine complexes.28 The N6 CH3CN was found to be more labile than the N1 CH3CN in the triplet excited states because of a favorable orbital mixing between the aromatic ligand π* and the Ru dσ* orbitals that characterize the Ru–N6 CH3CN dissociation. By contrast, the N1 CH3CN is more labile than the N6 CH3CN in the ground states for 6–8 because of the steric repulsion by the methyl groups.
Figure 10.
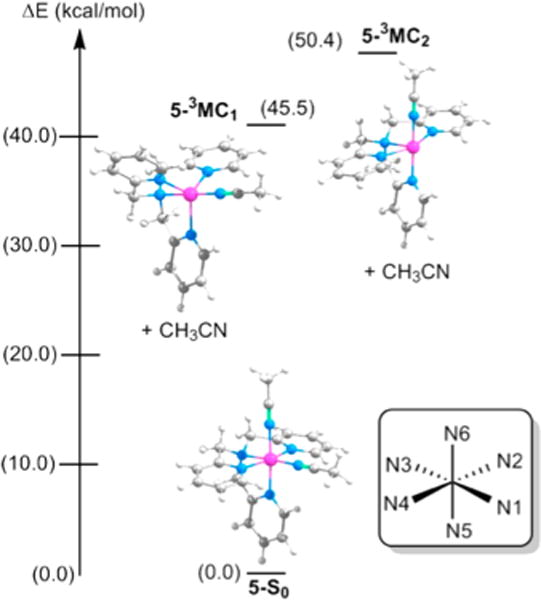
Calculated energies of the 3MC states relative to the ground state S0 for [Ru(TPA)(CH3CN)2]2+ 5. Each 3MC state is five-coordinate and has completely lost one acetonitrile ligand. The energies have been calculated as .
The 3MC1 and 3MC2 states of 6a are 43.7 and 46.9 kcal/mol higher in energy, respectively, than the ground state 6a, while the 3MC1 and 3MC2 states of 6b are 40.6 and 44.6 kcal/mol higher, respectively, than the ground state 6b (see Figure 11). Inspection of the ground state geometries of 6a and 6b finds that the steric repulsion present between the methyl group on the N5 pyridine and the N1 CH3CN in 6b distorts the octahedral field of the complex relative to that of 6a. The Ru–N1–C(CH3CN) and N6–Ru–N1 angles in the ground state of 6b are 170.5° and 83.6°, respectively, while the same bonds in 6a show angles of 174.2° and 86.9°, respectively. As a result, the ground state of 6b is 3.1 kcal/mol higher in energy than that of 6a. In both 6a and 6b, the 3MC1 states resulting from the loss of the N6 CH3CN ligands are lower in energy than the 3MC2 states resulting from the loss of the N1 CH3CN ligands. This agrees well with the observation that the N6 CH3CN undergoes exchange with CD3CN with shorter irradiation times than the N1 CH3CN for both the complexes. Moreover, the 3MC1 states for 6a and 6b are lower in energy than the 3MC1 state of 5 (43.7 and 40.6 kcal/mol vs 45.5 kcal/mol) and the 3MC2 states for 6a and 6b are lower in energy than the 3MC2 state of 5 (46.9 and 44.6 kcal/mol vs 50.4 kcal/mol) when compared to their respective ground states. These data are consistent with the 2.6-fold increase in the quantum yield of ligand dissociation observed for 6a and 6b relative to 5. Thus, both steric interactions destabilizing the ground state 6a and 6b, and electronic interactions stabilizing the 3MC1 excited state relative to the 3MC2 state contribute to the greater quantum yield for selective photochemical nitrile release when 6a and 6b are compared to 5.
Figure 11.
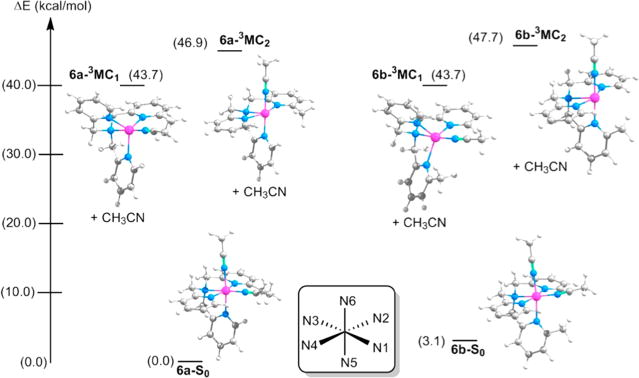
Calculated energies of the 3MC states of [Ru(MeTPA)(CH3CN)2]2+ isomers, 6a and 6b, relative to their respective ground states S0. Each 3MC state is five-coordinate and has completely lost one acetonitrile ligand. The energies have been calculated as .
CONCLUSIONS
In conclusion, we report the synthesis and characterization of a series of Ru-caged nitrile complexes derived from the ligand TPA. Steric effects on ground state stability and thermal and photochemical reactivity were studied by the consecutive introduction of methyl groups onto the 6-positions of the pyridyl donors of 5. Overall, the data indicate that a delicate balance exists between introducing steric bulk to accelerate photochemical dissociation of the nitrile donors vs accelerating thermal dissociation in the dark, which compromises the effectiveness of the caging group. Introduction of one methyl group into 5 leads to a mixture of stereoisomers (6a and 6b) with roughly 2.6-fold higher quantum efficiency for photochemical nitrile release than 5. Adding more methyl substituents, as in the case of 7a/b and 8, leads to steric crowding and higher rates of nitrile release in the dark. Computational results, supported by experimental data, indicate that barriers for thermal nitrile exchange can be tuned by over 10 kcal/mol by introducing steric crowding around the nitrile donors. Taken together, these results show that nitrile release can be tuned in Ru(TPA) complexes, which may aid in the design of new caging groups.
Supplementary Material
Figure 3.
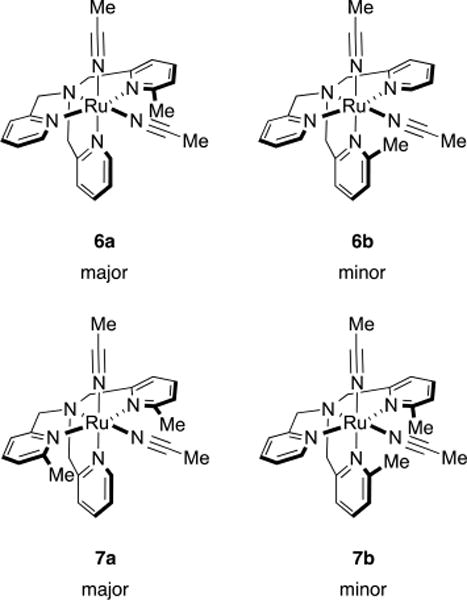
Assigned structures for major and minor isomers of 6 and 7.
Scheme 1. Synthesis of [Ru(L)(MeCN)](PF6)2 Complexes, Where L = TPA (5), MeTPA (6), Me2TPA (7), and Me3(TPA) (8)a.
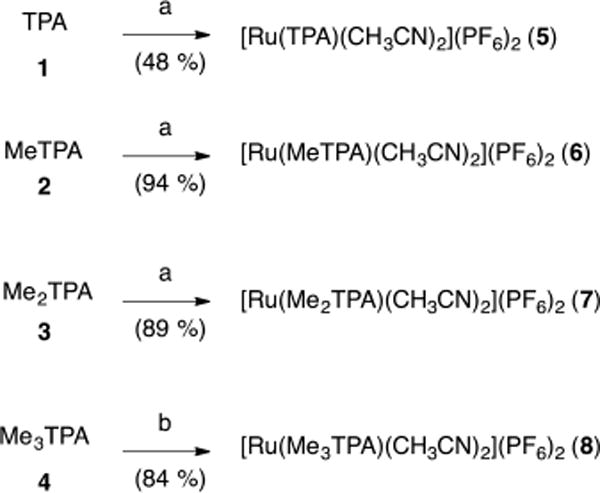
aConditions: (a) (1) cis-[RuCl2(Me2SO)4] (1 equiv), MeOH, 70 °C, 4 h, (2) CH3CN/H2O (1:1) 80 °C, 16 h; (b) (1) cis-[RuCl2(Me2SO)4] (1 equiv), EtOH, 90 °C, 18 h, (2) CH3CN/H2O (1:1) 80 °C, 18 h.
Acknowledgments
We gratefully acknowledge the National Institutes of Health (Grant EB 016072), National Science Foundation (CHE1464450), and Wayne State University (Rumble Fellowship to R.S.) for their generous support of this research and Yi-Jung Tu for helpful discussion.
Footnotes
Supporting Information
The Supporting Information is available free of charge on the ACS Publications website at DOI: 10.1021/acs.inorg-chem.6b00650.
Crystallographic information file for 7a (CIF)
General considerations, DFT results and photochemical studies, X-ray crystallographic analysis, spectral data for 6, 7, and 8, cartesian coordinates, frequencies (in cm−1) of the calculated structures, electronic structure information for the 3MC states of 5 and 6, and TD-DFT for the two isomers of [Ru(TPA)(CH3CN)(Cl)]+ (PDF)
Notes
The authors declare no competing financial interest.
References
- 1.Alvarez M, Alonso JM, Filevich O, Bhagawati M, Etchenique R, Piehler J, del Campo A. Langmuir. 2011;27:2789–2795. doi: 10.1021/la104511x. [DOI] [PubMed] [Google Scholar]
- 2.Lee H-M, Larson DR, Lawrence DS. ACS Chem Biol. 2009;4:409–427. doi: 10.1021/cb900036s. [DOI] [PMC free article] [PubMed] [Google Scholar]
- 3.Klan P, Solomek T, Bochet CG, Blanc A, Givens R, Rubina M, Popik V, Kostikov A, Wirz J. Chem Rev. 2013;113:119–191. doi: 10.1021/cr300177k. [DOI] [PMC free article] [PubMed] [Google Scholar]
- 4.Brieke C, Rohrbach F, Gottschalk A, Mayer G, Heckel A. Angew Chem, Int Ed. 2012;51:8446–8476. doi: 10.1002/anie.201202134. [DOI] [PubMed] [Google Scholar]
- 5.Ciesienski KL, Franz KJ. Angew Chem, Int Ed. 2011;50:814–824. doi: 10.1002/anie.201002542. [DOI] [PubMed] [Google Scholar]
- 6.Zayat L, Baraldo L, Etchenique R. Imaging in Neuroscience and Development. 2005:391–394. [Google Scholar]
- 7.Filevich O, Etchenique R. Ruthenium: Properties, Production and Applications. 2011:269–291. [Google Scholar]
- 8.Zayat L, Calero C, Albores P, Baraldo L, Etchenique R. J Am Chem Soc. 2003;125:882–883. doi: 10.1021/ja0278943. [DOI] [PubMed] [Google Scholar]
- 9.Salassa L, Garino C, Salassa G, Nervi C, Gobetto R, Lamberti C, Gianolio D, Bizzarri R, Sadler P. J Inorg Chem. 2009;48:1469–1481. doi: 10.1021/ic8015436. [DOI] [PubMed] [Google Scholar]
- 10.Betanzos-Lara S, Salassa L, Habtemariam A, Novakova O, Pizarro AM, Clarkson GJ, Liskova B, Brabec V, Sadler P. J Organometallics. 2012;31:3466–3479. [Google Scholar]
- 11.Cardoso CR, de Aguiar I, Camilo MR, Lima MVS, Ito AS, Baptista MS, Pavani C, Venancio T, Carlos RM. Dalton Trans. 2012;41:6726–6734. doi: 10.1039/c2dt12136k. [DOI] [PubMed] [Google Scholar]
- 12.Knoll JD, Albani BA, Durr CB, Turro C. J Phys Chem A. 2014;118:10603–10610. doi: 10.1021/jp5057732. [DOI] [PMC free article] [PubMed] [Google Scholar]
- 13.Mosquera J, Sanchez MI, Mascarenas JL, Eugenio Vazquez M. Chem Commun. 2015;51:5501–5504. doi: 10.1039/c4cc08049a. [DOI] [PubMed] [Google Scholar]
- 14.Karaoun N, Renfrew AK. Chem Commun. 2015;51:14038–14041. doi: 10.1039/c5cc05172j. [DOI] [PubMed] [Google Scholar]
- 15.Li A, White JK, Arora K, Herroon MK, Martin PD, Schlegel HB, Podgorski I, Turro C, Kodanko JJ. Inorg Chem. 2016;55:10–12. doi: 10.1021/acs.inorgchem.5b02600. [DOI] [PMC free article] [PubMed] [Google Scholar]
- 16.Bonnet S, Collin J-P, Sauvage J-P, Schofield E. Inorg Chem. 2004;43:8346–8354. doi: 10.1021/ic0491736. [DOI] [PubMed] [Google Scholar]
- 17.Goldbach RE, Rodriguez-Garcia I, van Lenthe JH, Siegler MA, Bonnet S. Chem - Eur J. 2011;17:9924–9929. doi: 10.1002/chem.201101541. [DOI] [PubMed] [Google Scholar]
- 18.Bahreman A, Limburg B, Siegler MA, Bouwman E, Bonnet S. Inorg Chem. 2013;52:9456–9469. doi: 10.1021/ic401105v. [DOI] [PubMed] [Google Scholar]
- 19.Liu Y, Turner DB, Singh TN, Angeles-Boza AM, Chouai A, Dunbar KR, Turro C. J Am Chem Soc. 2009;131:26–27. doi: 10.1021/ja806860w. [DOI] [PubMed] [Google Scholar]
- 20.Garner RN, Gallucci JC, Dunbar KR, Turro C. Inorg Chem. 2011;50:9213–9215. doi: 10.1021/ic201615u. [DOI] [PMC free article] [PubMed] [Google Scholar]
- 21.Respondek T, Garner RN, Herroon MK, Podgorski I, Turro C, Kodanko JJ. J Am Chem Soc. 2011;133:17164–17167. doi: 10.1021/ja208084s. [DOI] [PMC free article] [PubMed] [Google Scholar]
- 22.Sears RB, Joyce LE, Ojaimi M, Gallucci JC, Thummel RP, Turro C. J Inorg Biochem. 2013;121:77–87. doi: 10.1016/j.jinorgbio.2012.12.003. [DOI] [PubMed] [Google Scholar]
- 23.Sgambellone MA, David A, Garner RN, Dunbar KR, Turro C. J Am Chem Soc. 2013;135:11274–11282. doi: 10.1021/ja4045604. [DOI] [PubMed] [Google Scholar]
- 24.Respondek T, Sharma R, Herroon MK, Garner RN, Knoll JD, Cueny E, Turro C, Podgorski I, Kodanko J. J ChemMedChem. 2014;9:1306–1315. doi: 10.1002/cmdc.201400081. [DOI] [PMC free article] [PubMed] [Google Scholar]
- 25.Sharma R, Knoll JD, Martin PD, Podgorski I, Turro C, Kodanko JJ. Inorg Chem. 2014;53:3272–3274. doi: 10.1021/ic500299s. [DOI] [PMC free article] [PubMed] [Google Scholar]
- 26.Ramalho SD, Vieira PC, Sharma R, Kodanko JJ, White JK, Turro C, Aggarwal N, Chalasani A, Sameni M, Moin K, Sloane BF. PLoS One. 2015;10:e0142527. doi: 10.1371/journal.pone.0142527. [DOI] [PMC free article] [PubMed] [Google Scholar]
- 27.Sharma R, Knoll JD, Ancona N, Martin PD, Turro C, Kodanko JJ. Inorg Chem. 2015;54:1901–1911. doi: 10.1021/ic502791y. [DOI] [PMC free article] [PubMed] [Google Scholar]
- 28.Tu Y-J, Mazumder S, Endicott JF, Turro C, Kodanko JJ, Schlegel HB. Inorg Chem. 2015;54:8003–8011. doi: 10.1021/acs.inorgchem.5b01202. [DOI] [PMC free article] [PubMed] [Google Scholar]
- 29.Fleming FF, Yao L, Ravikumar PC, Funk L, Shook BC. J Med Chem. 2010;53:7902–7917. doi: 10.1021/jm100762r. [DOI] [PMC free article] [PubMed] [Google Scholar]
- 30.Ramalho SD, Sharma R, White JK, Aggarwal N, Chalasani A, Sameni M, Moin K, Vieira PC, Turro C, Kodanko JJ, Sloane BF. PLoS One. 2015;10:e0142527. doi: 10.1371/journal.pone.0142527. [DOI] [PMC free article] [PubMed] [Google Scholar]
- 31.Herroon MK, Sharma R, Rajagurubandara E, Turro C, Kodanko JJ, Podgorski I. Biol Chem. 2016 doi: 10.1515/hsz-2015-0274. [DOI] [PMC free article] [PubMed] [Google Scholar]
- 32.Filevich O, Salierno M, Etchenique R. J Inorg Biochem. 2010;104:1248–1251. doi: 10.1016/j.jinorgbio.2010.08.003. [DOI] [PubMed] [Google Scholar]
- 33.Araya R, Andino-Pavlovsky V, Yuste R, Etchenique R. ACS Chem Neurosci. 2013;4:1163–1167. doi: 10.1021/cn4000692. [DOI] [PMC free article] [PubMed] [Google Scholar]
- 34.Zayat L, Noval MG, Campi J, Calero CI, Calvo DJ, Etchenique R. ChemBioChem. 2007;8:2035–2038. doi: 10.1002/cbic.200700354. [DOI] [PubMed] [Google Scholar]
- 35.Weisser F, Plebst S, Hohloch S, van der Meer M, Manck S, Fuehrer F, Radtke V, Leichnitz D, Sarkar B. Inorg Chem. 2015;54:4621–4635. doi: 10.1021/ic502807d. [DOI] [PubMed] [Google Scholar]
- 36.Weisser F, Hohloch S, Plebst S, Schweinfurth D, Sarkar B. Chem - Eur J. 2014;20:781–793. doi: 10.1002/chem.201303640. [DOI] [PubMed] [Google Scholar]
- 37.Kojima T, Sakamoto T, Matsuda Y. Inorg Chem. 2004;43:2243–2245. doi: 10.1021/ic035137f. [DOI] [PubMed] [Google Scholar]
- 38.Kojima T, Morimoto T, Sakamoto T, Miyazaki S, Fukuzumi S. Chem - Eur J. 2008;14:8904–8915. doi: 10.1002/chem.200800827. [DOI] [PubMed] [Google Scholar]
- 39.Zhou X, Li F, Li X, Li H, Wang Y, Sun L. Dalton Trans. 2015;44:475–479. doi: 10.1039/c4dt02945c. [DOI] [PubMed] [Google Scholar]
- 40.Vennampalli M, Liang G, Webster CE, Zhao X. Eur J Inorg Chem. 2014;2014:715–721. doi: 10.1021/ic500840e. [DOI] [PubMed] [Google Scholar]
- 41.Ohzu S, Ishizuka T, Hirai Y, Fukuzumi S, Kojima T. Chem - Eur J. 2013;19:1563–1567. doi: 10.1002/chem.201203430. [DOI] [PubMed] [Google Scholar]
- 42.Ohzu S, Ishizuka T, Hirai Y, Jiang H, Sakaguchi M, Ogura T, Fukuzumi S, Kojima T. Chemical Sci. 2012;3:3421–3431. [Google Scholar]
- 43.Singh WM, Pegram D, Duan H, Kalita D, Simone P, Emmert GL, Zhao X. Angew Chem, Int Ed. 2012;51:1653–1656. doi: 10.1002/anie.201106494. [DOI] [PubMed] [Google Scholar]
- 44.Shiota Y, Herrera JM, Juhasz G, Abe T, Ohzu S, Ishizuka T, Kojima T, Yoshizawa K. Inorg Chem. 2011;50:6200–6209. doi: 10.1021/ic200481n. [DOI] [PubMed] [Google Scholar]
- 45.Kojima T, Nakayama K, Sakaguchi M, Ogura T, Ohkubo K, Fukuzumi S. J Am Chem Soc. 2011;133:17901–17911. doi: 10.1021/ja207572z. [DOI] [PubMed] [Google Scholar]
- 46.Radaram B, Ivie JA, Singh WM, Grudzien RM, Reibenspies JH, Webster CE, Zhao X. Inorg Chem. 2011;50:10564–10571. doi: 10.1021/ic200050g. [DOI] [PubMed] [Google Scholar]
- 47.Kojima T, Hayashi K-i, Iizuka S-y, Tani F, Naruta Y, Kawano M, Ohashi Y, Hirai Y, Ohkubo K, Matsuda Y, Fukuzumi S. Chem - Eur J. 2007;13:8212–8222. doi: 10.1002/chem.200700190. [DOI] [PubMed] [Google Scholar]
- 48.Yamaguchi M, Kousaka H, Izawa S, Ichii Y, Kumano T, Masui D, Yamagishi T. Inorg Chem. 2006;45:8342–8354. doi: 10.1021/ic060722c. [DOI] [PubMed] [Google Scholar]
- 49.Kojima T, Matsuo H, Matsuda Y. Inorg Chim Acta. 2000:300–302. [Google Scholar]
- 50.Yano Y, Kojima T, Fukuzumi S. Inorg Chim Acta. 2011;374:104–111. [Google Scholar]
- 51.Seeberg-Kraft S, Bischof C, Loos A, Braun S, Jafarova N, Schatzschneider U. J Inorg Biochem. 2009;103:1126–1134. doi: 10.1016/j.jinorgbio.2009.05.013. [DOI] [PubMed] [Google Scholar]
- 52.Miyazaki S, Kojima T, Mayer JM, Fukuzumi S. J Am Chem Soc. 2009;131:11615–11624. doi: 10.1021/ja904386r. [DOI] [PMC free article] [PubMed] [Google Scholar]
- 53.Miyazaki S, Kojima T, Sakamoto T, Matsumoto T, Ohkubo K, Fukuzumi S. Inorg Chem. 2008;47:333–343. doi: 10.1021/ic701759c. [DOI] [PubMed] [Google Scholar]
- 54.Miyazaki S, Ohkubo K, Kojima T, Fukuzumi S. Angew Chem, Int Ed. 2008;47:9669–9672. doi: 10.1002/anie.200802835. [DOI] [PubMed] [Google Scholar]
- 55.Kojima T, Hayashi K-I, Matsuda Y. Inorg Chem. 2004;43:6793–6804. doi: 10.1021/ic0495665. [DOI] [PubMed] [Google Scholar]
- 56.Kojima T, Sakamoto T, Matsuda Y, Ohkubo K, Fukuzumi S. Angew Chem, Int Ed. 2003;42:4951–4954. doi: 10.1002/anie.200352111. [DOI] [PubMed] [Google Scholar]
- 57.Merkle AC, McQuarters AB, Lehnert N. Dalton Trans. 2012;41:8047–8059. doi: 10.1039/c2dt30464c. [DOI] [PubMed] [Google Scholar]
- 58.Howerton BS, Heidary DK, Glazer EC. J Am Chem Soc. 2012;134:8324–8327. doi: 10.1021/ja3009677. [DOI] [PubMed] [Google Scholar]
- 59.Knoll JD, Albani BA, Turro C. Chem Commun. 2015;51:8777–8780. doi: 10.1039/c5cc01865j. [DOI] [PMC free article] [PubMed] [Google Scholar]
- 60.Beni A, Dei A, Laschi S, Rizzitano M, Sorace L. Chem -Eur J. 2008;14:1804–1813. doi: 10.1002/chem.200701163. [DOI] [PubMed] [Google Scholar]
- 61.Montalti M, Credi A, Prodi L, Gandolfi MT. Handbook of Photochemistry. 3rd. CRC Press; Boca Raton, FL: 2006. [Google Scholar]
- 62.Frisch MJ, Trucks GW, Schlegel HB, Scuseria GE, Robb MA, Cheeseman JR, Scalmani G, Barone V, Mennucci B, Petersson GA, Nakatsuji H, Caricato M, Li X, Hratchian HP, Izmaylov AF, Bloino J, Zheng G, Sonnenberg JL, Hada M, Ehara M, Toyota K, Fukuda R, Hasegawa J, Ishida M, Nakajima T, Honda Y, Kitao O, Nakai H, Vreven T, Montgomery JA, Jr, Peralta JE, Ogliaro F, Bearpark M, Heyd JJ, Brothers E, Kudin KN, Staroverov VN, Kobayashi R, Normand J, Raghavachari K, Rendell A, Burant JC, Iyengar SS, Tomasi J, Cossi M, Rega N, Millam JM, Klene M, Knox JE, Cross JB, Bakken V, Adamo C, Jaramillo J, Gomperts R, Stratmann RE, Yazyev O, Austin AJ, Cammi R, Pomelli C, Ochterski JW, Martin RL, Morokuma K, Zakrzewski VG, Voth GA, Salvador P, Dannenberg JJ, Dapprich S, Daniels AD, Farkas O, Foresman JB, Ortiz JV, Cioslowski J, Fox DJ. Gaussian 09, revision D.01. Gaussian, Inc; Wallingford, CT: 2013. [Google Scholar]
- 63.Becke AD. Phys Rev A: At, Mol, Opt Phys. 1988;38:3098–3100. doi: 10.1103/physreva.38.3098. [DOI] [PubMed] [Google Scholar]
- 64.Perdew JP. Phys Rev B: Condens Matter Mater Phys. 1986;33:8822–8824. doi: 10.1103/physrevb.33.8822. [DOI] [PubMed] [Google Scholar]
- 65.Andrae D, Häußermann U, Dolg M, Stoll H, Preuß H. Theoret Chim Acta. 1990;77:123–141. [Google Scholar]
- 66.Igel-Mann G, Stoll H, Preuss H. Mol Phys. 1988;65:1321–1328. [Google Scholar]
- 67.Francl MM. J Chem Phys. 1982;77:3654. [Google Scholar]
- 68.Hariharan PC, Pople JA. Theoret Chim Acta. 1973;28:213–222. [Google Scholar]
- 69.Marenich AV, Cramer CJ, Truhlar DG. J Phys Chem B. 2009;113:6378–6396. doi: 10.1021/jp810292n. [DOI] [PubMed] [Google Scholar]
- 70.Dennington R, Keith T, Millam J. GaussView. Semichem Inc; Shawnee Mission, KS: 2009. version 5. [Google Scholar]
- 71.Casida ME, Jamorski C, Casida KC, Salahub DR. J Chem Phys. 1998;108:4439–4449. [Google Scholar]
- 72.Stratmann RE, Scuseria GE, Frisch MJ. J Chem Phys. 1998;109:8218–8224. [Google Scholar]
- 73.Kojima T, Amano T, Ishii Y, Ohba M, Okaue Y, Matsuda Y. Inorg Chem. 1998;37:4076–4085. doi: 10.1021/ic971049h. [DOI] [PubMed] [Google Scholar]
- 74.Whiteoak CJ, Nobbs JD, Kiryushchenkov E, Pagano S, White AJP, Britovsek GJP. Inorg Chem. 2013;52:7000–7009. doi: 10.1021/ic4005196. [DOI] [PubMed] [Google Scholar]
- 75.Pretsch E, Clerc T, Seibl J, Simon W. Tables of Spectral Data for Structure Determination of Organic Compounds: 13C-NMR, 1H-NMR, IR, MS, UV/VIS Chemical Laboratory Practice. 1983 doi: 10.1007/978-3-662-22455-7. [DOI] [Google Scholar]
- 76.Sun Q, Mosquera-Vazquez S, Suffren Y, Hankache J, Amstutz N, Lawson Daku LM, Vauthey E, Hauser A. Coord Chem Rev. 2015:282–283. [Google Scholar]
- 77.Knoll JD, Albani BA, Turro C. Acc Chem Res. 2015;48:2280–2287. doi: 10.1021/acs.accounts.5b00227. [DOI] [PMC free article] [PubMed] [Google Scholar]
Associated Data
This section collects any data citations, data availability statements, or supplementary materials included in this article.