

ABStract
MPDL3280A is a human monoclonal antibody that targets programmed cell death-1 ligand 1 (PD-L1), and exerts anti-tumor activity mainly by blocking PD-L1 interaction with programmed cell death-1 (PD-1) and B7.1. It is being investigated as a potential therapy for locally advanced or metastatic malignancies. The purpose of the study reported here was to characterize the pharmacokinetics, pharmacodynamics, tissue distribution and tumor penetration of MPDL3280A and/or a chimeric anti-PD-L1 antibody PRO304397 to help further clinical development.
The pharmacokinetics of MPDL3280A in monkeys at 0.5, 5 and 20 mg·kg−1 and the pharmacokinetics / pharmacodynamics of PRO304397 in mice at 1, 3 10 mg·kg−1 were determined after a single intravenous dose. Tissue distribution and tumor penetration for radiolabeled PRO304397 in tumor-bearing mouse models were determined.
The pharmacokinetics of MPDL3280A and PRO304397 were nonlinear in monkeys and mice, respectively. Complete saturation of PD-L1 in blood in mice was achieved at serum concentrations of PRO304397 above ∼0.5 µg·mL−1. Tissue distribution and tumor penetration studies of PRO304397 in tumor-bearing mice indicated that the minimum tumor interstitial to plasma radioactivity ratio was ∼0.3; saturation of target-mediated uptake in non–tumor tissues and desirable exposure in tumors were achieved at higher serum concentrations, and the distribution into tumors was dose-and time-dependent.
The biodistribution data indicated that the efficacious dose is mostly likely higher than that estimated based on simple pharmacokinetics/pharmacodynamics in blood. These data also allowed for estimation of the target clinical dose for further development of MPDL3280A.
KEYWORDS: Anti-PD-L1, PD-L1, pharmacodynamics, pharmacokinetics, tissue distribution, tumor penetration
ABBREVIATIONS
- ATA
(anti-therapeutic antibody)
- AUC0–4
(area under the serum concentration-time curve from time 0 to Day 4)
- AUC0–7
(area under the serum concentration-time curve from time 0 to Day 7)
- AUCinf
(area under the serum concentration−time curve extrapolated to infinity)
- CHO
(Chinese hamster ovary)
- CL
(clearance)
- Cmax
(observed maximum serum concentration)
- Ctrough,ss
(trough serum concentration at steady state)
- GMFI
(mean fluorescence intensity values)
- HRP
(horseradish peroxidase)
- IV
(intravenous)
- MAR
(micro-autoradiography)
- MOEF
(Molecules of equivalent fluorescence)
- MQC
(minimum quantifiable concentration)
- PK
(pharmacokinetics)
- PD
(pharmacodynamics)
- PD-L1
(programmed cell death-1 ligand 1)
- Q
(blood flow rate)
- SD
(standard deviation)
- Vi
(interstitial volume)
- Vv
(vascular volume)
- Vss
(volume of distribution at steady-state).
Introduction
Cancer can encompass a variety of immune abnormalities including, but not limited to, cellular immune dysfunction, antigen presentation deficits, and cytokine production defects. Therefore, enhancing the immune system potentially represents an appealing avenue for cancer therapy. The goal of certain immunotherapies is to restore the capacity of T cells to recognize and destroy cancer. Programmed cell death-1 ligand 1 (PD-L1) expression is prevalent in many human tumors (e.g., melanoma, renal cell carcinoma, lung cancer, colon cancer, breast cancer, ovarian cancer, gastric cancer, head and neck cancer, malignant lymphoma, multiple myeloma) and its overexpression has been associated with poor prognosis in cancer patients.1-3 PD-L1 binds to two known inhibitory receptors (PD-1 and B7.1) expressed on T cells following T-cell activation, which is sustained in states of chronic stimulation such as in chronic infection or cancer.4,5 Ligation of PD-L1 with PD-1 or B7.1 inhibits T cell proliferation, cytokine production, and cytolytic activity, leading to the functional inactivation or exhaustion of T cells. Aberrant expression of PD-L1 on tumor cells has been reported to impede anti-tumor immunity, resulting in immune evasion.6 Therefore, interruption of the PD-1/PD-L1 and PD-1/B7.1 pathway represents an attractive strategy to reinvigorate tumor-specific T cell immunity.7,8
MPDL3280A, an effector-less (FcγR-binding deficient) phage-derived human immunoglobulin G1 (IgG1) monoclonal antibody (mAb) that targets PD-L1 and blocks its interaction with PD-1 and B7.1, is in development as a potential therapy for cancer patients with locally advanced or metastatic malignancies. MPDL3280A has shown promising results in patients with locally advanced or metastatic tumors.9-11 A reverse chimera and mouse IgG2a D265A / N297A (DANA) variant antibody against murine PD-L1, PRO304397, was developed to minimize immunogenicity in preclinical animal studies. Herein, we characterized the pharmacokinetics (PK) of MPDL3280A in cynomolgus monkeys, the PK/pharmacodynamics (PD) of PRO304397 in mice, and the tissue distribution and tumor penetration of PRO304397 in two isograft tumor-bearing mouse models to gain a better understanding of the pharmacological characteristics of MPDL3280A and inform further drug development efforts.
Results
Pharmacokinetics and pharmacodynamics of PRO304397 in BALB/c mice
Following a single intravenous (IV) administration at 1, 10, and 30 mg·kg−1 to BALB/c mice, PRO304397 exhibited biphasic disposition through Day 4 for the 1 mg·kg−1 group and through Day 7 for the 10 and 30 mg·kg−1groups (Fig. 1). A rapid drop in serum concentrations was observed after Day 4 for the 1 mg·kg−1 group and after Day 7 for the 10 and 30 mg·kg−1groups, suggesting the presence of anti-therapeutic antibodies (ATAs) and/or target (PD-L1) mediated drug disposition (TMDD). Group mean PK parameters are provided in Table S1. The clearance (CL) of the PRO304397 was fairly rapid even at the highest dose of 30 mg·kg−1, likely due to the effect of ATAs on PK on top of TMDD, and ranged from 16.3 to 57.7 mL·day−1·kg−1. Volume of distribution at steady state (Vss) was approximately that of the plasma volume, ranging from 42.6 to 57.7 mL·kg−1. Due to the concerns about the potential ATA effect on the PK, the PK linearity of PRO304397 in mice was assessed based on initial exposure up to 4 d exposure. Area under the serum concentration-time curve from time 0 to Day 4 (AUC0–4) was 17.1, 406, and 1230 day·μg·mL−1 following IV administration at 1, 10, and 30 mg·kg−1, respectively, indicating non-dose proportionality between 1 and 10 mg·kg−1 and approximate dose proportionality between 10 and 30 mg·kg−1, which is expected for PRO304397 with soluble and membrane-bound endogenous targets (i.e., PD-L1) in mice.
Figure 1.
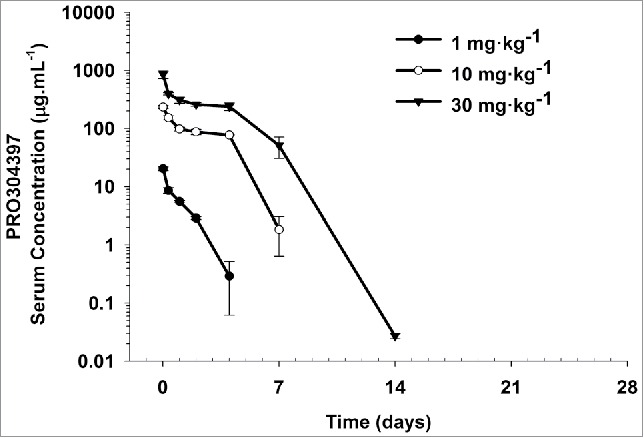
Mean (± SD) serum concentration−time profiles following a single IV administration of 1, 10, and 30 mg·kg−1 PRO304397 to BALB/c mice. N = 3 mice per time point per group. The minimum quantifiable concentration (MQC) in the PRO304397 concentration ELISA was 0.0078 µg·mL−1. Values below MQC were interpreted as missing for summary statistics.
Saturation of membrane PD-L1 on CD8+ cytotoxic T lymphocytes and CD4+ T helper lymphocytes was determined at various time points following single IV doses of 1, 10, and 30 mg·kg−1 of PRO304397. Complete saturation of PD-L1 on both CD8+ and CD4+ T lymphocyte subsets was observed between 24 and 48 h after dosing with PRO304397 across all dose groups, and was achieved at serum concentrations above ∼0.5 µg·mL−1 (Fig. S1). By Day 7, all animals in the 1 mg·kg−1 group demonstrated full recovery, and by Day 14 all animals in all dose groups (1, 10, and 30 mg·kg−1) showed full recovery of free PD-L1 sites (Fig. 2). Due to the lack of sampling time points between Day 7 and Day 14, the time to return to baseline appeared to be the same (i.e., 14 days) for the 2 higher dose groups. It was noticed that there was an increase in PD-L1 signal on Day 4 in control group. This is likely due to inherent variability in baseline PD-L1 expression since each sample at each time point represents an individual animal, where 3 mice were sacrificed at each specific time points per group and pooled data were treated as from one single animal.
Figure 2.
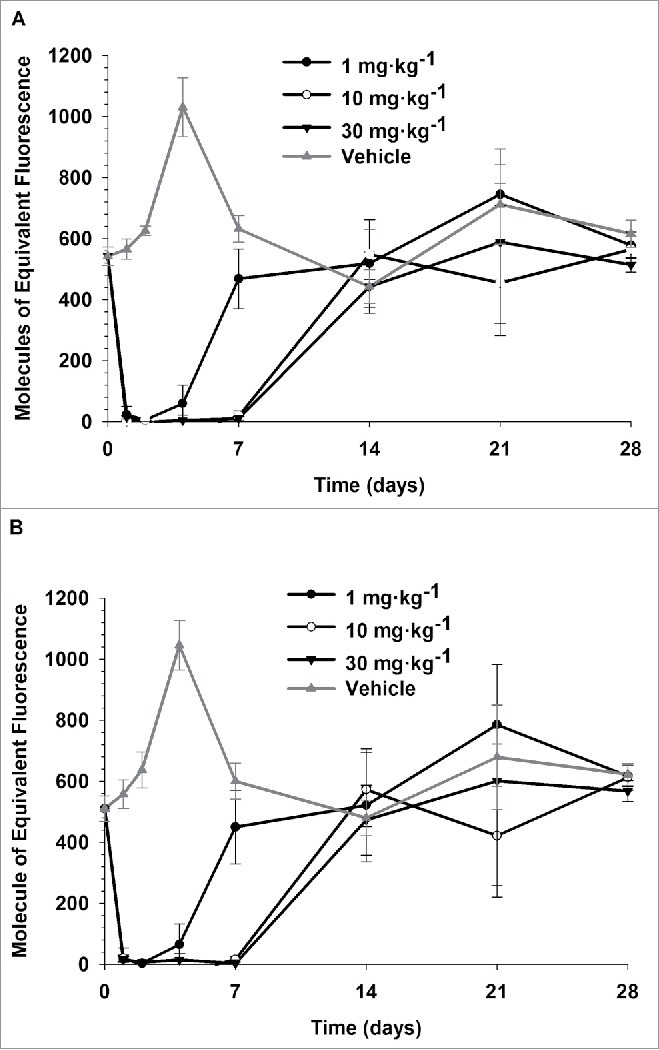
Saturation of PDL1 on CD8+ (A) and CD4+ (B) T lymphocytes following single IV administration of 1, 10, and 30 mg·kg−1 PRO304397 to BALB/c mice. N = 3 mice per group/per time point, where 3 mice were sacrificed at each time point per group. Saturation of PDL1 was assessed via flow cytometry by measuring the amount of free membrane PDL1 present on the cell surface of peripheral blood CD8 + and CD4 + T lymphocytes. Biotin-conjugated PRO304397 was used to stain peripheral blood mononuclear cells and detected with streptavidin-phycoerythrin (SA-PE). Values were normalized against an appropriate isotype control. Mean (+/−SD) fluorescence values for each group are represented as molecules of equivalent fluorescence (MOEF).
Pharmacokinetics of MPDL3280A in cynomolgus monkeys
Following a single IV bolus administration at 0.5, 5, or 20 mg·kg−1 to cynomolgus monkeys, MPDL3280A showed biphasic disposition up to Day 7 (Fig. 3). After Day 7, however, serum MPDL3280A concentrations became variable across dose levels, and MPDL3280A was quickly eliminated in 9 of 12 animals (Fig. S2). These results again suggest the formation of ATAs on top of TMDD. Indeed, ATA positive titers were confirmed in all 12 animals at Day 14 and in 11 of 12 animals after Day 14 until the end of the study. Therefore, the quick elimination of MPDL3280A in the terminal phase is due to the effect of ATAs on top of TMDD. Because the PK of MPDL3280A was affected by ATAs, the PK linearity of MPDL3280A in cynomolgus monkeys was assessed based on initial exposure up to 7 d post-dose, by which ATAs have not taken effect yet.12 The mean area under the serum concentration-time curve from time 0 to Day 7 (AUC0−7) values were 29.0, 409, and 1940 day·μg·mL−1 and the observed maximum serum concentration (Cmax) values were 8.55, 123, and 610 μg·mL−1 following administration of 0.5, 5, or 20 mg·kg−1 MPDL3280A, respectively (Table S2). From 0.5 mg·kg−1 to 5 mg·kg−1, while dose increase was only 10-fold, the increase in both AUC0–7 and Cmax was ∼15-fold; whereas from 5 mg·kg−1 to 20 mg·kg−1, with a 4-fold dose increase, both the AUC0–7 and Cmax increased ∼5-fold. Furthermore, as shown in Fig. S3, the dose-normalized concentration-time profiles of MPDL3280A were not super-imposable. Taking all of the data together, MPLD3280A has nonlinear (dose-dependent) PK in cynomolgus monkeys from 0.5 to 5 mg·kg−1 and approximates linear PK in the dose range between 5 and 20 mg·kg−1. This was expected for MPDL3280A with soluble and membrane bound endogenous targets in cynomolgus monkeys. Of note, the dose proportionality of AUC0−7 and Cmax were highly correlated, likely because the partial AUC (AUC0−7) was driven by Cmax, given the short duration evaluated.
Figure 3.
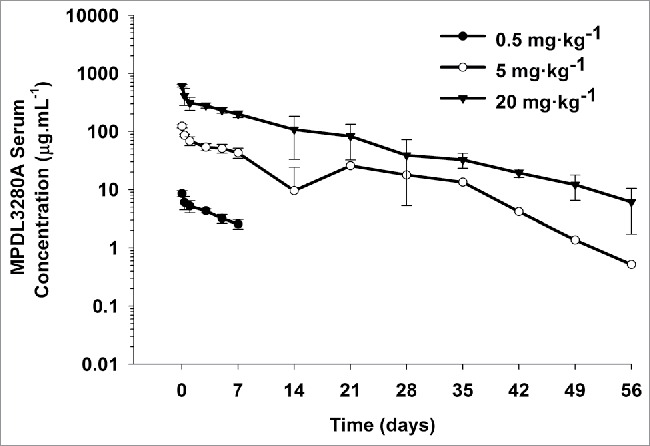
Mean (± SD) serum concentration-time profiles following a single IV administration of 0.5, 5, and 20 mg·kg−1 MPDL3280A to cynomolgus monkeys. N = 4 animals per group. The minimum quantifiable concentration (MQC) in the MPDL3280A concentration ELISA was 0.075 μg·mL−1. Values below MQC were interpreted as missing for summary statistics.
Data from the 3 animals with serum concentration-time profiles that did not appear to be affected by the presence of ATAs and were in the linear range (i.e., from 5 and 20 mg·kg−1 groups) were fitted to a two-compartment model. Using estimated mean PK parameters from these 3 animals, simulations were performed for all animals across all dose levels. The two-compartment model well described the observed data collected up to Day 7 from all animals in the 5 and 20 mg·kg−1 groups and overestimated the observed data from all animals in 0.5 mg·kg−1 group (Fig. S4). This further confirmed the nonlinear PK observation using the non-compartmental method. The estimated CL of MPDL3280A ranged from 3.65 to 3.79 mL·day−1·kg−1, and mean β phase half-life (t1/2,β) was estimated to be ∼11.5 d across the 5 and 20 mg·kg−1 groups (Table S3). The mean Vss 59.8 mL·kg−1 was similar to that of plasma volume (Table S3). These PK parameters are within the expected range for a typical human/humanized IgG1 in the linear range,13 which indicates that there is no preclinical PK liability for MPDL3280A.
In vivo biodistribution of PRO304397 in tumor-bearing mice
PRO304397 had non-linear PK in the MC38 isograft tumor-bearing mice (MC38: murine colorectal cancer cells, a sensitive model to PRO304397 treatment). At the 24 h post-dose time point, the plasma radioactive signal from the 125I-PRO304397 tracer and tracer + 0.3 mg·kg−1 dose group were significantly lower than the other dose groups (Fig. 4A); the 1 mg·kg−1 dose had about half the plasma radioactivity as the other dose groups, and there was no significant difference in plasma levels among the dose groups ≥ 3 mg·kg−1 (p>0.05). This is in line with the non-linear PK observation in the mouse PK/PD study. Of note, the study was conducted up to 168 h corresponding to the duration for which target binding was fully saturated for 10 and 30 mg·kg−1 group in the mouse PK/PD study. The plasma radioactivity for all dose groups decreased over time (Fig. 4A). At 168 h the dose normalized plasma radioactivity levels of the 1 and 3 mg·kg−1 dose group decreased to levels similar to those observed for the tracer and 0.3 mg·kg−1 dose groups, presumably due to faster elimination of PRO304397. There was no statistical difference between the 20 and 40 mg·kg−1 groups, with each losing about 66% of their radioactivity over the 7 d study (p>0.05), indicating that PRO304397 has dose-proportional plasma PK only between the 20 and 40 mg·kg−1 groups. This again confirmed the nonlinear PK of PRO304397 in mice.
Figure 4.

Plasma and tissue radioactive level following a single IV bolus administration of 125I- PRO304397 along with 0–40 mg·kg−1unlabeled antibody to MC38 tumor-bearing mice. (A) Plasma radioactivity levels at 24 and 168 h post-dose. The data are presented as average percent injected dose per milliliter of plasma (%ID·mL−1). (B) The tissue radioactivity levels at 24 h post-dose. The data are presented as average percent injected dose per gram of tissue (%ID·g−1). (C) Tumor interstitial to plasma ratio at 24 and 168 h post-dose. For all figures, the error bars are the standard deviation of 3 measurements.
At 24 h it was noted that the plasma radioactivity levels for the tracer was much lower than those of the other dose groups. The radioactive signal missing from plasma was instead found in the blood cell pellet, liver, kidneys, lungs, heart, and spleen (Fig. 4B). As the dose of unlabeled antibody increased, the radioactive signal in these tissues concomitantly decreased, indicating competitive inhibition by unlabeled PRO304397, which blocks the binding of 125I-PRO304397 tracer to receptors (i.e., PD-L1) expressed in these tissues. There was little difference in the radioactivity across the groups in the muscle due to lack of receptor expression. The radioactivity in the tumor followed the same trend as that in the plasma, suggesting that much of PRO304397 in this tissue is in free interstitial and/or plasma. Tumor radioactivity levels were combined with physiological measurements (e.g., vascular and interstitial volumes) to derive tumor interstitial concentrations as previously described,14 which, in turn, were used to calculate tumor interstitial:plasma ratios. There was no statistical difference among the ratios of tumor interstitial radioactivity to that of plasma for doses ≥ 1 mg·kg−1 at 24 hand ≥ 10 mg·kg−1 at 168 h(p>0.05; Fig. 4C), which indicates that doses ≥ 10 mg·kg−1 were able to saturate target-mediated uptake in MC38 tumor-bearing mice for a longer duration.
Similar plasma and tissue kinetics were observed in mice bearing the Cloudman isograft tumor as those bearing the MC38 tumor (Fig. 5A and 5B). Cloudman S91 cells, referred to below as Cloudman, are murine melanoma cells that are a less sensitive model to PRO304397 treatment. Furthermore, the tumor interstitial radioactivity to plasma ratio also followed the same trend with no statistical difference for doses ≥ 1 mg·kg−1 at 24 h ≥ 3 mg·kg−1 at 120 h and ≥ 10 mg·kg−1 at 168 h(p>0.05; Fig. 5C). These data indicates that doses ≥ 10 mg·kg−1 were also able to saturate target-mediated uptake in Cloudman tumor-bearing mice for a longer duration.
Figure 5.

Plasma and tissue radioactive level following a single IV bolus administration of 125I- PRO304397 along with 0–40 mg·kg−1unlabeled antibody to Cloudman tumor-bearing mice. (A) Plasma radioactivity levels at 24, 120, and 168 h post-dose. The data are presented as individual animal percent injected dose per milliliter of plasma (%ID·mL−1) with a line passing through the average. (B) The tissue radioactivity levels at 24 h post-dose. The data are presented as average percent injected dose per gram of tissue (%ID·g−1). (C) Tumor interstitial to plasma ratio at 24, 120, and 168 h post-dose. For all figures, the error bars are the standard deviation of 3 measurements.
Intratumoral distribution of PRO304397 in tumor-bearing mice
Two methods were utilized to characterize the intratumoral localization of 125I- PRO304397: 1) autoradiography, which enabled the spatial localization of the signal; and 2) micro-autoradiography (MAR) to further enhance the characterization by investigating the cell population taking up the radioactivity-associated signal.
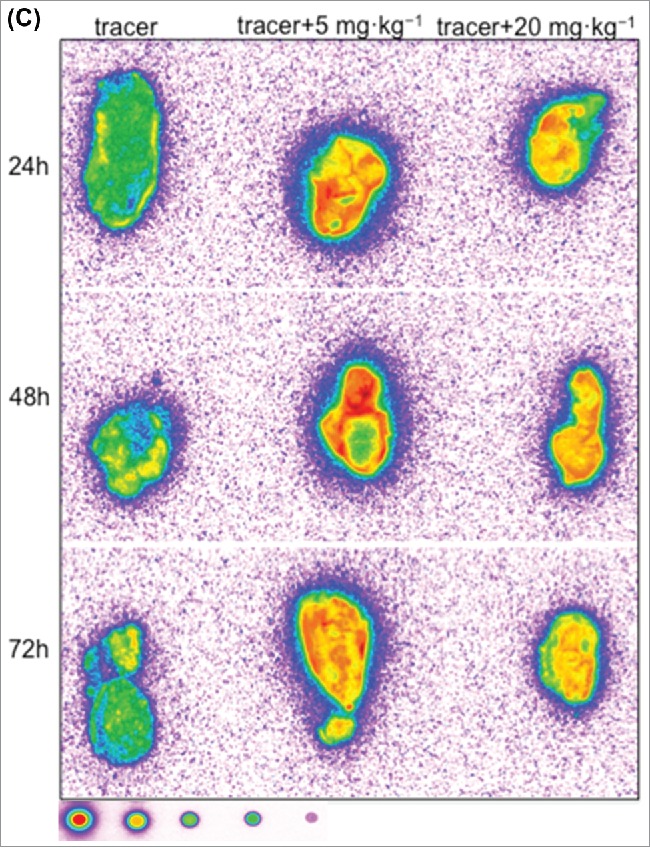
Tumor macro-autoradiography data revealed that 125I- PRO304397 distribution in tumors was consistent with blood kinetics and was time dependent (Fig. 6A and 6C). At early time points, distribution of the signal was associated with the periphery of the tumor, while a more homogenous signal (periphery and core), although weaker, was accomplished in the tumors dosed with the higher antibody concentration. These effects were observed in both MC38 and Cloudman tumors (Fig. 6A and 6C).
Figure 6.
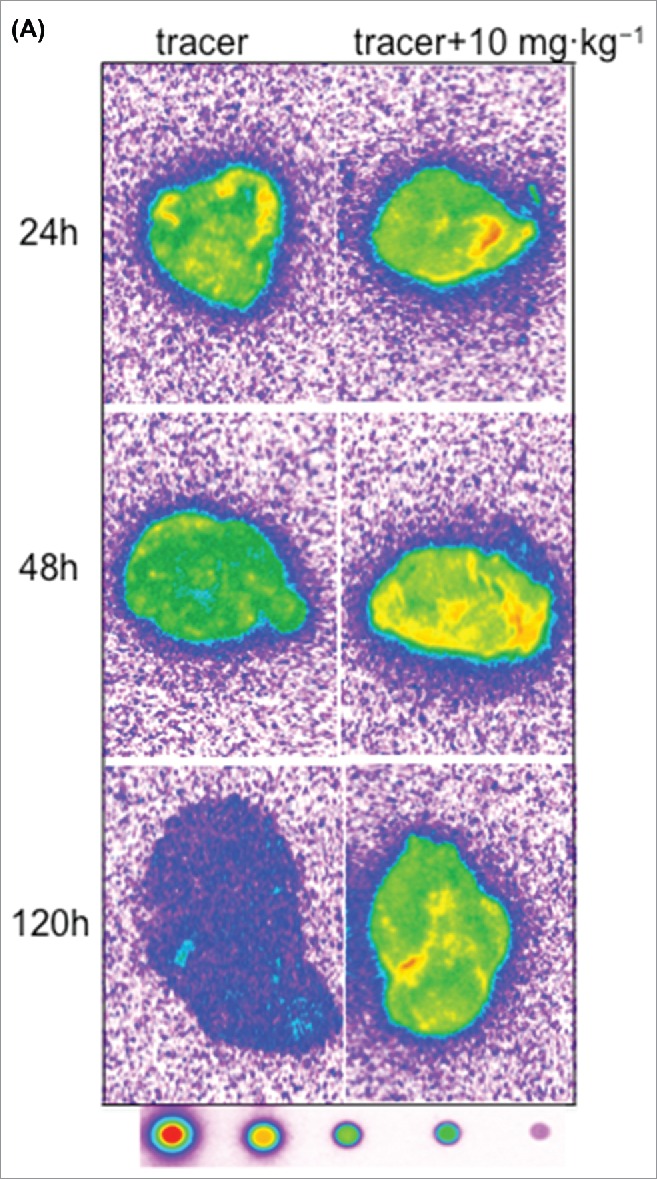
Representative autoradiography images of sagittal tumor sections in tumor-bearing mice following intravenous administration of 125I- PRO304397 tracer or 125I- PRO304397 tracer + unlabeled PRO304397. (A) Autoradiography sections of MC38 tumors at 24, 48, and 120 h after administration of 125I-PRO304397 tracer alone or 125I- PRO304397 tracer + 10 mg·kg−1 unlabeled PRO304397, respectively. A heat map (below the tumor images) shows the range of radioactivity from red being the highest to purple the lowest. (B) Representative sagittal sections of MC38 tumors showing cell distribution of 125I- PRO304397-associated signal by MAR (left) and H&E (right), respectively at 24 and 48 h following 125I- PRO304397 tracer alone or 125I- PRO304397 tracer + 10 mg·kg−1unlabeled PRO304397. (C) Autoradiography sections of Cloudman tumors at 24, 48, and 72 h after administration of 125I- PRO304397 tracer alone or 125I-PRO304397 tracer+ unlabeled PRO304397 at 5 and 10 mg·kg−1, respectively. Heat map depicts pseudocolor intensities as described above.
Figure 6.
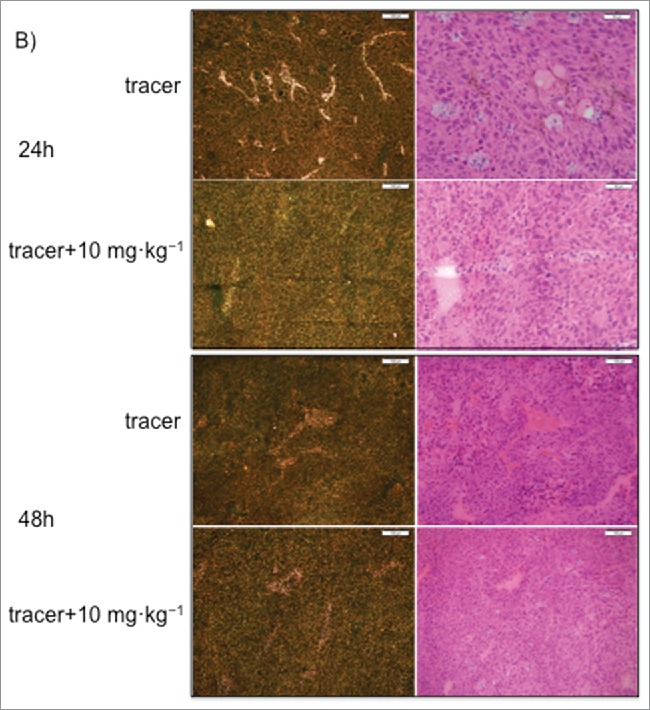
Figure 6.
(Continued).
MAR results shown that the 125I- PRO304397 signal was primarily associated with tumor vasculature with little or no diffusion into the tumor parenchyma in MC38 tumors. Signal outside of vascular channels was limited to areas of necrosis, i.e., areas of vascular disruption. A more diffuse but weaker signal was detected in the higher dose groups, which is suggestive of diffusion into viable tumor cells, with occasional vascular accentuation (Fig. 6B). Similar results were observed in the Cloudman tumors; however, the extensively involved necrosis in this particular isograft model made the determination of signal in viable tumor tissue challenging.
Mechanistic physiological studies
The average vascular volume (Vv) and interstitial volume (Vi) calculated for MC38 tumor (9 ± 3 µL·g−1 and 609 ± 124 μL·g−1) and Cloudman tumor (23 ± 13 μL·g−1 and 229 ± 65 μL·g−1) were statistically different (p<0.05), which is due to differences in inherent physiological properties of these 2 isograft models, with the MC38 model having more interstitial fluid space between cells, and the Cloudman tumor having more blood cell-containing vascular space. No differences were detected in blood flow rate (Q) in MC38 tumor (82 ± 26 µL·g−1·min−1) and Cloudman tumor (87 ± 18 μL·g−1·min−1), which is consistent with the previous measurement in KPL4 xenograft model.4 The measured physiologic parameters for various tissues in MC38 and Cloudman tumor-bearing mice are summarized in Table S4.
Discussion
To gain a better understanding of the therapeutic potentials of MPDL3028A, we assessed its PK in monkeys, PK/PD of PRO304397 in mice, and tissue distribution and tumor penetration of PRO304397 in tumor-bearing mouse models.
MPDL3280A was engineered for reduced Fc effector function via a single amino acid substitution at position 298 (Asn to Ala); this substitution impairs the binding of MPDL3280A to Fcγ receptors, and so minimizes in vivo depletion of tumor-specific T cells expressing high levels of PD-L1 (and PD-1). PRO304397, a chimeric antibody, contains the PD-L1 binding region from MPDL3280A (i.e., variable regions) in the context of a mouse IgG2a framework, and also showed reduced Fc-mediated effector function. Analogous to MPDL3280A, PRO304397 was produced in Chinese hamster ovary (CHO) cells and contains 2 mutations (D266A, N298A) in the Fc domain to prevent efficient binding to murine Fcγ receptors. In additional, PRO304397 and MPDL3280A have similar PD-L1 binding affinity and blocking properties toward both human and mouse PD-L1 (for example, dissociation constant KD to human PD-L1 is 0.4 nM10 and the IC50 for blocking the binding of recombinant human/murine PDL1 to recombinant human/murine PD1 is ∼80–100 nM). Thus, PRO304397 could be used for the mouse nonclinical studies to minimize immunogenicity. MPDL3280A binds to PD-L1 in monkey and human with comparable affinity between species. It has been shown that surrogate antibodies in rodents and human antibodies in monkeys display 100% concordance with human PD.15,16
The nonlinear (dose–dependent) PK of anti-PD-L1 molecules due to TMDD resulting from binding to its endogenous targets in both mice and monkeys was expected. The PK linearity of anti-PD-L1 in mice and monkeys was only assessed based on initial exposure to minimize the confounding effect of ATA on the linearity interpretation. ATA generally does not have an effect on the early phase of PK because it takes some time to develop an immune response (i.e., ATA generation).12 The initial exposure AUC0–4 of PRO304397 in mice is not dose proportional between 1 and 10 mg·kg−1and approximately dose proportional between 10 and 30 mg·kg−1. Similarly, the initial exposure AUC0–7 of MPDL3280A in monkeys is not dose proportional between 0.5 and 5 mg·kg−1and approximately dose proportional between 5 and 20 mg·kg−1. The non-linear PK data suggest that the total clearance of anti-PD-L1 comprises a specific (target-mediated) clearance component and a non-specific clearance component, with the specific clearance component having a greater contribution at the lower doses. In monkeys, the estimated CL for MPDL3280A was 3.70 mL·day−1·kg−1 in the linear dose range, which is within the expected range of clearance of a typical human/humanized IgG1.13 This observation was later confirmed in the Phase 1 study, in which MPDL3280A preliminary PK were consistent with a typical IgG1 at doses greater than 1 mg·kg−1 every 3 weeks (q3w).9,10 Of note, MEDI4736, another anti-PD-L1 mAb, also exhibited nonlinear PK over the dose range of 0.1 to 10 mg.kg−1 every 2 weeks (q2w) in the Phase 1 study and approached linearity at ≥3 mg.kg−1 q2w.17,18
Using Equation 1 (see Method section), it is anticipated that ∼90% and ∼96% saturation of PD-L1 is achieved at ∼0.18 and ∼0.5 µg·mL−1, respectively. The result of the calculation is consistent with experimental observation from the PK/PD study, which showed a relationship between antibody dose and duration of PD-L1 saturation on peripheral blood lymphocytes in mice, and PD-L1 on the peripheral blood lymphocytes was fully saturated when the anti-PD-L1 concentration was > ∼0.5 µg·mL−1. Further, it is expected that after multiple doses of antibody, PD-L1 on the peripheral blood lymphocytes will remain saturated for a longer period of time as long as the antibody concentration remains > ∼0.5 µg·mL−1. This is consistent with results from studies of the anti-PD-1 antibody MDX1106.19 However, it is not clear whether these findings in peripheral blood lymphocytes reflect PD-L1 occupancy in the tumor. The above theoretical PD-L1 occupancy calculation may not be applied to the tumor site due to uncertainty on the equation assumptions.
Nonlinear plasma PK for PRO304397 was observed across the dose groups in the tissue distribution study in MC38 and Cloudman tumor-bearing mouse models, with PK within the linear range for 7 d at doses ≥ 20 mg·kg−1 (Figs. 4A and 5A). There was some evidence of blood cell binding that could be saturated at doses ≥ 1 mg·kg−1. Since PD-L1 is known to be expressed on lymphocytes,5 it is likely that PRO304397 binds to these cells in the blood cell pellet. PRO304397 is distributed specifically to the spleen, lungs, liver, kidneys, and heart, as indicated by the dose-dependent decrease in radioactivity (Figs. 4B and 5B). PD-L1 has also been detected on vascular endothelial cells, and so distribution to these highly perfused tissues is consistent with that expression pattern.5 Furthermore, the spleen functions as a filter for lymphocytes, so part of the signal in this tissue may also be due to antibody bound to these cells in the spleen. Doses ≥ 10 mg·kg−1 were able to saturate target-mediated uptake in these non-tumor tissues in both models. It has been shown that saturation of targets in non-tumor tissue can lead to desirable tumor uptake and acceptable exposure to antibody.20
Since a large portion of the antibody distributed to the non-tumor tissues, the radioactivity level in the tumor was relatively low and variable. However, increasing the dose of unlabeled PRO304397 did improve tumor uptake, up to a maximum dose, beyond which no further improvement was observed (Figs. 4B and 5B). At first glance, this may seem to be counterintuitive based on the concept of competitive inhibition; however, it is important to recognize that blocking receptor binding in non-tumor tissues (e.g., liver, kidneys, lungs, heart, and spleen) may actually encourage tumor uptake and/or exposure of radioactivity by increasing systemic (plasma) exposure of 125I-PRO304397 tracer. This increase in overall tumor uptake does not necessarily indicate that 125I-PRO304397 tracer is bound to receptor because the radiometric biodistribution study does not distinguish between free interstitial vs. receptor-bound antibody.
MC38 is a murine colorectal carcinoma model that expresses higher PD-L1 levels21 and has a higher interstitial volume than the Cloudman murine melanoma model (Table S1). MC38 is also more sensitive to PRO304397 treatment than the Cloudman model.21 However, the different tumor physiology and target expression level did not affect the distribution of the antibody to the tumor as the tumors displayed similar radioactivity uptake. In order to determine the dose needed to maintain linearity in the tumors for a given length of time, the tumor interstitial to plasma (I:P) radioactivity ratios were determined (Figs. 4C and 5C), as previously described.20 A plateau in I:P ratio vs. dose implies that no additional specific binding and uptake took place beyond that period; thus, the additional therapeutic benefit of those higher doses is questionable.22 As such, a dose of 1 mg·kg−1would be able to maintain linearity in tumors for about 24 hours 3 mg·kg−1for 120 hours and 10 mg·kg−1for 168 h. This corresponds to plasma concentrations of approximately 2–8 µg·mL−1 in both models, which is higher than the concentration required for peripheral PD-L1 saturation described above.
PRO304397 distribution and penetration into MC38 and Cloudman tumors is dose and time dependent, which is consistent with its blood PK. Thus, the highest levels of PRO304397 associated radioactivity and more homogeneous distribution within the tumor were achieved by the highest dose compared to the distribution of the lower dose of PRO304397 administrated in this study (Fig. 6A and 6C). In addition, a trend to penetrate the tumor parenchyma relative to the vasculature of the tumor was also attained by increasing the dose of PRO304397 (Fig. 6B).
Preclinical tumor uptake and penetration data from these studies could be used to characterize the relationship between tumor uptake and dose of MPDL3280A in order to provide additional information for clinical dose selection. It has been reported that preclinical efficacy in xenografts may predict the clinical efficacy.23,24 Therefore, understanding the exposure-response relationship for drug candidates in a preclinical model could aid in predicting the optimal dose and regimen in patients.25 For example, the active plasma concentration of cetuximab in a mouse xenograft model was fairly comparable with those observed in patients.26 A mechanism-based model could add additional values for translational purpose. Here we described our first effort, an empirical approach, to inform clinical dose selection. The data from the current studies had important translational values because they provided the basis for selection of target trough serum concentration at steady-state (Ctrough,ss) of MPDL3280A, which informed the target dose and regimen selection based on interim PK data from the Phase 1 clinical trial. The target dose for MPDL3280A was selected based on described non-clinical tissue distribution data in tumor-bearing mice, target receptor occupancy in tumor, the MPDL3280A interim PK in humans and other factors. The target Ctrough,ss was selected to be 6 μg·mL−1 based on the following assumptions (Fig. S5): 1) 95% tumor receptor saturation is needed for efficacy; 2) the tumor I:P ratio is 0.30 based on tissue distribution data in tumor-bearing mice (Fig. 5); and 3) combination with bevacizumab will decrease tumor penetration by at least ∼30% based on Genentech's historical data27 if combination therapy with bevacizumab is considered. Based on the interim MPDL3280A PK data in humans, the minimum dose to maintain Ctrough,ss ≥ 6 μg·mL−1in ≥ 90% patients is 4 mg·kg−1 every 3 weeks (q3w). However, there are some well-known challenges in predicting the clinical efficacious dose based on preclinical data.25 Saturating targets allows for plasma and tumor concentrations to remain within the linear range; however this is only desirable if target saturation is linked to efficacy. Thus, it is important to take into account other factors, such as dose, patient variability, antigen density/turnover, tumor burden, and/or degree of tumor perfusion in order to provide an exposure margin for efficacy in clinical trials. Indeed, MPDL3280A anti-tumor activity occurred across doses from 1 to 20 mg·kg−1q3w in a large Phase 1 study.10 The 15 mg·kg−1q3w dose (the equivalent fixed dose of 1,200 mg q3w) is being moved forward in clinical development and demonstrates striking anti-tumor activities.11
In summary, the PK of MPDL3280A and PRO304397 was non-linear in monkeys and mice, respectively, in the dose range tested. Complete saturation of PD-L1 in blood in mice was achieved at serum concentrations of PRO304397 above ∼0.5 µg·mL−1. Tissue distribution and tumor penetration studies of PRO304397 in tumor-bearing mice indicated that saturation of target-mediated uptake in non–tumor tissues and desirable exposure in tumors were achieved at higher serum concentrations. A higher dose of PRO304397 resulted in a greater penetration into tumors and a relatively longer duration of PD-L1 saturation in tumors. The biodistribution data indicated that the efficacious dose is mostly likely higher than that estimated based on simple PK/PD in blood. These data also allowed for estimation of the target clinical dose and further development of MPDL3280A.
Methods
Antibodies
MPDL3280A was generated at Genentech Inc. and was provided in a clear liquid form for the in vivo monkey PK study. PRO304397, a CHO cell-derived reverse chimera and mouse IgG2a DANA antibody against murine PD-L1, was used to assess the PK/PD relationship in mice and also in the mouse tissue distribution and tumor penetration studies. A histidine buffer (20 mM his-acetate, 0.02% polysorbate 20, 240 mM sucrose, pH 5.5) was used as the vehicle control and as the diluent for MPDL3280A and PRO304397.
Radiochemistry
PRO304397 was radioiodinated with iodine-125 (125I) using the indirect iodogen addition method as previously described.28 The radiolabeled protein was purified using NAP5™ column pre-equilibrated in PBS. The specific activity of 125I- PRO304397 was 10 µCi·µg−1. The radiolabeled antibody was shown to maintain ∼90% antigen binding relative to their unmodified counterpart by enzyme-linked immunosorbent assay (ELISA) and was shown to be intact by size-exclusion HPLC.
Pharmacokinetic and pharmacodynamic study in BALB/c mice
All in vivo protocols, housing, and anesthesia in mice were approved by the Institutional Animal Care and Use Committee at Genentech, Inc. Female BALB/c mice received a single IV dose of 0 (vehicle), 1, 10, or 30 mg·kg−1 of PRO304397 via the tail vein (n = 21/group) in the PK/PD study to evaluate the linearity and PK/PD relationship over a broad dose range. Blood samples were collected via retro-orbital bleeds performed on alternating eyes from each animal in each dosing group at the following time points (n = 3/time point): 30 min, and 8 h and processed for serum for the PK analysis. The terminal blood sample was collected via cardiac puncture from each animal in each dosing group at the following time points (n = 3/time point): 1, 2, 4, 7, 14, 21 and 28 d, and processed for serum for the PK analysis and whole blood for the PD analysis. An additional three mice were used for pre-dose PD measurement.
Pharmacokinetic study in cynomolgus monkeys
The PK study in cynomolgus monkeys was approved by the Institutional Animal Care and Use Committee and conducted at Charles River Laboratories (Sparks, NV). Two female and 2 male cynomolgus monkeys were assigned to each of 3 treatment groups and given a single IV bolus dose of 0.5, 5, or 20 mg·kg−1 of MPDL3280A each to evaluate the linearity over a broad range. Blood samples (∼1 mL) for PK and anti-therapeutic antibody (ATA) analysis were collected from each animal via the femoral vein and processed for serum. PK samples were collected on day 0 (pre-dose, 0.5, and 12 hpost-dose), and 1, 3, 5, 7, 14, 21, 28, 35, 42, 49 and 56 d, while ATA samples were collected pre-dose (7 d prior to dosing and on day 0) and 14, 28, 42, and 56 d.
In vivo biodistribution in tumor-bearing mice
Female C57BL/6 mice of 6–8 weeks of age were inoculated subcutaneously with 1 × 10⁵ MC38 cells (murine colorectal cancer cells, a sensitive model to PRO304397 treatment) suspended in Hank's Balanced Salt Solution (HBSS) and matrigel in the right unilateral thoracic flank 3 weeks prior to receiving the radiolabeled material. Female DBA-2 mice of the same age range were inoculated subcutaneously with 1 × 10⁵ Cloudman S91 cells (murine melanoma cells, a less sensitive model to PRO304397 treatment; referred to below as Cloudman) suspended in HBSS and matrigel in the right unilateral thoracic flank 3 weeks before receiving the radiolabeled material. A pilot study was conducted to determine the dose levels and tissue sample collection time points. When the tumors were around 300 mm3, the mice were co-dosed with 200 µCi·kg−1 125I-PRO304397 along with unlabeled PRO304397 at 0, 0.3, 1, 3, 10, 20, or 40 mg·kg−1via IV bolus. At 24, 120, or 168 h post-dose, blood (processed for plasma), tumor, lungs, liver, kidneys, spleen, heart, and muscle (gastrocnemius) were collected (n = 3/time point/dose). All samples were counted for radioactivity on a gamma counter (Wallac 1480 Wizard 3″, EC&G Wallac, Turku, Finland). The radioactivity level in each sample was calculated and expressed as percentage of injected dose per gram or milliliter of sample (%ID·g−1 or %ID·mL−1). Significance was assessed using a one-way ANOVA followed by the Tukey's post-test (GraphPad Prism).
Intratumoral distribution
Macro- and micro-autoradiography methods were performed to characterize the intratumoral distribution of the 125I-PRO304397-associated signal. Tumor–bearing mice (either MC38 or Cloudman), as described above, were dosed with 500 uCi·kg−1 125I- PRO304397 alone (tracer-dose equivalent to 0.1 mg·kg−1) or mixed with unlabeled PRO304397 to complete a dose of 10 mg·kg−1 in the MC38 tumor model or 5 and 20 mg·kg−1 in the Cloudman tumor model. Mice (n = 2/time point/group) were sacrificed at 24, 48, 120, and 168 h post-dose for the MC38 tumor-bearing mice, and at 24, 48, or 72 h post-dose for the Cloudman tumor-bearing mice. Tumors were collected from each mouse, rinsed in phosphate-buffered saline (PBS), patted dry and placed in a cryobath and stored at −70°C. Serial cryosectioning of the tumor was performed in order to assess the tissues by macro-autoradiography, following the quantitative whole-body autoradiography methodology described previously29 or emulsion micro-autoradiography (MAR) described as follows: cryosections of ∼5 microns thick were processed for MAR by dipping in Kodak NTB Emulsion (889 5666; Eastman Kodak) and allowed to develop in the dark at 4°C. At the end of the exposure period (21 days), the sections were developed using Kodak Developer (146–4593; Eastman Kodak) and then fixed using Kodak Fixer (190–1875; Eastman Kodak). After routine hematoxylin and eosin (H&E) counterstaining, dehydration, clearing and cover-slipping, the sections were evaluated using bright- and dark-field microscopy. The morphology of the cells depicted by H&E staining was used to differentiate vascular cells from those of the tumor parenchyma.
Mechanistic physiological studies
The vascular volumes, interstitial volumes, and rates of blood flow of MC38 and Cloudman tumors were measured in vivo by the indirect method for 99mTc red blood cell labeling,30 jugular cannula infusion of 111In-pentetate, and intravenous bolus injection of 86Rb chloride, respectively, as previously described.31
Pharmacokinetic assay for PRO304397
Mouse serum samples were analyzed by ELISA using a plate coated with human PD-L1.Fc (fragment crystallizable) to capture PRO304397. Diluted samples, standards, and controls were added to the plate and incubated. Subsequently, the antibody was detected with goat anti-mouse IgG2a horseradish peroxidase (HRP). A peroxidase substrate (tetramethyl benzidine) was added to develop color, and the reaction was stopped by adding 1 M phosphoric acid. The plates were read at 450 nm for detection absorbance and 630 nm for reference absorbance. The reporting range of the assay was 0.391–25 ng/mL−1 PRO304397 (in-well concentrations). The minimum dilution for mouse serum samples was 1:20, resulting in a minimum quantifiable concentration (MQC) of 7.8 ng·mL−1. Intra-assay precision was 2%, 2% and 3%, respectively, for low, middle and high quality control concentrations. Inter-assay precision was 6%, 8% and 11%, respectively, for low, middle and high quality control concentrations.
Pharmacokinetic assay for MPDL3280A
An indirect antigen ELISA with a colorimetric detection system was validated for the quantitation of MPDL3280A in cynomolgus monkey serum. Microtiter plates were coated with recombinant protein human PD-L1. Fc to capture the MPDL3280A. Diluted samples, standards, and controls were added to the plate and incubated. Subsequently, a biotinylated 10C4 (anti-framework antibody raised against Genentech's IgG1 framework, Genentech, Inc.,) followed by an avidin HRP were added for detection and incubated. Tetramethyl benzidine was added, and the reaction was stopped by adding 1 M phosphoric acid and the plates were read as described above. The reporting range of the assay was 0.75–25 ng/mL−1 MPDL3280A (in-well concentrations). The minimum dilution for cynomolgus monkey serum samples was 1:100, resulting in a MQC of 75 ng·mL−1. Intra-assay precision was 2%, 3% and 6%, respectively, for low, middle and high quality control concentrations. Inter-assay precision was 5%, 3% and 3%, respectively, for low, middle and high quality control concentrations.
Anti-therapeutic antibody assay
A colorimetric, bridging ELISA assay was validated to detect antibodies to MPDL3280A (i.e., ATA) in cynomolgus monkey serum. The assay used a master mix of biotinylated MPDL3280A and digoxigen in conjugated MPDL3280A to capture antibodies directed against MPDL3280A. Diluted samples and controls were added to a polypropylene microtiter plate and co-incubated with the master mix solution overnight. Samples were then transferred to a pre-washed Pierce Reacti-Bind™ streptavidin high binding capacity coated plate and incubated. An HRP-conjugated mouse monoclonal anti-digoxin antibody was subsequently added for detection. After incubation, the plates were developed and read as described above. Since a minimum sample dilution of 1:50 was required, the sensitivity of the assay was log10 5.0 – 1.7 titer units.
Flow cytometry assay to determine free PD-L1 expression levels
Saturation was measured by directly assessing the level of unoccupied PD-L1 sites remaining after dosing in comparison with pre-dose levels by flow cytometry. Whole blood samples were kept on wet ice until processed using a lyse/wash/stain procedure. Briefly, red blood cells were lysed and then the mononuclear cells were washed and stained. Immunostaining was performed using commercially available fluorescently conjugated antibodies (BD Biosciences, San Jose, CA) to identify CD4+ T helper and CD8+ cytotoxic T lymphocytes. A biotinylated preparation of PRO304397 was included in the same panel to allow for determination of free membrane PD-L1 expression. Streptavidin-phycoerythrin (SA-PE) was used to detect bound biotinylated PRO304397 or trastuzumab (Herceptin®) isotype control. Fluorescence was measured by flow cytometry (BD FACSCanto II). Molecules of equivalent fluorescence (MOEF) were calculated by multiplying the normalized geometric mean fluorescence intensity values (GMFI) of each population with a standard curve generated by a SpheroTech Beads standard (Lake Forest, IL). The mean (+/− SD) MOEF PD-L1 values for each dose group and vehicle group (n = 3) were plotted against study days.
The following equation was used to calculate PD-L1 occupancy under certain assumptions:
| (1) |
where [Ab] is anti-PD-L1 concentration and binding affinity KD is dissociation constant. This equation assumes that the in vivo and in vitro binding affinities are similar and that equilibrium between PD-L1 and anti-PD-L1 can be reached very quickly.
Pharmacokinetic data analysis
Mouse serum concentration-time profiles were used to estimate following PK parameters using non-compartmental analysis (WinNonlin, version 5.2.1; Pharsight Corporation, Mountain View, CA): total drug exposure defined as area under the serum concentration−time curve extrapolated to infinity (AUCinf, calculated using the log-linear trapezoidal rule), clearance (CL), volume of distribution at steady state (Vss), and observed maximum serum concentration (Cmax). Because all of the monkeys developed an ATA response, estimations of clearance and halflife were not possible due to the limited data set and an incomplete characterization of the terminal phase. Only the area under the serum concentration-time curve from time 0 to Day 7 (AUC0–7) and Cmax were calculated in monkey using non-compartmental analysis. Naïve pooled approach was used for murine estimates to provide one estimate for each dose group, while for monkey estimates, each animal was analyzed separately and results for each dose group were summarized as mean ± standard deviation (SD). In addition, data from the 3 monkeys (1 animal in 5 mg·kg−1 group and 2 animals in 20 mg·kg−1 group) with serum concentration-time profiles that were in the linear range and did not appear to be affected by the presence of ATAs were fitted to a 2 compartment model (WinNonlin, version 5.2.1; Pharsight Corporation, Mountain View, CA) for the following parameters: CL, Vss, and β phase half-life (t1/2,β). Using mean estimates obtained from these 3 monkeys, simulations were conducted for all dose levels (WinNonlin, version 5.2.1; Pharsight Corporation, Mountain View, CA).
Supplementary Material
Disclosure of potential conflicts of interest
All authors are employees of Genentech, Inc., a member of the Roche Group, and stockholders in Roche Holdings AG during their involvement in this study.
References
- 1.Thompson RH, Kuntz SM, Leibovich BC, Dong H, Lohse CM, Webster WS, Sengupta S, Frank I, Parker AS, Zincke H, et al.. Tumor B7-H1 is associated with poor prognosis in renal cell carcinoma patients with long-term follow-up. Cancer Res 2006; 66:3381-5; PMID:16585157; http://dx.doi.org/ 10.1158/0008-5472.CAN-05-4303 [DOI] [PubMed] [Google Scholar]
- 2.Hino R, Kabashima K, Kato Y, Yagi H, Nakamura M, Honjo T, Okazaki T, Tokura Y. Tumor cell expression of programmed cell death-1 ligand 1 is a prognostic factor for malignant melanoma. Cancer 2010; 116:1757-66; PMID:20143437; http://dx.doi.org/ 10.1002/cncr.24899 [DOI] [PubMed] [Google Scholar]
- 3.Hamanishi J, Mandai M, Iwasaki M, Okazaki T, Tanaka Y, Yamaguchi K, Higuchi T, Yagi H, Takakura K, Minato N, et al.. Programmed cell death 1 ligand 1 and tumor-infiltrating CD8+ T lymphocytes are prognostic factors of human ovarian cancer. Proc Natl Acad Sci U S A 2007; 104:3360-5; PMID:17360651; http://dx.doi.org/ 10.1073/pnas.0611533104 [DOI] [PMC free article] [PubMed] [Google Scholar]
- 4.Blank C, Gajewski TF, Mackensen A. Interaction of PD-L1 on tumor cells with PD-1 on tumor-specific T cells as a mechanism of immune evasion: implications for tumor immunotherapy. Cancer Immunol Immunother 2005; 54:307-14; PMID:15599732; http://dx.doi.org/ 10.1007/s00262-004-0593-x [DOI] [PMC free article] [PubMed] [Google Scholar]
- 5.Keir ME, Butte MJ, Freeman GJ, Sharpe AH. PD-1 and its ligands in tolerance and immunity. Annu Rev Immunol 2008; 26:677-704; PMID:18173375; http://dx.doi.org/ 10.1146/annurev.immunol.26.021607.090331 [DOI] [PMC free article] [PubMed] [Google Scholar]
- 6.Blank C, Mackensen A. Contribution of the PD-L1/PD-1 pathway to T-cell exhaustion: an update on implications for chronic infections and tumor evasion. Cancer Immunol Immunother 2007; 56:739-45; PMID:17195077; http://dx.doi.org/ 10.1007/s00262-006-0272-1 [DOI] [PMC free article] [PubMed] [Google Scholar]
- 7.Dolan DE, Gupta S. PD-1 pathway inhibitors: changing the landscape of cancer immunotherapy. Cancer Control 2014; 21:231-7; PMID:24955707. [DOI] [PubMed] [Google Scholar]
- 8.Chen DS, Irving BA, Hodi FS. Molecular pathways: next-generation immunotherapy–inhibiting programmed death-ligand 1 and programmed death-1. Clin Cancer Res 2012; 18:6580-7; PMID:23087408; http://dx.doi.org/ 10.1158/1078-0432.CCR-12-1362 [DOI] [PubMed] [Google Scholar]
- 9.Herbst RS, Gordon MS, Fine GD, Sosman JA, Soria J, Hamid O, Powderly JD, Burris HA, Mokatrin A, Kowanetz M, et al.. A study of MPDL3280A, an engineered PD-L1 antibody in patients with locally advanced or metastatic tumors. Journal of Clinical Oncology, 2013 ASCO Annual Meeting Abstracts. Vol 31: No 15_suppl (May 20 Supplement), 2013, 3000 [Google Scholar]
- 10.Herbst RS, Soria JC, Kowanetz M, Fine GD, Hamid O, Gordon MS, Sosman JA, McDermott DF, Powderly JD, Gettinger SN, et al.. Predictive correlates of response to the anti-PD-L1 antibody MPDL3280A in cancer patients. Nature 2014; 515:563-7; PMID:25428504; http://dx.doi.org/ 10.1038/nature14011 [DOI] [PMC free article] [PubMed] [Google Scholar]
- 11.Powles T, Eder JP, Fine GD, Braiteh FS, Loriot Y, Cruz C, Bellmunt J, Burris HA, Petrylak DP, Teng SL, et al.. MPDL3280A (anti-PD-L1) treatment leads to clinical activity in metastatic bladder cancer. Nature 2014; 515:558-62; PMID:25428503; http://dx.doi.org/ 10.1038/nature13904 [DOI] [PubMed] [Google Scholar]
- 12.Chirmule N, Jawa V, Meibohm B. Immunogenicity to therapeutic proteins: impact on PK/PD and efficacy. AAPS J 2012; 14:296-302; PMID:22407289; http://dx.doi.org/ 10.1208/s12248-012-9340-y [DOI] [PMC free article] [PubMed] [Google Scholar]
- 13.Hotzel I, Theil FP, Bernstein LJ, Prabhu S, Deng R, Quintana L, Lutman J, Sibia R, Chan P, Bumbaca D, et al.. A strategy for risk mitigation of antibodies with fast clearance. mAbs 2012; 4:753-60; PMID:23778268; http://dx.doi.org/ 10.4161/mabs.22189 [DOI] [PMC free article] [PubMed] [Google Scholar]
- 14.Boswell CA, Bumbaca D, Fielder PJ, Khawli LA. Compartmental tissue distribution of antibody therapeutics: experimental approaches and interpretations. AAPS J 2012; 14:612-8; PMID:22648903; http://dx.doi.org/ 10.1208/s12248-012-9374-1 [DOI] [PMC free article] [PubMed] [Google Scholar]
- 15.Martin PL, Bugelski PJ. Concordance of preclinical and clinical pharmacology and toxicology of monoclonal antibodies and fusion proteins: soluble targets. Br J Pharmacol 2012; 166:806-22; PMID:22168335; http://dx.doi.org/ 10.1111/j.1476-5381.2011.01812.x [DOI] [PMC free article] [PubMed] [Google Scholar]
- 16.Bugelski PJ, Martin PL. Concordance of preclinical and clinical pharmacology and toxicology of therapeutic monoclonal antibodies and fusion proteins: cell surface targets. Br J Pharmacol 2012; 166:823-46; PMID:22168282; http://dx.doi.org/ 10.1111/j.1476-5381.2011.01811.x [DOI] [PMC free article] [PubMed] [Google Scholar]
- 17.Fairman D, Narwal R, Liang M, Robbins PB, Schneider A, Chavez C, Lu H, Pak M, Blake-Haskins A, Vasselli J, et al.. Pharmacokinetics of MEDI4736, a fully human anti-PDL1 monoclonal antibody, in patients with advanced solid tumors. Journal of Clinical Oncology, 2014 ASCO Annual Meeting Abstracts. Vol 32: No 15_suppl (May 20 Supplement), 2014: 2602 [Google Scholar]
- 18.Song X, Pak M, Chavez C, Liang M, Lu H, Schwickart M, Blake-Haskins JA, Robbins PB, Jin X, Gupta AK, et al.. Pharmacokinetics and pharmacodynamics of MEDI4736, a fully human antiprogrammed death ligand 1 (PD-L1) monoclonal antibody, in patients with advanced solid tumors. J Clin Oncol 2015; 33; http://dx.doi.org/ 10.1200/JCO.2015.61.2408 [DOI] [Google Scholar]
- 19.Brahmer JR, Drake CG, Wollner I, Powderly JD, Picus J, Sharfman WH, Stankevich E, Pons A, Salay TM, McMiller TL, et al.. Phase I study of single-agent anti-programmed death-1 (MDX-1106) in refractory solid tumors: safety, clinical activity, pharmacodynamics, and immunologic correlates. J Clin Oncol 2010; 28:3167-75; PMID:20516446; http://dx.doi.org/ 10.1200/JCO.2009.26.7609 [DOI] [PMC free article] [PubMed] [Google Scholar]
- 20.Bumbaca D, Xiang H, Boswell CA, Port RE, Stainton SL, Mundo EE, Ulufatu S, Bagri A, Theil FP, Fielder PJ, et al.. Maximizing tumour exposure to anti-neuropilin-1 antibody requires saturation of non-tumour tissue antigenic sinks in mice. Br J Pharmacol 2012; 166:368-77; PMID:22074316; http://dx.doi.org/ 10.1111/j.1476-5381.2011.01777.x [DOI] [PMC free article] [PubMed] [Google Scholar]
- 21.Irving BA. Optimizing the Therapeutic Potential of PD-L1 Blockade as a Single Agent and Through Combination Therapy. SITC 27th Annual Meeting Bethesda North Marriott Hotel & Conference Center, North Bethesda, MD, 2012. [Google Scholar]
- 22.Fujimori K, Covell DG, Fletcher JE, Weinstein JN. Modeling analysis of the global and microscopic distribution of immunoglobulin G, F(ab')2, and Fab in tumors. Cancer Res 1989; 49:5656-63; PMID:2790783 [PubMed] [Google Scholar]
- 23.Peterson JK, Houghton PJ. Integrating pharmacology and in vivo cancer models in preclinical and clinical drug development. Eur J Cancer 2004; 40:837-44; PMID:15120039; http://dx.doi.org/ 10.1016/j.ejca.2004.01.003 [DOI] [PubMed] [Google Scholar]
- 24.Wong H, Choo EF, Alicke B, Ding X, La H, McNamara E, Theil FP, Tibbitts J, Friedman LS, Hop CE, et al.. Antitumor activity of targeted and cytotoxic agents in murine subcutaneous tumor models correlates with clinical response. Clin Cancer Res 2012; 18:3846-55; PMID:22648270; http://dx.doi.org/ 10.1158/1078-0432.CCR-12-0738 [DOI] [PubMed] [Google Scholar]
- 25.Bleeker WK, Munk ME, Mackus WJ, van den Brakel JH, Pluyter M, Glennie MJ, Van De Winkel JG, Parren PW. Estimation of dose requirements for sustained in vivo activity of a therapeutic human anti-CD20 antibody. Br J Haematol 2008; 140:303-12; PMID:18045353; http://dx.doi.org/ 10.1111/j.1365-2141.2007.06916.x [DOI] [PubMed] [Google Scholar]
- 26.Luo FR, Yang Z, Dong H, Camuso A, McGlinchey K, Fager K, Flefleh C, Kan D, Inigo I, Castaneda S, et al.. Correlation of pharmacokinetics with the antitumor activity of Cetuximab in nude mice bearing the GEO human colon carcinoma xenograft. Cancer Chemother Pharmacol 2005; 56:455-64; PMID:15947929; http://dx.doi.org/ 10.1007/s00280-005-1022-3 [DOI] [PubMed] [Google Scholar]
- 27.Pastuskovas CV, Mundo EE, Williams SP, Nayak TK, Ho J, Ulufatu S, Clark S, Ross S, Cheng E, Parsons-Reponte K, et al.. Effects of anti-VEGF on pharmacokinetics, biodistribution, and tumor penetration of trastuzumab in a preclinical breast cancer model. Mol Cancer Ther 2012; 11:752-62; PMID:22222630; http://dx.doi.org/ 10.1158/1535-7163.MCT-11-0742-T [DOI] [PubMed] [Google Scholar]
- 28.Chizzonite R, Truitt T, Podlaski FJ, Wolitzky AG, Quinn PM, Nunes P, Stern AS, Gately MK. IL-12: monoclonal antibodies specific for the 40-kDa subunit block receptor binding and biologic activity on activated human lymphoblasts. J Immunol 1991; 147:1548-56; PMID:1715362 [PubMed] [Google Scholar]
- 29.Pastuskovas CV, Mallet W, Clark S, Kenrick M, Majidy M, Schweiger M, Van Hoy M, Tsai SP, Bennett G, Shen BQ, et al.. Effect of immune complex formation on the distribution of a novel antibody to the ovarian tumor antigen CA125. Drug Metab Dispos 2010; 38:2309-19; PMID:20823292; http://dx.doi.org/ 10.1124/dmd.110.034330 [DOI] [PubMed] [Google Scholar]
- 30.Boswell CA, Ferl GZ, Mundo EE, Schweiger MG, Marik J, Reich MP, Theil FP, Fielder PJ, Khawli LA. Development and evaluation of a novel method for preclinical measurement of tissue vascular volume. Mol Pharm 2010; 7:1848-57; PMID:20704296; http://dx.doi.org/ 10.1021/mp100183k [DOI] [PubMed] [Google Scholar]
- 31.Boswell CA, Ferl GZ, Mundo EE, Bumbaca D, Schweiger MG, Theil FP, Fielder PJ, Khawli LA. Effects of anti-VEGF on predicted antibody biodistribution: roles of vascular volume, interstitial volume, and blood flow. PLoS One 2011; 6:e17874; PMID:21436893; http://dx.doi.org/ 10.1371/journal.pone.0017874 [DOI] [PMC free article] [PubMed] [Google Scholar]
Associated Data
This section collects any data citations, data availability statements, or supplementary materials included in this article.