Abstract
Super nonfouling surfaces resist protein adhesion and have a broad field of possible applications in implant technology, drug delivery, blood compatible materials, biosensors, and marine coatings. A promising route toward nonfouling surfaces involves liquid repelling architectures. The authors here show that soot-templated super-amphiphobic (SAP) surfaces prepared from fluorinated candle soot structures are super nonfouling. When exposed to bovine serum albumin or blood serum, x-ray photoelectron spectroscopy and time of flight secondary ion mass spectrometry analysis showed that less than 2 ng/cm2 of protein was adsorbed onto the SAP surfaces. Since a broad variety of substrate shapes can be coated by soot-templated SAP surfaces, those are a promising route toward biocompatible materials design.
I. INTRODUCTION
Effective nonfouling materials should resist nonspecific protein adsorption and cell adhesion. Nonfouling surface coatings are crucial for the advancement of implant technology, drug delivery, blood compatible materials, biosensors, and marine coatings.1–4 In blood-related applications, the reduction of nonspecific protein adsorption has the potential to significantly reduce inflammation, blood platelet activation and thrombosis, fibrosis, encapsulation, and infection, since protein adsorption is often the first stage in biological interactions with surfaces.5 For blood applications, it has been shown that extremely small amounts (e.g., 5–10 ng/cm2) of fibrinogen adsorbed onto an engineered surface can trigger platelet activation, resulting in catastrophic device failure, blood clotting, and thrombosis.6–9
The “traditional” strategies to prevent nonspecific protein adsorption are based on hydrophilic and zwitterionic surface modifications. A well studied hydrophilic material for surface coatings is poly(ethylene glycol) (PEG). PEG-based materials, such as polymer brushes and self-assembled monolayers (SAMs), have been the gold standard in protein resistance studies for two decades and have been studied in detail for their ability to prevent protein attachment.10,11 The disadvantage of PEG-based materials is their susceptibility to oxidative degradation under physiological conditions.12 Other strategies to prevent nonspecific protein adsorption include coatings with polyzwitterionic materials like sulfobetaines, trimethylamine-sulfate- and carboxylic acid complexes, as well as natural amino acids.13–16
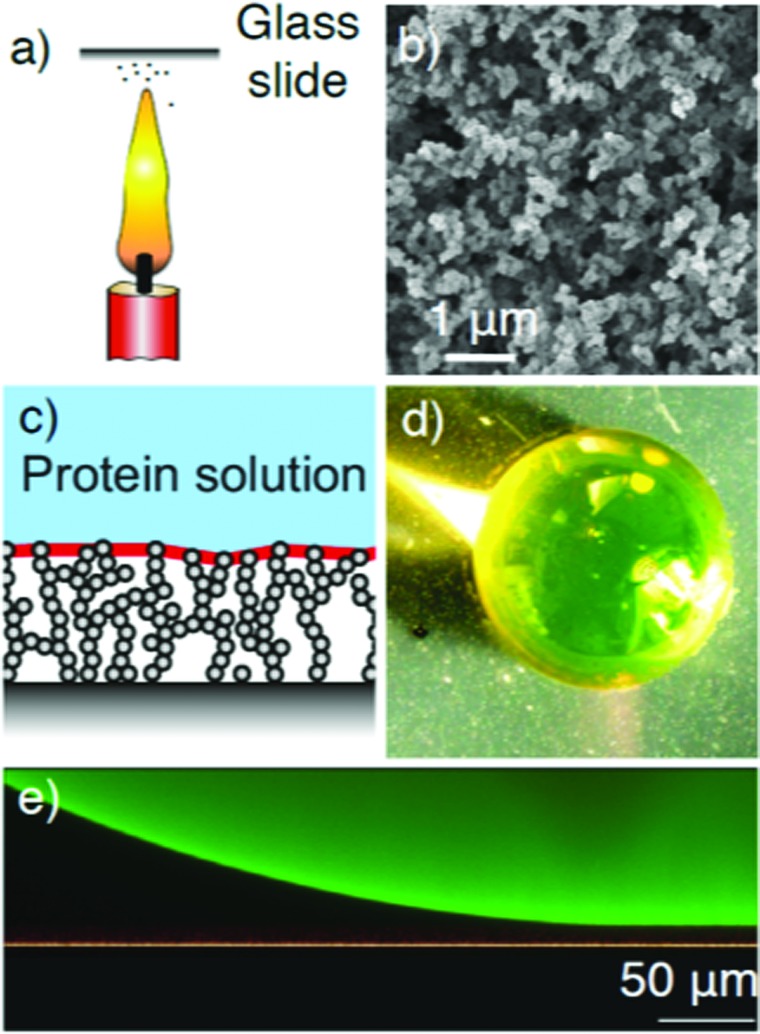
Recently, super liquid-repellent surfaces with micro- or nanometer scale roughness and texture and hydrophobic chemistries have been discussed as promising protein repelling materials.17,18 Deng et al.19 have prepared liquid-repelling surfaces based on fluorinated nanoporous materials prepared from silanized candle soot (Fig. 1). These surfaces have been shown to be super-amphiphobic (SAP)—to effectively repel both water and oil. Since the material works without embedded liquids, the coating is promising to prepare blood compatible material for dialysis and gas exchange membranes.20 In a proof of principle study, it has been demonstrated that blood will not adhere macroscopically to the SAP surfaces.20 Additionally, blood coagulation was not observed on the SAP surfaces.
Fig. 1.
Super-amphiphobic surfaces. (a) Candle soot is deposited onto glass cover slides. (b) The nanoporous soot structures shown in the SEM image are first silanized and then rendered hydrophobic in a fluorination step. (c) Schematic of the interaction of protein solutions with super-amphiphobic surfaces. The protein solution is not wetting the surface and protein adsorption is suppressed. (d) Photo of a BSA solutions droplet on a super-amphiphobic surface. The solution is repelled by the surfaces. (e) The laser scanning confocal image of the BSA droplet on the surface shows there is a air cushion between the surface and the droplet.
However, for a material to be considered blood compatible, the tolerance for proteins adsorbing onto the surface is extremely small (5–10 ng/cm2).9 While soot-based super-amphiphobic surfaces hold great promise as nonfouling materials, protein resistance at this level has not been tested. In view of the extremely small amounts of protein involved in platelet activation, we here evaluate the protein resistance of soot-based super-amphiphobic coatings with surface sensitive x-ray photoelectron spectroscopy (XPS) and time-of-flight secondary ion mass spectrometry (ToF-SIMS). Both techniques have been shown to be able to detect proteins on surfaces in the range of ng/cm2 sensitivity.21,22 Janus pillar arrays—which attract small but significant amounts of proteins—are used as control surfaces to quantify the XPS measurements. The soot-based surface structures and the interaction with protein solutions are shown in Fig. 1.
II. EXPERIMENT
A. Chemicals
Tetraethylorthosilicate (TEOS, 98%), trichloro(1H,1H,2H,2H-perfluorooctyl)silane (97%), and bovine serum albumin (BSA[p1]) were purchased from Sigma-Aldrich (Germany). Ammonium hydroxide aqueous solution was obtained from Normapur (28%). Dulbecco's phosphate buffered saline (PBS) was purchased from Gibco by life technologies (UK). Paraffin candles (TIP Haushaltskerzen, 100% paraffin, wick: 100% cotton) were obtained from Real-Handels GmbH, Germany. All reagents were used as received.
B. Preparation of super-amphiphobic samples
Super-amphiphobic samples were prepared based on the protocol presented by Deng et al.19 Polished 1 × 1 cm2 silicon wafers from Si-Mat (Germany) were ultrasonicated in toluene, acetone, and ethanol for 5 min, respectively. After drying (40 °C at 250 mbar), the silicon substrates were activated by a 2 min oxygen plasma at 300 W. Subsequently, a layer of silica was deposited by chemical vapor deposition (CVD) of TEOS. For the CVD process, the substrates were transferred to a desiccator for 24 h together with two glass bottles containing 3 ml of TEOS and ammonia, respectively. This prelayer was found to increase the adhesion of the super-amphiphobic coating to the wafer and hence to reduce the risk of coating delamination. Candle soot particles were collected by dragging the pretreated substrates 15 s through the flame of a paraffin candle. The candle soot template was stabilized by CVD of TEOS following the procedure described above. After deposition of the silica shell, the inside carbon region was combusted in a furnace at 600 °C in the presence of air for 3.5 h (VKM-22, Linn High Therm GmbH, Germany) yielding hydrophilic samples. Hydrophobization of the surfaces was performed in a desiccator in the presence of 100 μl of trichloro(1H,1H,2H,2H-perfluorooctyl)silane for 3 h at 25 mbar. Finally, the residual fluorosilane was removed from the samples at 100 mbar and 80 °C for 3 h. As control sample, clean silicon wafers were hydrophobized following the same protocol.
C. Preparation of Janus pillars arrays
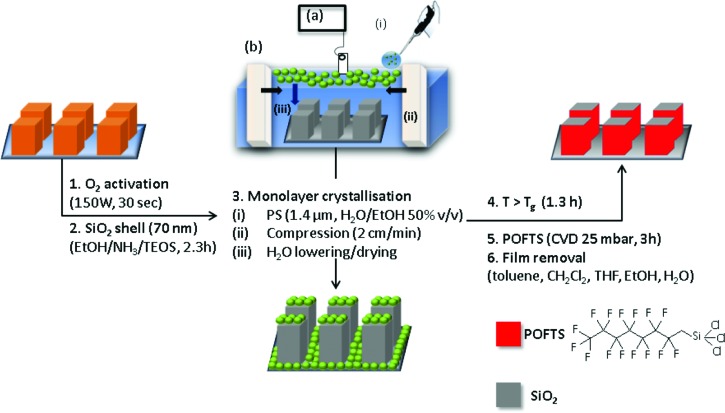
Arrays of squared flat-top micropillars were fabricated on 170 μm thick glass slides by photolithography of the negative photoresist SU-8. A silica shell of approximately 70 nm was deposited using the Stöber reaction to improve the mechanical stability. After activation of the samples under O2 plasma (30 s, 150 W, and flow rate of 7 sccm), they were immersed in a solution of tetraethoxysilane (1.82 ml) and ammonium hydroxide (28% in water, 4.2 ml) in ethanol (50 ml) for 2.3 h. In a final step, the micropillars were rinsed with ethanol and dried in a N2 stream. Hydrophobization of the system was achieved by CVD following the procedure described above (Fig. 2).
Fig. 2.
Protocol for the preparation of the Janus pillars. In the third step, the solution containing polystyrene particles is gently deposited in the air water interphase (i) of a Langmuir trough filled with water (b). The Teflon barriers are compressed at a low rate (ii) until the colloids self-assemble in a hexagonal arrangement. The process is monitored following the surface pressure vs covered area plot recorded by using a Wilhelmy plate connected to a force detector (a). After lowering the level of water, the packed colloids are gently deposited on the surface mainly by van der Waals forces.
To prepare Janus pillars, the top faces need to be shielded during hydrophobization. Therefore, we coated the top faces first with a monolayer of polystyrene particles. The particle-decorated pillars were merged into a film by heating at above polystyrene glass transition temperature (120 °C, 1 h). After the sidewalls were hydrophobized following the already mentioned CVD procedure, the colloidal film was removed by washing with tetrahydrofuran, toluene, ethanol, and Milli-Q water. The substrates exhibited hydrophobic wetting properties on the sidewalls and hydrophilic wetting properties on the tops of the pillars.
D. Incubation experiments
The protein solutions were prepared by dissolving BSA in PBS at the respective concentrations. For the XPS experiments with serum, whole blood was taken at the Department of Transfusion Medicine, University Medicine Mainz, Germany, from ten healthy donors after obtaining informed consent in accordance with the Declaration of Helsinki. To prevent coagulation, Li-Heparin was added to the blood. Plasma was separated from blood cells by centrifugation. Human heparinized plasma from all donors was pooled into one batch and stored at −80 °C. Prior to use the plasma, it was centrifuged at 3.200g for 15 min to remove any protein aggregates. The human heparinized plasma had a protein concentration of 66 mg/ml. For ToF-SIMS experiments, bovine serum was used accordingly.
For the adsorption experiments, 12 well plates were used as incubation containers. The wells were filled with 3 ml of 1 mg/ml BSA in PBS solution and human heparinized plasma, respectively. Super-amphiphobic samples were submerged for 2 and 24 h, respectively. Super-amphiphobic samples were submerged in human heparinized plasma for 2 h. As control, super-amphiphobic samples were incubated in PBS. Additionally, fluorinated silicon wafers were incubated in PBS and in 1 mg/ml BSA in PBS solution for 2 h, respectively. During incubation, the 12 well plates were sealed with Parafilm tape and stored at room temperature. Every sample was washed with 3 ml of PBS after incubation. Also, several super-amphiphobic samples were subjected to a second incubation cycle for 2 and 24 h, respectively, and again washed with 3 ml of PBS prior to performing the XPS analysis.
E. Scanning electron microscopy
Samples were visualized by scanning electron microscopy (SEM, LEO 1530 Gemini). The cross sections were sputtered with 6 nm Pt to enhance image quality (BalTec MED 020 Modular High Vacuum Coating System, Argon at 2 × 10⁻² mbar and 60 mA). Cross sections of super-amphiphobic samples were taken at a gun voltage of 0.7 kV (InLens detector) while top views were obtained at 1.5 kV (Everhart-Thornley detector).
F. Laser scanning confocal microscopy
An image of the air cushion existing between the super-amphiphobic surface (orange) and a droplet of protein solution (1 mg/ml BSA in PBS buffer solution, green) was taken with an inverted laser scanning confocal microscopy (LSCM, Leica TCS SP8 SMD). The microscope has a horizontal resolution of about 300 nm and a vertical resolution of about 1 μm, for the used 40× dry objective. The protein was fluorescently labeled with Alexa Fluor 488, so the argon line at 488 nm was used to excite. The obtained image is a result of reflection from the substrate and fluorescence from the protein solution superposition.
G. X-ray photoelectron spectroscopy
XP spectra were acquired using a Kratos Axis Ultra system (Kratos, Manchester, England) (take-off angle: 0°, X-ray source: monochromatic Al, detector mode: hybrid, pass energy: 80 eV). Atomic compositions were calculated with casa xps (Casa Software, Ltd.). Peak areas of Si 2p, O 1s, F 1s, and C 1s were calculated from survey scans. The peak area of N 1s was obtained by narrow region scans with 70 scans per spot.
H. Time-of-flight secondary ion mass spectrometry
ToF-SIMS spectra were acquired using an Iontof ToF-SIMS V equipped with a 25 kV Bi liquid metal ion gun. Spectra were collected in the positive and negative modes using Bi3+ ions. A spot size of 100 × 100 μm was used. Typical current at the surface was between 0.07 and 0.13 pA with a cycle time of 200 μs. The total primary ion dose was maintained at 7.5 × 10¹¹ ions/cm2 for all samples.
III. RESULTS AND DISCUSSION
A. XPS
XPS can quantify the chemical composition of surfaces. Owing to the shallow escape depth of the detected photoelectrons, XPS analyses the outermost 2–10 nm and has been widely used in biology and biomaterials research to determine the amount of proteins bound to biological surfaces and model substrates.23 As XPS can detect small amounts of interfacial proteins, it is particularly useful to test the protein resistance of novel nonfouling polymer surfaces24,25 and SAMs.26
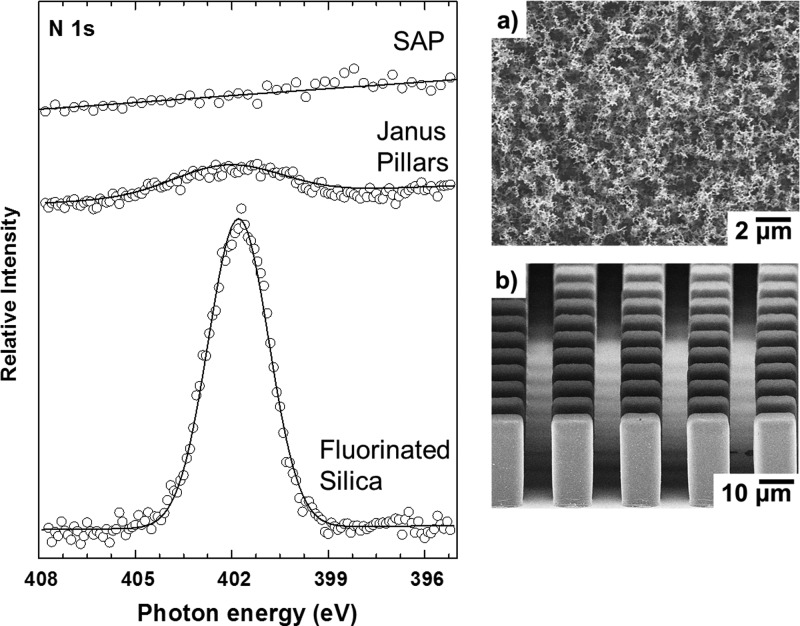
Typical elements detected with XPS for proteins include nitrogen, carbon, and oxygen. While the latter two are also present in the SAP surfaces, nitrogen is unique to the proteins. Therefore, we used the N 1s emission within the XP spectrum as a marker element to monitor protein adsorption. Figure 3 shows N 1s XP spectra for a super-amphiphobic surface and several reference materials. Figure 3(a) shows a SEM image of the SAP surface structure. All samples were incubated in protein solutions and subsequently rinsed with PBS. The latter step is a standard method used27 to avoid the Langmuir-Blodgett film deposition when removing the samples through the water air interface. Furthermore, this step prevents drying of the protein solution at the sample surface which would erroneously show protein binding.
Fig. 3.
XP spectra and SEM images of SAP surface and reference materials, [amphiphilic Janus pillars with pillar size w = 10 μm, h = 22 μm, and a surface fraction of 19.6% and with trichloro(1H,1H,2H,2H-perfluorooctyl)silane fluorinated flat silica coated silicon wafer], all incubated for 2 h in a solution of BSA in phosphate buffer (1 mg/ml): The emission centered near 402 eV observed for the pillar structure and the fluorinated flat surface is related to nitrogen groups within BSA adsorbed to the surfaces.
The representative N 1s spectrum of a super-amphiphobic surface incubated for 2 h in a 1 mg/ml BSA solution is featureless. Any nitrogen present was below the detection level of the XPS. The presented spectrum was averaged over 70 scans within the nitrogen region—approximately ten times more scans that typically used for protein film quantification.
Super-amphiphobic surfaces are known to be fragile structures. To show that the coating remains its protein resistance after an exposure and rinsing cycle, we performed a double adsorption experiment: following the rinsing and air drying step, the sample was exposed to the protein solution for a second time. If any parts of the SAP structure would have been damaged during the rinsing process, those sites would now have lost their fluorine coating. These exposed hydrophilic silica areas should effectively bind proteins when in contact with the protein solution. A variety of proteins are known to readily bind to silica surfaces and form densely packed monolayers.27 Again, the spectra of the nitrogen region showed no visible nitrogen signal (supplementary material).35
We further tested if SAP surfaces can withstand complete wetting and protein adsorption over extended periods of exposure time to liquids.28 Certain liquid repelling surfaces can only withstand wetting for short time before adsorbed proteins lower the interfacial energy, favoring wetting of the entire surface. In the case of the super-amphiphobic surfaces presented here, we did not observe any nitrogen on samples incubated for up to 48 h (supplementary material for the XP spectra), an exposure time greater than the time needed to achieve an equilibrium surface concentration of proteins (approximately 1 h).29
To test whether the protein resistance depended on the protein concentration or type, we also repeated the experiment with 20 mg/ml BSA solution as well as human blood serum. Again, the XP spectra did not show any detectable nitrogen on the super-amphiphobic surfaces.
In order to quantify the detection limit of protein adsorption to the super-amphiphobic surface with XPS (Table I), we prepared Janus-type micropillar array structures30 as a control substrate [Fig. 3(b)]. The structure consists of SU-8 photoresist micropillars with a hydrophilic silica top and fluorinated, hydrophobic sides. The advantage of Janus-type micropillars is that only the top hydrophilic area adsorbs proteins, allowing the protein adsorption to be measured on a small controlled area. The solid–liquid–vapor three-phase contact line created on the Janus pillars lies and moves along the hydrophilic top faces of the pillars. As the structure is superhydrophobic, a mobile air layer prevents or hinders the approach of proteins to the lower sidewalls and accumulates proteins on the top of the pillars.31 This effect cannot be found on flat fluorinated surfaces, where reduced contact angles are created and the liquid is in full contact with solid fraction. As stated by Koc et al.,5 kinetics of protein adsorption on flat hydrophobic surfaces is faster than the phenomena on superhydrophobic materials. Though it has been already suggested that the latter do not strictly avoid protein adhesion, the binding strength is reduced by the required conformational changes of proteins to reach superhydrophobic structures. In conclusion, shear forces generated by the washing steps easily remove most of the adsorbed material in comparison to flat fluorinated surfaces. The N 1s XP spectrum for the protein exposed Janus micropillars is shown in Fig. 3. The atomic percentage of nitrogen on the Janus pillar sample () was 0.09 at. % ± 0.02 at. %. We estimate the detection limit using
| (1) |
Table I.
Summary of XPS determined elemental compositions for protein adsorption onto super-amphiphobic surfaces. The standard deviation is in parentheses. The samples with BSA adsorbed on fluorinated silica surfaces exhibited the highest nitrogen content. While nitrogen was still detectable at the Janus pillars top faces, it was not detectable for the SAP surfaces.
| C | N | F | O | Si | |
|---|---|---|---|---|---|
| SAP + BSA 24 h | 26.9(2.3) | nda | 36.1(3.1) | 26.9(2.3) | 16.2(1.3) |
| SAP + serum 24 h | 29.7(2.1) | nda | 34.8(2.5) | 29.7(2.1) | 17.1(1.1) |
| Fluorinated silica + BSA | 32.8(0.7) | 2.4(0.1) | 33.1(0.9) | 14.3(0.4) | 17.3(1) |
| Janus pillars + BSA | 14.9(0.1) | 0.09(0.02) | 28.3(2.4) | 36.6(1) | 20.2(1.4) |
Not detected.
Here, , , , , , and are the surface density of BSA at full monolayer coverage, the atomic percentage of nitrogen on the Janus Pillars, the atomic percentage of nitrogen on the fluorinated silicon dioxide, the standard deviation of the noise of the Janus Pillars XP spectrum, the maximum intensity of the Janus Pillars XP spectrum, and the surface density of our detection limit, respectively. Assuming that full monolayer coverage of BSA (), a typical blood protein, corresponds to 350 ng/cm2,21 we estimated the protein detection limit () using the atomic composition of nitrogen from a BSA coated fluorinated silicon dioxide surface (Fig. 3). The nitrogen concentration for the BSA coated fluorinated silicon dioxide surface () was 2.4 at. %. Using the definition of the detection limit as three times the standard deviation of the noise, we estimate that less than 2 ng/cm2 of BSA are adsorbed to the super-amphiphobic surfaces. This amount is below the proposed critical amount of surface protein, which could, among other factors, lead to platelet activation.32
B. ToF-SIMS
ToF-SIMS is a surface specific mass spectrometry method with a detection limit for proteins down to 0.1 ng/cm2.21,22
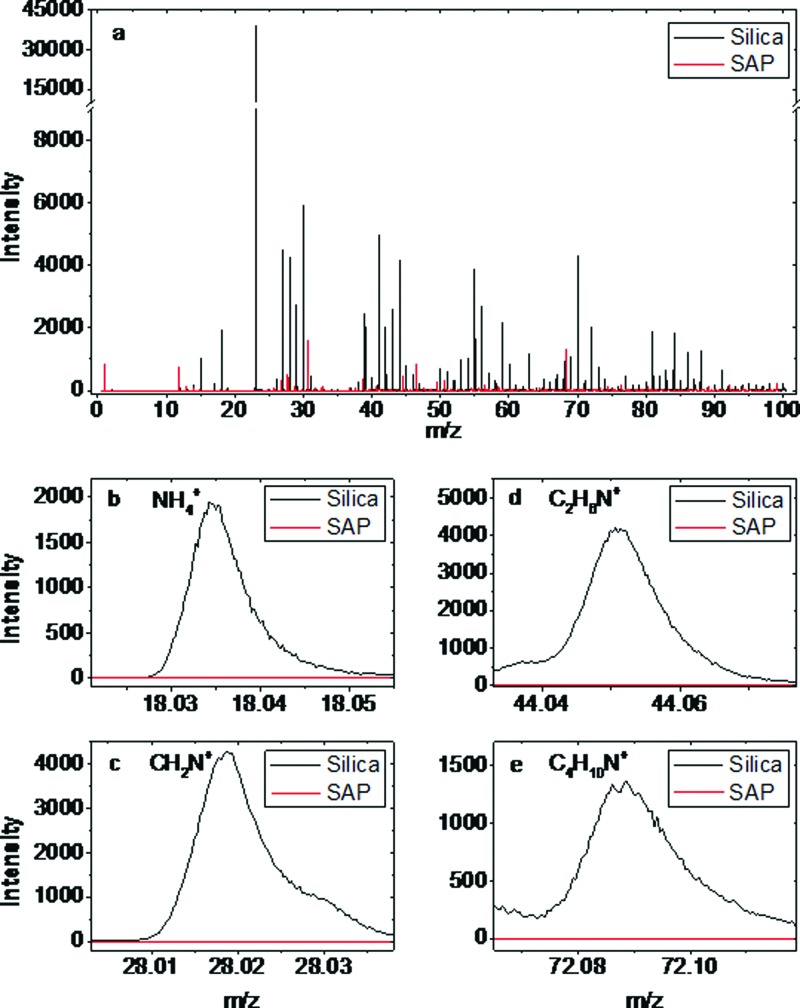
Figure 4 displays SIMS spectra for super-amphiphobic samples incubated in 1 mg/ml BSA solutions and blood serum for 30 min. Silica glass substrates incubated in a 1 mg/ml BSA solution for 30 min served as positive control samples. The positive ion spectra for the silica glass substrate showed protein related peaks such as m/z = 18.03 (NH4+), m/z= 28.02 (CH2N+), m/z = 44.05 (C2H6N+), and m/z = 72.08 (C4H10N+). The spectra for the super-amphiphobic surfaces exhibit only substrate related peaks such as m/z = 69 (C3HO2+), m/z = 31 (CF+), m/z = 46.98 (SiF+), or m/z= 39.02 (C3H3+). No protein-related peaks were detectable.
Fig. 4.
ToF SIMS spectra for silica and SAP surfaces exposed to BSA solutions (1 mg/ml). While the silica surface shows typical mass fragments for proteins, the super-amphiphobic surfaces only show peaks related to carbon and silica.
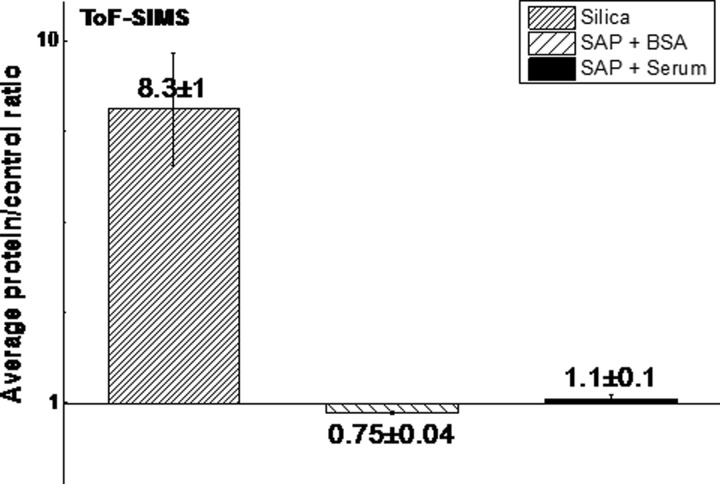
Table II lists the protein related peaks used to compare the SAP surface with the silica surfaces (positive control). Here, we only include fragments from the 20 amino acids,33,34 which did not overlap with substrate peaks. Representative positive ion spectra for the super-amphiphobic samples and the control surface related to protein fragments are shown in Figs. 4(b)–4(e). The average intensity ratio from each of the protein peaks for samples incubated in protein solutions versus samples incubated in PBS listed is summarized in Fig. 5. The peak ratio for the silica control surface was 8.3, significantly larger than 1, which confirms protein adsorption. The peak ratios for super-amphiphobic surfaces incubated with BSA and full bovine serum were indistinguishable from 1. Therefore, ToF-SIMS did not detect an increased intensity in protein related fragments after incubation of the super-amphiphobic surface in either BSA or bovine serum solutions.
Table II.
List of calculated, protein specific positive ion fragments used for ToF-SIMS data analysis.
| Source | Mass | Species |
|---|---|---|
| Protein specific positive ion fragments | ||
| All | 18.03 | NH4+ |
| Glycine | 28.02 | CH2N+ |
| Alanine | 44.05 | C2H6N+ |
| Tyrosine | 55.02 | C3H3O+ |
| Serine | 60.04 | C2H6NO+ |
| Proline | 68.05 | C4H6N+ |
| Proline | 70.07 | C4H8N+ |
| Valine | 72.08 | C4H10N+ |
| Threonine | 74.06 | C3H8NO+ |
| Histidine | 81.05 | C4H5N2+ |
| Glutamine | 84.04 | C4H6NO+ |
| Lysine | 84.08 | C5H10N+ |
| Glycine | 85.04 | C3H5N2O+ |
| Isoleucine | 86.10 | C5H12N+ |
| Aspartic acid | 88.04 | C3H6NO2+ |
| Arginine | 100.09 | C4H10N3+ |
| Arginine | 101.10 | C4H11N3+ |
| Tyrosine | 107.05 | C7H7O+ |
| Arginine/Histidine | 110.07 | C5H8N3+ |
| Phenylalanine | 120.08 | C8H10N+ |
| Arginine | 127.10 | C5H11N4+ |
| Tyrosine | 136.08 | C8H10NO+ |
Fig. 5.
Average peak ratios between silica and SAP substrates incubated for 30 min in protein solutions vs PBS. Protein solutions were 1 mg/ml BSA or full bovine serum. The error bars represent the standard deviation.
IV. SUMMARY AND CONCLUSIONS
XPS and ToF-SIMS analysis were employed to determine the amount of protein adsorbed onto candle soot-templated super-amphiphobic surfaces. The results demonstrate that the SAP surface are super nonfouling, with the amount of protein adsorbed from blood serum and 20 mg/ml BSA solutions remaining below the instrumental detection limit of 2 ng/cm2.
Protein–surface interactions are determined both by topography and chemistry. The SAP surfaces present both a hydrophobic surface and a micropatterned surface which results in liquid repelling behavior. This hydrophobic micropattern creates an air cushion that keeps the protein away from the surface and resists adsorption. This shows super-amphiphobic surfaces are promising candidates for use in designing biomaterial surfaces, especially for blood-related applications where extremely small amounts of proteins can cause platelet activation, which, if uncontrolled, can lead to critical medical complications. A synergistic effect between lower accessible solid areas due to liquid repellency along with the air cushion present at the minimal interaction of the protein solution with the surface is expected to be the driving force for protein repellency. The sample preparation involved rinsing with clean PBS after exposure to the PBS solution. As previously proposed by Koc et al.,5 it is possible that adsorbed proteins are more easily washed off from the surface due to the higher shear forces near the surface due to liquid–solid interfacial slip.
ACKNOWLEDGMENTS
This work was supported by the Max Planck Graduate Center with the Johannes Gutenberg-Universität Mainz (MPGC). H.J.B. thanks the ERC for the advanced Grant No. 340391-SUPRO. L.S. and T.W. thank the European Commission (CIG Grant No. 322124) and the Deutsche Forschungsgemeinschaft (WE4478/4-1) for financial support. N.E. thanks the Marie Skłodowska-Curie fellowship 660523-NoBios-ESR. The authors would also like to acknowledge Susanne Schöttler and Volker Mailänder for providing the human serum plasma and Frank Schellenberger for the help and expertise with confocal microscopy. D.J.G. and D.G.C. were supported by Grant No. EB-002027 from the United States National Institutes of Health.
References
- 1. Ratner B. D. and Bryant S. J., Annu. Rev. Biomed. Eng. , 41 (2004). 10.1146/annurev.bioeng.6.040803.140027 [DOI] [PubMed] [Google Scholar]
- 2. Genzer J. and Efimenko K., Biofouling , 339 (2006). 10.1080/08927010600980223 [DOI] [PubMed] [Google Scholar]
- 3. Nir S. and Reches M., Curr. Opin. Biotechnol. , 48 (2016). 10.1016/j.copbio.2015.12.012 [DOI] [PubMed] [Google Scholar]
- 4. Banerjee I., Pangule R. C., and Kane R. S., Adv. Mater. , 690 (2011). 10.1002/adma.201001215 [DOI] [PubMed] [Google Scholar]
- 5. Koc Y., de Mello A. J., McHale G., Newton M. I., Roach P., and Shirtcliffe N. J., Lab Chip , 582 (2008). 10.1039/b716509a [DOI] [PubMed] [Google Scholar]
- 6. Park K., Mao F. W., and Park H., J. Biomed. Mater. Res. , 407 (1991). 10.1002/jbm.820250311 [DOI] [PubMed] [Google Scholar]
- 7. Grunkemeier J. M., Tsai W. B., McFarland C. D., and Horbett T. A., Biomaterials , 2243 (2000). 10.1016/S0142-9612(00)00150-2 [DOI] [PubMed] [Google Scholar]
- 8. Ratner B. D., Biomaterials , 5144 (2007). 10.1016/j.biomaterials.2007.07.035 [DOI] [PMC free article] [PubMed] [Google Scholar]
- 9. Shen M. C., Martinson L., Wagner M. S., Castner D. G., Ratner B. D., and Horbett T. A., J. Biomater. Sci. , 367 (2002). 10.1163/156856202320253910 [DOI] [PubMed] [Google Scholar]
- 10. Harris J. M., Poly(Ethylene Glycol) Chemistry ( Springer, New York, 1992), p. 1. [Google Scholar]
- 11. Li L. Y., Chen S. F., Zheng J., Ratner B. D., and Jiang S. Y., J. Phys. Chem. B , 2934 (2005). 10.1021/jp0473321 [DOI] [PubMed] [Google Scholar]
- 12. Sawhney A. S., Pathak C. P., and Hubbell J. A., Macromolecules , 581 (1993). 10.1021/ma00056a005 [DOI] [Google Scholar]
- 13. Stein M. J., Weidner T., McCrea K., Castner D. G., and Ratner B. D., J. Phys. Chem. B , 11550 (2009). 10.1021/jp9015867 [DOI] [PMC free article] [PubMed] [Google Scholar]
- 14. Zhang Z., Zhang M., Chen S. F., Horbetta T. A., Ratner B. D., and Jiang S. Y., Biomaterials , 4285 (2008). 10.1016/j.biomaterials.2008.07.039 [DOI] [PubMed] [Google Scholar]
- 15. Chen S. F., Cao Z. Q., and Jiang S. Y., Biomaterials , 5892 (2009). 10.1016/j.biomaterials.2009.07.001 [DOI] [PubMed] [Google Scholar]
- 16. Yang R., Jang H., Stocker R., and Gleason K. K., Adv. Mater. , 1711 (2014). 10.1002/adma.201304386 [DOI] [PMC free article] [PubMed] [Google Scholar]
- 17. Shastry A., Goyal S., Ratner B., and Böhringer K. F., paper presented at the 10th International Conference on Miniaturized Systems for Chemistry and Life Sciences, Tokyo, Japan, 2006. (unpublished). [Google Scholar]
- 18. Pernites R. B., Santos C. M., Maldonado M., Ponnapati R. R., Rodrigues D. F., and Advincula R. C., Chem. Mater. , 870 (2012). 10.1021/cm2007044 [DOI] [Google Scholar]
- 19. Deng X., Mammen L., Butt H.-J., and Vollmer D., Science , 67 (2012). 10.1126/science.1207115 [DOI] [PubMed] [Google Scholar]
- 20. Paven M., Papadopoulos P., Schöttler S., Deng X., Mailänder V., Vollmer D., and Butt H.-J., Nat. Commun. , 2512 (2013) 10.1038/ncomms3512. [DOI] [PMC free article] [PubMed] [Google Scholar]
- 21. Wagner M. S., McArthur S. L., Shen M., Horbett T. A., and Castner D. G., J. Biomater. Sci. , 407 (2002). 10.1163/156856202320253938 [DOI] [PubMed] [Google Scholar]
- 22. Kingshott P., McArthur S., Thissen H., Castner D. G., and Griesser H. J., Biomaterials , 4775 (2002). 10.1016/S0142-9612(02)00228-4 [DOI] [PubMed] [Google Scholar]
- 23. Wagner M. S., Horbett T. A., and Castner D. G., Biomaterials , 1897 (2003). 10.1016/S0142-9612(02)00612-9 [DOI] [PubMed] [Google Scholar]
- 24. Tokuda K., Noda M., Maruyama T., Kotera M., and Nishino T., Polym. J. , 328 (2015). 10.1038/pj.2014.131 [DOI] [Google Scholar]
- 25. Bernards M. T., Cheng G., Zhang Z., Chen S. F., and Jiang S. Y., Macromolecules , 4216 (2008). 10.1021/ma800185y [DOI] [Google Scholar]
- 26. Bourg M. C., Badia A., and Lennox R. B., J. Phys. Chem. B , 6562 (2000). 10.1021/jp9935337 [DOI] [Google Scholar]
- 27. Sanni O. D., Wagner M. S., Briggs D., Castner D. G., and Vickerman J. C., Surf. Interface Anal. , 715 (2002). 10.1002/sia.1438 [DOI] [Google Scholar]
- 28. Bobji M. S., Kumar S. V., Asthana A., and Govardhan R. N., Langmuir , 12120 (2009). 10.1021/la902679c [DOI] [PubMed] [Google Scholar]
- 29. Roach P., Farrar D., and Perry C. C., J. Am. Chem. Soc. , 8168 (2005). 10.1021/ja042898o [DOI] [PubMed] [Google Scholar]
- 30. Mammen L., Bley K., Papadopoulos P., Schellenberger F., Encinas N., Butt H. J., Weiss C. K., and Vollmer D., Soft Matter , 506 (2015). 10.1039/C4SM02216E [DOI] [PMC free article] [PubMed] [Google Scholar]
- 31. Steidle N. E., Hahn T., Bader C., Ahrens R., Rapp B. E., Guber A. E., and Lange K., Microfluid. Nanofluid. , 30 (2016) 10.1007/s10404-015-1696-8. [DOI] [Google Scholar]
- 32. Tsai W. B., Grunkemeier J. M., and Horbett T. A., J. Biomed. Mater. Res. , 130 (1999). [DOI] [PubMed] [Google Scholar]
- 33. Lhoest J. B., Wagner M. S., Tidwell C. D., and Castner D. G., J. Biomed. Mater. Res. , 432 (2001). [DOI] [PubMed] [Google Scholar]
- 34. Mantus D. S., Ratner B. D., Carlson B. A., and Moulder J. F., Anal. Chem. , 1431 (1993). 10.1021/ac00058a021 [DOI] [PubMed] [Google Scholar]
- 35.See supplementary material at http://dx.doi.org/10.1116/1.4959237E-BJIOBN-11-308603 for XP spectra of control experiments.
Associated Data
This section collects any data citations, data availability statements, or supplementary materials included in this article.
Data Citations
- See supplementary material at http://dx.doi.org/10.1116/1.4959237E-BJIOBN-11-308603 for XP spectra of control experiments.


