

Abstract
Poor aerobic fitness is linked to nonalcoholic fatty liver disease and increased all-cause mortality. We previously found that rats with a low capacity for running (LCR) that were fed an acute high-fat diet (HFD; 45% kcal from fat) for 3 days resulted in positive energy balance and increased hepatic steatosis compared with rats that were highly aerobically fit with a high capacity for running (HCR). Here, we tested the hypothesis that poor physiological outcomes in LCR rats following acute HFD feeding are associated with alterations in cecal microbiota. LCR rats exhibited greater body weight, feeding efficiency, 3 days of body weight change, and liver triglycerides after acute HFD feeding compared with HCR rats. Furthermore, compared with HCR rats, LCR rats exhibited reduced expression of intestinal tight junction proteins. Cecal bacterial 16S rDNA revealed that LCR rats had reduced cecal Proteobacteria compared with HCR rats. Microbiota of HCR rats consisted of greater relative abundance of Desulfovibrionaceae and unassigned genera within this family, suggesting increased reduction of endogenous mucins and proteins. Although feeding rats an acute HFD led to reduced Firmicutes in both strains, short-chain fatty acid-producing Phascolarctobacterium was reduced in LCR rats. In addition, Ruminococcae and Ruminococcus were negatively correlated with energy intake in the LCR/HFD rats. Predicted metagenomic function suggested that LCR rats had a greater capacity to metabolize carbohydrate and energy compared with HCR rats. Overall, these data suggest that the populations and metabolic capacity of the microbiota in low-aerobically fit LCR rats may contribute to their susceptibility to acute HFD-induced hepatic steatosis and poor physiologic outcomes.
Keywords: microbiota, short-chain fatty acids, aerobic fitness, NAFLD
a sedentary lifestyle and low aerobic fitness are strong independent risk factors for cardiovascular disease and all-cause mortality (28). Nonalcoholic fatty liver disease (NAFLD) is becoming more prevalent and is increasing concomitant with the rise in obesity (51). Progression of the disease begins with simple hepatic steatosis, which in some individuals, may progress to more severe liver diseases (i.e., inflammation, fibrosis, and cirrhosis). Several studies have shown that low aerobic fitness and physical inactivity are inversely related to the development and progression of NAFLD (10, 42, 44); however, the mechanisms explaining this link are poorly understood. We previously demonstrated that sedentary rats selectively bred for low-capacity running (LCR) fed an acute high-fat diet (HFD; 45% kcal from fat) for 3 days were more susceptible to development of hepatic steatosis compared with sedentary, high-aerobically fit, high-capacity running (HCR) rats, in part because of greater positive energy balance, higher energy intake, and reduced energy expenditure (38).
Recent interest has been directed at the contribution of the intestinal microbiota in the development and progression of NAFLD. In both animal models and humans, obesity is associated with significant changes at the bacterial taxonomic level, and lean mice receiving microbiota transplant from obese mice develop an obesity phenotype potentially through increased “energy harvest” (29, 30, 50). Specifically, the gut microbiota can influence host metabolism through gut signaling pathways that affect insulin resistance, lipid metabolism, ethanol production, and inflammation (26, 29). The mechanisms by which the microbiota induce obesity include increasing gut permeability that causes bacterial translocation and increased hepatic and systemic inflammation, production of short-chain fatty acids (SCFAs), and greater extraction of energy from the diet (26, 35).
Little is known about the effect of aerobic fitness on the microbiome and its potential role in disease development. Therefore, we used the HCR/LCR rat model system to determine 1) whether intrinsic aerobic fitness affects the cecal microbiota; and 2) whether acute changes in the microbiota following 3 days of HFD feeding are associated with development of hepatic steatosis. We hypothesized that HCR and LCR rats would demonstrate significant differences in microbiota populations at the phylum, family, and genus taxonomic levels, and that these changes would be associated with differences in NAFLD development and anthropometrics (i.e., energy intake, body mass) following a 3 days of HFD feeding.
METHODS
Animals and diets.
Animals and the experimental design were conducted according to those described by Morris et al. (38). Briefly, HCR/LCR rats were selectively bred and characterized according to previous methods (23, 38, 39, 49, 53). All animals (n = 7–8 per group) were singly housed at 25–30 wk of age and acclimatized to a low-fat control diet (CON; 10% kcal fat, 3.5% kcal sucrose, D12110704; Research Diets, New Brunswick, NJ) for ≥7 days before starting a 3-day HFD (45% kcal fat, 17% sucrose, D12451; Research Diets). Food intake and body weight were monitored daily at ≥3 days before and during the 3-day HFD. Energy intake was calculated by multiplying the gross energy value of the experimental diets (CON, 3.85 kcal/g; HFD, 4.73 kcal/g) by grams of food intake. Feeding efficiency over the 3-day HFD period was calculated by dividing 3 days of weight gain (milligrams) by energy intake (kilocalories). The animal protocols were approved by the Institutional Animal Care and Use Committees at the University of Missouri and the Subcommittee for Animal Safety at the Harry S Truman Memorial Veterans Affairs Hospital.
Cecal content DNA extraction and sequencing.
Cecal contents were collected from all rats at study end, snap-frozen in liquid nitrogen, and stored at −80°C until DNA extraction. Bacterial DNA was isolated from cecal contents using a QIAamp Fast DNA stool mini kit (Qiagen, Valencia, CA), including a bead-beating step. Genomic DNA was used for amplification of the V4 variable region of the 16S rRNA gene using 515F/806R primers. Primers were dual-indexed as described by Kozich et al. (24) to accommodate multiplexing 384 samples per run. Paired-end sequencing (2 × 250 bp) was carried out using an Illumina Miseq platform. Processing and quality filtering of reads was performed by using scripts in QIIME (version 1.9.1) (5, 7) and other scripts. Paired reads were stitched with PEAR, an overlapping paired-end-reads merger algorithm that evaluates all possible overlaps, thereby minimizing false positive hits (54). Reads were further filtered on the basis of Phred quality scores (Q >19) and for chimeric reads using USEARCH61 (7, 15). Filtered reads were demultiplexed within QIIME and samples with less than 5,000 reads were excluded from further analysis. UCLUST was used to cluster sequences into operational taxonomical units (OTUs) based on 97% identity (15). OTU picking was performed using an open-reference method, which encompasses clustering of reads against a reference sequence collection and also performs de novo OTU picking on the reads that fail to align to any known reference sequence in the database (46). To eliminate erroneous mislabeling, the resulting OTU tables were checked for mislabeling sequences (22). Representative sequences were further aligned using PyNAST with the Greengenes core-set alignment template (34). Construction of the phylogenetic tree was performed using the FASTTREE method in QIIME (43). Alpha rarefaction was performed using the phylogenetic diversity, Chao1 and observed species metrics. Beta diversity estimation was carried out by computing weighted and unweighted UniFrac distances between samples using QIIME (32). All samples were clustered on the basis of their between-sample distances using UPGMA, and subsequent jackknifing was performed by resampling of methods. Comparisons of intergroup and intragroup diversity were performed using ANOVA, including correction for multiple comparisons.
Functional metagenomic annotations on the basis of 16S rRNA data were predicted using phylogenetic investigation of communities by reconstruction of unobserved states (PICRUST) (25). Briefly, a closed-reference OTU table was generated from the original sequence files in QIIME (7). The closed-reference OTU table was normalized to 16S rDNA copy, and function was categorized in reference to Kyoto Encyclopedia of Genes and Genomes (KEGG) pathways in PICRUST. The resulting biom file was then analyzed with STAMP (41) version 2.0.8. A Welch's t-test was used to analyze pairwise comparisons for LCR/CON vs. LCR/HFD, LCR/CON vs. LCR/HFD, and HCR/CON vs. HCR/HFD treatments.
Real-time quantitative PCR.
RNA was isolated from the frozen livers and ileums of HCR and LCR rats via a commercially available kit (74104; RNeasy Mini Kit, Qiagen). RNA purity was determined using a Nanodrop spectrophotometer (Nanodrop 2000c; Thermo Scientific, Waltham, MA), and cDNA was synthesized via reverse transcriptase (Promega, Madison, WI). Real-time quantitative PCR was performed with the ABI 7500 Fast Sequence Detection System (Applied Biosystems, Carlsbad, CA) using Fast SYBR Green Master Mix (Applied Biosystems). Primer pairs were obtained from Sigma (St. Louis, MO); sequences are as follows: glucuronidase beta (GUSB) (forward, GAT TCA GAT ATC CGA GGG AG; reverse, CGA TGA CCA CAA TTC CAT ATC); cyclophilin B (PPIB) (forward, CTT AGC TAC AGG AGA GAA AGG; reverse, TTC AGC TTG AAG TTC TCA TC); zonula occludens-1 (ZO-1) (forward, CAC TCT TCC AGA ACC AAA AC; reverse, ACC CAC ACT ATC TCC TTT TC); ZO-2 (forward, CTG AGA ACA TGT CTT TAA CCG; reverse, ATT TCC GAG ATA TCC TCC AC); free fatty acid receptor 2 (FFAR2) (forward, AAA TCA CCT GCT ATG AGA AC; reverse, AAG ATG GTG ACT GTC ATG G); Toll-like receptor-4 (TLR-4) (forward, TCC ACA AGA GCC GGA AAG TT; reverse, TGA AGA TGA TGC CAG AGC GG); IL-1β (forward, CCT ATG TCT TGC CCG TGG AG; reverse, CAC ACA CTA GCA GGT CGT CA); and sterol regulatory element-binding transcription factor (SREBF1) (forward, TTT CGT TAA CGT GGG TCT CC; reverse, CAG CAT TAG GGG GCA TCA AAT). Dissociation melt curves were analyzed to verify primer specificity. Liver and small intestinal mRNA expression of PPIB and GUSB were used to calculate the expression levels of genes of interest using the 2−ΔΔCT method, respectively. All data are normalized to expression levels of LCR/CON treatment.
Western blot and serum analyses.
Western blot and densitometry analyses (Image Lab Beta 3; Bio-Rad Laboratories) were performed in whole liver homogenates for cytochrome-c oxygenase 4 subunit 1 (COX4 subunit 1; AbCam, Cambridge, MA), CD36/fatty acid translocase (CD36; Santa Cruz Biotechnology, Dallas, TX) peroxisome proliferator-activated receptor-α (PPARα; Santa Cruz Biotechnology), acetyl-coenzyme A carboxylase (ACC; Cell Signaling, Beverly, MA), ACC Ser79 phosphorylation-specific (P-ACC; Cell Signaling), fatty acid synthase (FAS; Cell Signaling), and peroxisome proliferator-activated receptor-gamma coactivator-1α (PGC-1α; Calbiochem, San Diego, CA). Amido black stain (0.1%; Sigma) was used to quantify total protein to account for any variation in protein loading and transfer.
Serum glucose (Sigma), acetate (Sigma), triglyceride (TG) (Sigma), nonesterified free fatty acids (NEFA; Wako Chemicals, Richmond, VA), and insulin (Linco Research, St. Charles, MO) were measured with commercially available kits according to manufacturer's instructions.
Triglyceride analysis.
Liver TG content was determined as previously described (45, 47). Briefly, powdered liver (∼30 mg) was added to 1 ml of lipid extraction solution composed of 1:2 vol/vol methanol-chloroform, homogenized for 30 s, and exposed to gentle agitation overnight at 4°C. One milliliter of 4 mM MgCl was added, vortexed, and centrifuged for 1 h at 1,000 g at 4°C. The organic phase was removed, evaporated, and reconstituted in butanol-Triton X-114 mix (3:2 vol/vol) and vortexed. Lipid content was measured from a commercially available kit (F6428; Sigma), and TG concentration was expressed as nanomole per gram of liver.
Statistical analysis.
All data were analyzed as a two-way ANOVA using the MIXED procedure of SAS (SAS Institute, Cary, NC). Significant interactions were followed up with a Tukey's post hoc adjustment. Post hoc Pearson's correlations were analyzed using GraphPad Prism 6 software (La Jolla, CA). Significant differences between diet and strain were set at P ≤ 0.05.
RESULTS
Animal and serum characteristics.
Over the 3 days of acute HFD feeding period, both LCR and HCR rats exhibited increased energy intake (P < 0.05) (Fig. 1A). Despite having no differences in 3 days of energy intake compared with HCR rats, the LCR rats exhibited a robust increase (P < 0.05) in 3 days of body weight gain (Fig. 1B) and feeding efficiency (Fig. 1C) in response to an acute HFD, whereas HCR rats were protected against 3 days of HFD-induced weight gain. LCR rats had greater (P < 0.05) final body weights compared with HCR rats, but the acute HFD feeding elicited no significant difference in final body weights of LCR or HCR rats compared with their control diet comparisons (Fig. 1D). Retroperitoneal, epididymal, and mesentric fat pad masses were significantly greater in LCR than HCR rats (P < 0.05, Table 1). Serum glucose, insulin, and NEFA concentrations did not differ among strains or diets (Table 1). However, serum acetate concentrations were higher (P < 0.05) in LCR compared with HCR rats (Table 1).
Fig. 1.

Three-day (d) energy intake (A), 3-day body weight (BW) change (B), feeding efficiency (3-day weight gain/energy intake) (C), and final BW (D) in rats with low capacity for running (LCR) and high capacity for running (HCR) in response to being fed an acute, high-fat diet (HFD). Values are expressed as means ± SE. *Significant (P < 0.05) diet effect. †Significant (P < 0.05) strain effect. Means with different letters denote significant (P < 0.05) differences between treatments.
Table 1.
Serum glucose, insulin, nonesterified fatty acid, acetate concentrations, and fat pad weights of LCR and HCR rats fed CON or HFD for 3 days
| LCR |
HCR |
P |
|||||
|---|---|---|---|---|---|---|---|
| Outcome | CON | HFD | CON | HFD | Diet | Strain | Diet × Strain |
| Serum characteristics | |||||||
| Glucose, mg/dl | 180.4 ± 9.94 | 189.4 ± 16.1 | 174.1 ± 8.05 | 191.1 ± 8.69 | 0.2669 | 0.8419 | 0.7373 |
| Insulin, ng/ml | 7.50 ± 2.00 | 7.74 ± 1.33 | 8.80 ± 1.29 | 8.57 ± 1.15 | 0.7613 | 0.0910 | 0.8980 |
| NEFA, μM/ml | 609.4 ± 40.1 | 734.0 ± 45.5 | 694.9 ± 55.6 | 705.1 ± 22.3 | 0.1516 | 0.5394 | 0.2212 |
| Acetate, ng/μl | 141.6 ± 15.9 | 170.6 ± 19.7 | 102.0 ± 21.1 | 101.8 ± 38.3 | 0.4598 | 0.0092 | 0.4534 |
| Fat pad weights | |||||||
| Mesenteric, mg | 4.65 ± 0.51 | 4.88 ± 0.62 | 3.00 ± 0.25 | 3.42 ± 0.31 | 0.9452 | 0.0296 | 0.8692 |
| Epididymal, mg | 9.32 ± 1.29 | 9.62 ± 1.41 | 6.04 ± 0.63 | 7.21 ± 0.54 | 0.8203 | 0.0122 | 0.6734 |
| Retroperitoneal, mg | 12.1 ± 0.90 | 11.5 ± 1.38 | 6.58 ± 0.72 | 7.72 ± 0.58 | 0.8307 | 0.0037 | 0.5115 |
| Omental, mg | 1.94 ± 0.23 | 1.84 ± 0.30 | 1.82 ± 0.18 | 2.46 ± 0.32 | 0.9011 | 0.5237 | 0.5111 |
Values are means ± SE. CON, control diet; HCR, high-capacity running; HFD, high-fat diet; LCR, low-capacity running; NEFA, nonesterified fatty acid. Bolded P value denotes a significant main effect (P < 0.05).
Hepatic TGs and markers of inflammation.
In response to HFD feeding, LCR rats had increased (P < 0.05) hepatic TGs, whereas HCR rats were protected against 3 days of HFD-induced hepatic steatosis (Fig. 2A). However, both HCR and LCR rats showed no significant changes in hepatic TLR-4 and IL-1β mRNA expression in response to acute HFD feeding (Fig. 2, B and C). In addition, we assessed SCFA receptor FFAR2 and found that hepatic mRNA expression did not differ among groups or dietary interventions (Fig. 2D).
Fig. 2.

Liver triglycerides (TGs) (A), gene expression of IL-1β (B), Toll-like receptor-4 (TLR-4) (C), and free fatty acid receptor 2 (FFAR2) (D) in LCR and HCR rats in response to an acute HFD. Values are expressed as means ± SE. Means with different letters denote significant (P < 0.05) differences between treatments.
Pathways influencing hepatic TG accumulation.
To examine potential pathways known to influence hepatic TG accumulation, we examined hepatic markers of de novo lipogenesis (Fig. 3, A–E), fatty acid transport (Fig. 3F), and hepatic mitochondrial content and biogenesis (Fig. 3, G–I). Assessment of markers of hepatic de novo lipogenesis, SREBF1 mRNA expression, and protein content for ACC, phospho-ACC, and FAS did not differ between LCR and HCR rats; however, as expected, 3 days of HFD feeding resulted in significantly suppressed SREBF1 mRNA expression and ACC, phospho-ACC, and FAS protein content in both groups (Fig. 3, A–E). No differences were observed in the fatty acid transport protein CD36 (Fig. 3F). However, although the mitochondrial markers PPARα and COX4-subunit 1 did not differ among groups or dietary treatments, PGC-1α protein content was dramatically reduced in both LCR and HCR rats following 3 days of HFD feeding (Fig. 3, G–I).
Fig. 3.

Markers of de novo lipogenesis, fatty acid transport, and mitochondrial biogenesis and content in LCR and HCR rats fed an acute HFD. Hepatic mRNA expression of sterol regulatory element-binding transcription factor 1 (SREBF1) (A), hepatic protein content of acetyl-coenzyme A carboxylase (ACC) (B), ACC Ser79 phosphorylation-specific (P-ACC) (C), ACC:P-ACC (D), fatty acid synthase (FAS) (E), CD36/fatty acid translocase (CD36) (F), peroxisome proliferator-activated receptor-α (PPARα) (G), peroxisome proliferator-activated receptor-gamma coactivator-1α (PGC-1α) (H), and cytochrome-c oxygenase 4 subunit 1 (COX4 subunit 1) (I) in LCR and HCR rats in response to an acute HFD. J: representative Western blots. Values are expressed as means ± SE. *Significant (P < 0.05) diet effect.
Microbiota analysis.
Microbial diversity and species richness were similar among all treatment groups as indicated by Chao1 and rarefaction curves (data not shown). Figure 4 displays the unweighted Unifrac distances as a principal coordinates analysis (PCoA) plot. LCR rats were more similar to each other than to HCR rats (P < 0.05 as measured by two-sample Monte Carlo t-test), whereas HFD feeding elicited no significant changes within each group. Weighted Unifrac distances revealed no significant clustering between strains or in response to HFD feeding (data not shown).
Fig. 4.
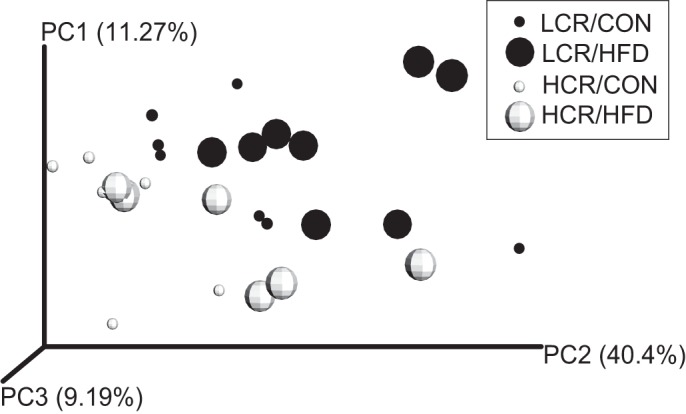
Beta diversity of cecal microbiota populations in LCR and HCR rats by plotted unweighted Unifrac distances as a principal coordinates analysis (PCoA) plot. Cecal microbiota of LCR rats are more similar to each other than to HCR rats (P < 0.05). LCR/Control (CON) (small dark circles), LCR/HFD (large dark circles), HCR/CON (small open circles), and HCR/HFD (large open circles).
Taxonomic classification of raw sequences by Ribosomal Database Project classifier were assigned to 8 phyla, 28 families, and 38 genera. Approximately 99% of all sequences were assigned to the phyla of Bacteroidetes, Firmicutes, and Proteobacteria, whereas the remaining sequences were assigned to Cyanobacteria, Deferribecteres, Elusimicrobia, Spirochaetes, and Tenericutes. The most abundant phyla were Bacteroidetes (54.4% of total sequences), Firmicutes (23.3% of total sequences), and Proteobacteria (20.6% of total sequences) in the LCR/CON (Fig. 5A), LCR/HFD (Fig. 5B), HCR/CON (Fig. 5C), and HCR/HFD (Fig. 5D). At the phylum level, HCR rats exhibited greater (P ≤ 0.05) cecal relative abundances of Cyanobacteria and Proteobacteria compared with LCR rats (Table 2). HFD feeding elicited a decrease (P ≤ 0.05) in the relative abundance of Firmicutes compared with rats on the low-fat control diet. Bacteroidetes and the Bacteroidetes:Firmicutes ratio relative abundances revealed no significant differences among all groups.
Fig. 5.

Cecal phylum distribution for the LCR/CON (A), LCR/HFD (B), HCR/CON (C), and HCR/HFD (D) treatments. *Significant (P < 0.05) diet effect. †Significant (P < 0.05) strain effect.
Table 2.
Relative abundances of bacterial phyla, families, and genera in cecal contents of HCR and LCR rats fed CON or HFD for 3 days
| LCR |
HCR |
P |
|||||
|---|---|---|---|---|---|---|---|
| Taxonomy | CON | HFD | CON | HFD | Diet | Strain | Diet × Strain |
| Bacteroidetes* | 54.1 ± 4.39 | 59.6 ± 2.40 | 50.2 ± 1.49 | 53.5 ± 2.52 | 0.151 | 0.106 | 0.720 |
| Unassigned† | 0.11 ± 0.05 | 0.05 ± 0.02 | 1.02 ± 0.10 | 0.22 ± 0.04 | 0.142 | 0.002 | 0.720 |
| Odoribacteraceae | 0.54 ± 0.25 | 0.81 ± 0.10 | 0.55 ± 0.11 | 0.64 ± 0.25 | 0.629 | 0.286 | 0.599 |
| Paraprevotellaceae | 23.0 ± 3.09 | 24.8 ± 3.02 | 25.9 ± 2.46 | 21.7 ± 3.71 | 0.717 | 0.973 | 0.357 |
| Prevotella‡ | 3.81 ± 2.27 | 2.70 ± 1.23 | 0.83 ± 0.42 | 2.24 ± 0.73 | 0.917 | 0.234 | 0.379 |
| CF231 | 19.1 ± 4.67 | 22.0 ± 3.88 | 24.9 ± 2.73 | 19.3 ± 4.29 | 0.745 | 0.706 | 0.307 |
| Paraprevotella | 0.10 ± 0.04 | 0.13 ± 0.03 | 0.13 ± 0.02 | 0.21 ± 0.03 | 0.098 | 0.057 | 0.372 |
| Bacteroidaceae | 20.3 ± 4.75 | 25.4 ± 2.67 | 15.8 ± 1.88 | 23.9 ± 4.21 | 0.082 | 0.420 | 0.677 |
| Porphyromonadaceae | 0.71 ± 0.27 | 1.54 ± 0.12 | 0.35 ± 0.07 | 1.27 ± 0.40 | 0.002 | 0.227 | 0.848 |
| Prevotellaceae | 4.00 ± 1.01 | 3.46 ± 0.62 | 4.00 ± 0.60 | 1.90 ± 0.60 | 0.086 | 0.300 | 0.300 |
| Rikenellaceae | 0.41 ± 0.10 | 0.48 ± 0.09 | 0.58 ± 0.21 | 0.49 ± 0.12 | 0.888 | 0.495 | 0.548 |
| S24-7 | 4.97 ± 0.66 | 3.10 ± 0.28 | 2.75 ± 0.55 | 3.44 ± 0.42 | 0.234 | 0.064 | 0.014 |
| Cyanobacteria | 0.11 ± 0.04 | 0.24 ± 0.20 | 1.30 ± 0.44 | 0.39 ± 0.30 | 0.153 | 0.020 | 0.065 |
| Deferribecteres | 0.19 ± 0.11 | 0.05 ± 0.03 | 0.15 ± 0.11 | 0.13 ± 0.07 | 0.348 | 0.796 | 0.493 |
| Firmicutes | 29.0 ± 4.42 | 20.4 ± 2.90 | 23.7 ± 1.09 | 20.0 ± 1.83 | 0.051 | 0.346 | 0.414 |
| Unassigned Clostridia | 5.81 ± 1.35 | 3.33 ± 0.69 | 7.68 ± 0.91 | 5.34 ± 1.48 | 0.047 | 0.104 | 0.949 |
| Mogibacteriaceae | 0.04 ± 0.02 | 0.09 ± 0.02 | 0.00 ± 0.02 | 0.01 ± 0.01 | 0.117 | 0.004 | 0.410 |
| Christensenellaceae | 0.10 ± 0.02 | 0.09 ± 0.02 | 0.07 ± 0.02 | 0.01 ± 0.01 | 0.129 | 0.016 | 0.343 |
| Clostridiaceae | 0.10 ± 0.04 | 0.26 ± 0.13 | 0.02 ± 0.02 | 0.10 ± 0.04 | 0.135 | 0.135 | 0.623 |
| Erysipelotrichaceae | 0.29 ± 0.12 | 0.50 ± 0.18 | 0.07 ± 0.03 | 0.53 ± 0.34 | 0.122 | 0.655 | 0.562 |
| Eubacterium | 0.10 ± 0.08 | 0.33 ± 0.15 | 0.00 ± 0.00 | 0.19 ± 0.19 | 0.143 | 0.387 | 0.886 |
| Allobaculum | 0.10 ± 0.03 | 0.11 ± 0.04 | 0.05 ± 0.03 | 0.26 ± 0.13 | 0.149 | 0.526 | 0.199 |
| Coprobacillus | 0.01 ± 0.01 | 0.04 ± 0.02 | 0.02 ± 0.02 | 0.00 ± 0.00 | 0.825 | 0.242 | 0.186 |
| Unassigned | 0.06 ± 0.04 | 0.00 ± 0.00 | 0.00 ± 0.00 | 0.03 ± 0.02 | 0.548 | 0.548 | 0.080 |
| Lachnospiraceae | 2.91 ± 0.63 | 3.60 ± 0.73 | 3.70 ± 0.95 | 4.73 ± 1.04 | 0.321 | 0.269 | 0.841 |
| Ruminococcus | 0.17 ± 0.17 | 0.15 ± 0.08 | 0.03 ± 0.02 | 0.10 ± 0.05 | 0.826 | 0.365 | 0.670 |
| Blautia | 1.23 ± 0.38 | 1.89 ± 0.43 | 0.53 ± 0.11 | 2.23 ± 0.68 | 0.019 | 0.708 | 0.279 |
| Coprococcus | 0.34 ± 0.15 | 0.11 ± 0.02 | 0.67 ± 0.27 | 0.56 ± 0.14 | 0.286 | 0.021 | 0.702 |
| Dorea | 0.21 ± 0.14 | 0.64 ± 0.22 | 0.07 ± 0.02 | 0.10 ± 0.02 | 0.134 | 0.029 | 0.198 |
| Roseburia | 0.21 ± 0.08 | 0.23 ± 0.12 | 0.60 ± 0.34 | 0.67 ± 0.30 | 0.856 | 0.076 | 0.894 |
| Unassigned | 0.73 ± 0.22 | 0.60 ± 0.07 | 1.78 ± 0.86 | 1.04 ± 0.21 | 0.286 | 0.072 | 0.450 |
| Peptococcaceae | 0.66 ± 0.26 | 0.78 ± 0.23 | 0.35 ± 0.10 | 0.94 ± 0.25 | 0.134 | 0.764 | 0.311 |
| rc4-4 | 0.66 ± 0.26 | 0.78 ± 0.23 | 0.33 ± 0.10 | 0.94 ± 0.25 | 0.125 | 0.736 | 0.293 |
| Unassigned | 0.00 ± 0.00 | 0.00 ± 0.00 | 0.02 ± 0.02 | 0.00 ± 0.00 | 0.251 | 0.251 | 0.251 |
| Peptostreptococcaceae | 0.03 ± 0.03 | 0.04 ± 0.03 | 0.00 ± 0.00 | 0.10 ± 0.04 | 0.085 | 0.581 | 0.146 |
| Ruminococcaceae | 17.6 ± 3.73 | 11.0 ± 2.74 | 11.2 ± 1.14 | 7.61 ± 1.46 | 0.062 | 0.073 | 0.575 |
| Oscillospira | 1.84 ± 0.49 | 0.96 ± 0.14 | 1.63 ± 0.28 | 1.40 ± 0.36 | 0.113 | 0.739 | 0.349 |
| Ruminococcus | 10.4 ± 3.10 | 4.49 ± 1.67 | 5.08 ± 0.64 | 2.30 ± 0.83 | 0.031 | 0.060 | 0.420 |
| Unassigned | 5.36 ± 1.43 | 5.56 ± 1.13 | 4.53 ± 0.93 | 3.93 ± 0.65 | 0.857 | 0.275 | 0.716 |
| Veillonellaceae | 1.33 ± 0.39 | 0.69 ± 0.11 | 0.53 ± 0.08 | 0.67 ± 0.11 | 0.254 | 0.072 | 0.083 |
| Phascolarctobacterium | 1.29 ± 0.38 | 0.69 ± 0.11 | 0.37 ± 0.09 | 0.64 ± 0.11 | 0.453 | 0.032 | 0.049 |
| Unassigned | 0.03 ± 0.02 | 0.00 ± 0.00 | 0.17 ± 0.13 | 0.01 ± 0.01 | 0.118 | 0.184 | 0.278 |
| Proteobacteria | 15.3 ± 3.04 | 18.2 ± 2.14 | 23.7 ± 2.26 | 25.3 ± 1.89 | 0.345 | 0.004 | 0.796 |
| Unassigned | 0.10 ± 0.05 | 0.14 ± 0.03 | 0.12 ± 0.03 | 0.26 ± 0.12 | 0.224 | 0.348 | 0.477 |
| Alcaligenaceae | 0.17 ± 0.06 | 0.28 ± 0.08 | 0.03 ± 0.02 | 0.10 ± 0.04 | 0.149 | 0.011 | 0.750 |
| Desulfovibrionaceae | 9.31 ± 3.14 | 7.26 ± 0.71 | 12.9 ± 1.06 | 12.1 ± 1.95 | 0.473 | 0.042 | 0.752 |
| Desulfovibrio | 0.39 ± 0.21 | 0.05 ± 0.03 | 0.08 ± 0.04 | 0.13 ± 0.06 | 0.216 | 0.337 | 0.109 |
| Unassigned | 8.93 ± 2.99 | 7.20 ± 0.73 | 12.8 ± 1.06 | 12.0 ± 1.91 | 0.507 | 0.031 | 0.811 |
| Enterobacteriaceae | 0.00 ± 0.00 | 0.03 ± 0.02 | 0.00 ± 0.00 | 0.06 ± 0.04 | 0.060 | 0.448 | 0.448 |
| Helicobacteraceae | 5.67 ± 1.60 | 10.5 ± 2.18 | 10.6 ± 1.95 | 12.8 ± 2.37 | 0.104 | 0.098 | 0.529 |
| Flexispira | 0.00 ± 0.00 | 0.00 ± 0.00 | 0.10 ± 0.10 | 0.09 ± 0.09 | 0.907 | 0.138 | 0.907 |
| Unassigned | 5.67 ± 1.60 | 10.5 ± 2.18 | 10.5 ± 2.05 | 12.7 ± 2.44 | 0.109 | 0.112 | 0.538 |
| Spirochaetes | 1.17 ± 0.42 | 1.43 ± 0.57 | 0.85 ± 0.49 | 0.47 ± 0.22 | 0.893 | 0.178 | 0.498 |
Relative abundances of bacterial
phyla, †families, and ‡genera (n = 6–8 per group). Values are means ± SE. Bolded P value denotes a significant main effect (P < 0.05).
Several changes at the family and genus taxonomic levels were noticed. Cecal relative abundance of unassigned families within the Bacteroidetes phylum was greater (P < 0.05) in HCR rats compared with LCR rats. In both HCR and LCR rats, the cecal relative abundance of Porphyromonadaceae, and specifically Parabacteroides, increased in response to acute HFD feeding. In HCR rats, the relative abundance of the family S-247 increased (P < 0.05) in response to acute HFD, whereas LCR rats exhibited a decrease (P < 0.05). Within Firmicutes, cecal relative abundances of unassigned Clostridia and Ruminococcus were decreased (P < 0.05) in response to acute HFD in both HCR and LCR rats, whereas cecal relative abundance of Blautia increased (P < 0.05). Cecal relative abundances of Mogibacteriaceae, Christensenellaceae, and Dorea were greater (P < 0.05) in LCR rats compared with HCR rats. Conversely, cecal relative abundance of Coprococcus was greater (P < 0.05) in HCR rats compared with LCR rats. In HCR rats, acute HFD feeding elicited an increase (P < 0.05) in relative abundance of Phascolarctobacterium, whereas LCR rats exhibited a decrease (P < 0.05). Members of the Proteobacteria phylum, including Alicaligenaceae, and specifically Sutterella, were greater (P < 0.05) in relative abundance in LCR rats compared with HCR rats. Cecal relative abundance of unassigned Desulfovibrionaceae were greater (P < 0.05) in HCR rats compared with LCR rats.
Intestinal gene expression.
Small intestinal gene expression revealed that HCR rats have greater (P < 0.05) expression of ZO-1 and ZO-2 compared with LCR rats (Fig. 6, A and B). No significant differences were noted in intestinal mRNA expression of TLR-4 and IL-1β (Fig. 6, C and D). Expression of FFAR2 (Fig. 6E) was greater (P < 0.05) in LCR compared with HCR rats and in those fed the HFD compared with those fed the low-fat control diet.
Fig. 6.

Small intestinal gene expression of zonula occludens-1 (ZO-1) (A) and ZO-2 (B), TLR-4 (C), IL-1β (D), and free fatty acid receptor 2 (FFAR2) (E) in LCR and HCR rats in response to an acute HFD. Values are presented as means ± SE. Means with different letters denote significant (P < 0.05) differences between treatments.
Pearson's correlations.
No significant correlation was exhibited between energy intake and the Bacteroidetes:Firmicutes relative abundance ratio (Fig. 7A, r = 0.25, P = 0.20). A positive correlation was exhibited between 3-day body weight change and the Bacteroidetes:Firmicutes relative abundance ratio in all rats (Fig. 7B, r = 0.39, P < 0.05). Significant negative correlations were exhibited between energy intake and Ruminococcaceae (Fig. 7C, r = −0.58, P < 0.01), 3-day body weight change and Ruminococcaceae (Fig. 7D, r = −0.40, P < 0.05), energy intake and Ruminococcus (Fig. 7E, r = −0.59, P < 0.01), and 3-day body weight change and Ruminococcus (Fig. 7F, r = −0.44, P < 0.05). A significant positive correlation was exhibited between liver TGs and the Bacteroidetes:Firmicutes relative abundance ratio (Fig. 7G, r = 0.44, P < 0.05). In the LCR/HFD treatment group, a positive correlation was exhibited between energy intake and the Bacteroidetes:Firmicutes relative abundance ratio (Fig. 8A, r = 0.84, P < 0.01) and the 3-day body weight change and the Bacteroidetes:Firmicutes relative abundance ratio (Fig. 7B, r = 0.92, P < 0.01). A negative correlation was exhibited between energy intake and the relative abundance of Ruminococcaceae (Fig. 8C, r = −0.75, P < 0.05), 3-day body weight change and the relative abundance of Ruminococcaceae (Fig. 8D, r = −0.75, P < 0.05), and energy intake and the relative abundance of Ruminococcus (Fig. 8E, r = −0.73, P < 0.05). No significant correlation was observed between 3-day body weight change and the relative abundance of Ruminococcus (Fig. 8E, r = −0.20, P = 0.64). In the HCR/HFD treatment group, no significant correlations were observed with these same outcomes (Fig. 8, A–E). Other correlational analyses between microbiota and hepatic markers of inflammation (IL-1β and TLR-4) and de novo lipogenesis (SREBF1, ACC, P-ACC, ACC:P-ACC, FAS) were evaluated but no significant relationships were observed (data not shown).
Fig. 7.

Pearson's correlations in all rats between the Bacteroidetes to Firmicutes ratio and energy intake (A) and 3-day BW change (B); Ruminococcaceae and energy intake (C) and 3-day BW change (D); Ruminococcus and energy intake (E) and 3-day BW change (F); and the Bacteroidetes to Firmicutes ratio and liver TGs (G). Open circles, LCR/CON; closed circles, LCR/HFD, open squares, HCR/LFD; closed squares, HCR/HFD.
Fig. 8.

Pearson's correlations only in LCR/HFD between the Bacteroidetes to Firmicutes ratio and energy intake (A), the Bacteroidetes to Firmicutes ratio and 3-day BW change (B), Ruminococcaceae and energy intake (C), Ruminococcaceae and 3-day BW change (D), Ruminococcus and energy intake (E), and Ruminococcus and 3-day BW change (F). Closed circles, LCR/HFD; closed squares, HCR/HFD.
Predicted metagenomic function of microbiota.
Analysis of the predicted metagenome was carried out post hoc to support changes observed in microbiota relative abundances (Fig. 9, A and B). Microbiota of the LCR/CON treatment had greater (P < 0.05) suggested metabolic capacity for energy metabolism and functions involving carbohydrate metabolism (i.e., methane, starch and sucrose, fructose and mannose, and glycolysis and gluconeogenesis) compared with HCR/CON rats (Fig. 9A). When provided with an acute HFD, the metagenomic potential of the microbiota in LCR rats showed significant (P < 0.05) decreases in carbohydrate and starch and sucrose metabolism (Fig. 9B), effects that were not found in the HCR animals (data not shown).
Fig. 9.

Pairwise comparisons by Welch's t-test of predicted metagenomic differences of microbiota between LCR/CON and HCR/CON (A), and LCR/CON and LCR/HFD (B). Values are presented as means ± SE. *Denotes a significant (P < 0.05) difference between treatment groups.
DISCUSSION
The prevalence of NAFLD is increasing and is strongly attributed to decreases in aerobic fitness; however, the mechanisms by which fitness affects energy metabolism and susceptibility to developing fatty liver is not well understood. Previous results from our laboratory indicate that low-aerobically fit rats (LCRs) fed an acute HFD had elevated energy intake, reduced energy expenditure, and susceptibility to hepatic steatosis development compared with high-aerobically fit rats (HCRs) (38). Very little is known about the interactions between aerobic fitness and microbiota populations in contributing to the development of NAFLD. Therefore, the objective of this study was to determine whether the previous physiologic outcomes may be explained in part by changes in microbiota communities. Our results indicate that acute HFD feeding affects cecal microbiota communities in LCR rats, in particular by decreasing SCFA-producing families and genera that are associated with increased energy intake, decreased predicted energy and carbohydrate metabolism by the microbiota, and increased body weight gain and hepatic TG accumulation.
Both HCR and LCR rats had increased energy intake during acute HFD feeding; however, only the LCR rats exhibited a robust increase in body weight, feeding efficiency (weight gain/energy intake), and hepatic lipid content compared with HCR rats during HFD feeding. Previous evidence indicates that increased HFD feeding affects hepatic and whole body fatty acid oxidation and leads to an increased propensity to store calories as adipose tissue, and ultimately, altered hepatic afferent signals to increase food intake (18, 19, 24a, 38). Our previous study confirmed that this concept is shown in the HCR/LCR phenotype, where LCR rats had greater energy intake, 3-day weight gain, adiposity, and energy balance compared with HCR rats (38) when fed an acute HFD. In LCR rats, this was interpreted as increased fatty acid trafficking to adipose tissue and reduced hepatic and whole body fatty acid oxidation causing acute increases in energy intake and positive energy balance, which exacerbates hepatic steatosis. Although we did not observe differences in energy intake between LCR and HCR rats, the robust increase in feeding efficiency and body weight gain during HFD feeding exhibited in LCR rats supports this interpretation.
In the present study we found no differences in measures of hepatic de novo lipogenesis or mitochondrial biogenesis/content in LCR vs. HCR rats on a semipurified, low-fat control diet. This is in contrast to our previous work in feeding LCR and HCR rats standard rodent chow (49). Perhaps the differences relate to different outcome measures being assessed or may be due to different dietary feeding conditions. Regardless, collectively, our findings highlight the potential role of changes in the gut microbiota in hepatic TG accumulation witnessed in LCR rats.
It has been hypothesized that exercise increases the diversity of gut microbiota, which modulates metabolic products that affect mucosal immunity and defense to pathogens (3). Several studies using both humans and rodent models have shown that exercise influences both cecal and fecal species richness and modulates bacterial phyla genera that are strongly associated with gastrointestinal immune function and leanness (1, 11, 36); however, the mechanisms are not fully understood. Our unweighted PCoA plot indicates that differing levels of intrinsic aerobic fitness results in changes in cecal beta-diversity, which is consistent with previous studies in ovarectomized and exercised HCR and LCR rats (13, 31). Specific OTU abundances of Proteobacteria, and in particular the sulfur reducing family Desulfovibrionaceae and unassigned genera within that family, were increased in HCR rats compared with LCR rats. Increases in these families within Proteobacteria were also noticed in ovarectomized HCR rats, whereas LCR rats showed decreases (31).
Increases in Proteobacteria are positively correlated with progression of NAFLD and nonalcoholic steatohepatitis (NASH) (14a, 56). However, these changes are most often linked to increases in Escherichia coli, which are involved in alcohol production, which increases gut permeability, inflammation, and the progression from NAFLD to NASH (26, 56). Our small intestinal gene expression outcomes revealed that HCR rats likely had less gut permeability and inflammation compared with LCR rats, which is consistent with LCR rats having a higher propensity to develop a fatty liver phenotype. This is not consistent with HCR rats having increased Proteobacteria, which is often associated with increased gut inflammation (9, 33). Here, LCR rats had an increased relative abundance of the family Alicaligenaceae and genus Sutterella, which may be related to the progression of NAFLD. Patients with cirrhosis and hepatic encephalitis have low fecal concentrations of Alicaligenaceae, which has been positively associated with cognitive decline in these patients (2, 40). Alicaligenaceae are known to degrade urea to ammonia, which could cause cognitive impairment; however, the involvement of this family in NAFLD is not fully understood (2, 20, 40). Overall, we posit that increases in Proteobacteria in HCR rats are caused by an increase in endogenous nitrogen and sulfur-containing substrates (i.e., mucins and sloughed epithelial cells) reaching the cecum. These findings warrant future investigation.
Both HCR and LCR rats had decreased Firmicutes and no change in Bacteroidetes in response to acute HFD. Carmody et al. (8) found that an average of 3.5 days of high-fat/high-sucrose feeding modulates microbiota communities. Typically, chronic HFD-induced obesity in both humans and rodents is marked by an increase in Firmicutes and a decrease in Bacteroidetes (21, 30). However, two studies of diet-induced obesity in humans and mice revealed decreases in Firmicutes, which is consistent with our results (27, 48). More recently it was observed that mice fed a lard-based diet had an enrichment in Bacteroidetes compared with a fish oil-based diet (6). When taking in all treatment groups, there was no correlation between the Bacteroidetes:Firmicutes ratio and energy intake, and a positive correlation between the Bacteroidetes:Firmicutes ratio and 3-day body weight change and liver TGs. We observed a strong, positive correlation between the Bacteroidetes:Firmicutes ratio, and both energy intake and 3-day change in body weight, only when LCR rats were fed an HFD. The relationship between the Bacteriodetes:Firmicutes ratio and liver TGs is intriguing and may be related to increased energy harvest; however, this response was not specific to HFD feeding.
Microbiota of LCR rats exhibit a predicted metabolic capacity consistent with what is reported in genetically obese mice, including a greater potential for energy and carbohydrate metabolism compared with HCR rats on the control diet (50). Furthermore, this supports the relative abundance data showing that LCR rats have greater Veillonellaceae and Phascolarctobacterium, which are both carbohydrate/fiber fermenters and produce predominantly acetate and propionate (17, 52). In response to acute HFD, LCR rats exhibited greater reductions in SCFA producers as well as their metagenomic potential for energy and carbohydrate metabolism. Interestingly, we found that the SCFA acetate was significantly higher in the circulation in LCR rats compared with HCR rats. Together, these data suggest that LCR rats have a unique potential to harvest more energy from diet more readily than highly fit HCR rats while on a low-fat diet, which is observed in obesity (50) and may be a contributing factor to hepatic steatosis development.
The role of SCFAs in contributing to NAFLD and other metabolic diseases is not fully understood. SCFAs are thought to contribute to energy harvest and de novo lipogenesis (55), and fermentation in the proximal large bowel is a sign of small intestinal bacterial overgrowth, which leads to increased gut permeability and bacterial endotoxin reaching the liver (26). In addition, it recently has been shown that a 12-wk HFD resulted in increased FFAR2 (SCFA receptor) expression in liver and skeletal muscle (12). Here, we report that acute HFD feeding elicited no appreciable differences in hepatic mRNA expression of IL-1β, TLR-4, or FFAR2 in HCR or LCR rats, suggesting that 3 days of HFD did not induce a hepatic inflammatory response. However, we did observe elevated intestinal FFAR2 mRNA expression in LCR rats, which is suggestive of elevated SCFA signaling in those animals.
Interestingly, we found that energy intake and 3-day body weight change was negatively correlated with relative abundance of SCFA-producing Ruminococcaceae and Ruminococcus (4). Acute HFD feeding in LCR rats resulted in robustly increased feeding efficiency, and strong negative correlations between Ruminococcaceae and Ruminococcus and energy intake and 3-day body weight change. Furthermore, our metagenomic prediction analyses support the notion that LCR rats have microbiota with greater carbohydrate and energy metabolism, which is suggestive of increased SCFA production while on the low-fat control diet. This metabolic potential is decreased when the LCR rats were switched to an acute HFD. These correlations, along with no appreciable differences in microbial metabolic potential toward carbohydrate metabolism, were not observed in HCR rats in response to acute HFD feeding. Collectively, these results suggest that LCR rats have a unique potential to harvest more energy from a low-fat diet and to respond differently to an acute HFD through decreases in SCFA-producing capacity. Previous studies have shown that SCFA binding to FFAR2 can elicit decreased food intake by stimulating appetite and the insulin-regulating hormones peptide YY and glucagon-like peptide 1 (14). However, our data show only a negative correlation between SCFA-producing bacteria and energy intake in LCR rats fed HFD, and energy intake was not different between LCR and HCR rats. These concepts need more thorough follow-up studies designed to investigate the role of the gut microbiota by utilizing germ-free facilities and microbiota transplant studies, as well as by studying the metabolic products (i.e., SCFA) of the microbiota and their involvement in NAFLD development and pathogenesis.
In summary, our results demonstrate that even on a low-fat control diet, HCR and LCR rats display different cecal microbiota profiles. Low-aerobically fit LCR rats have a greater propensity to gain weight and develop steatosis in response to an acute HFD compared with high-aerobically fit HCR rats. We posit that the physiologic changes observed in the LCR rats fed an acute HFD appear to be associated with decreases in SCFA-producing microbiota, and are supported by the microbiota of LCR rats having a greater metabolic capacity for energy and carbohydrate metabolism, which is decreased in response to acute HFD feeding. Furthermore, LCR rats had lower ileal tight junction protein expression, which is suggestive of greater gut permeability, and which is strongly associated with fatty liver disease development. In conclusion, divergent levels of intrinsic aerobic fitness affect the susceptibility to acute, HFD-induced fatty liver, which appear to be linked to alterations in SCFA-producing/energy harvesting potential in the gut.
GRANTS
This work was partially supported by American Heart Association Grant POST20110034 to E.M. Morris, National Institute of Diabetes and Digestive and Kidney Diseases Grant DK-088940 to J.P. Thyfault, Department of Veteran Affairs Grant CDA2 IK2BX001299 to R.S. Rector, and by VA Merit Review Grant I01 RX000123 to J.P. Thyfault. This work is also partially funded by the U.S. Department of Agriculture ARS Project 6026-51000-007-00D-05 to K. Shankar. The LCR-HCR rat model was funded by National Institutes of Health Office of Research Infrastructure Programs Grant P40OD021331 to L.G. Koch and S.L. Britton.
DISCLOSURES
No conflicts of interest, financial or otherwise, are declared by the authors.
AUTHOR CONTRIBUTIONS
E.M.M., S.L.B., L.G.K., J.P.T., and R.S.R. conception and design of research; M.R.P., E.M.M., S.V.C., U.D.W., K.S., J.P.T., and R.S.R. performed experiments; M.R.P., S.V.C., U.D.W., K.S., J.P.T., and R.S.R. analyzed data; M.R.P., E.M.M., K.S., J.P.T., and R.S.R. interpreted results of experiments; M.R.P. prepared figures; M.R.P. and R.S.R. drafted manuscript; M.R.P., E.M.M., S.V.C., U.D.W., K.S., S.L.B., L.G.K., J.P.T., and R.S.R. edited and revised manuscript; M.R.P., E.M.M., S.V.C., U.D.W., K.S., S.L.B., L.G.K., J.P.T., and R.S.R. approved final version of manuscript.
ACKNOWLEDGMENTS
We acknowledge the expert care of the rat colony provided by Molly Kalahar and Lori Heckenkamp and excellent technical assistance from Grace Meers. The LCR and HCR rat models are maintained as an international resource with support from the Department of Anesthesiology at the University of Michigan, Ann Arbor. Contact L.G.Koch at lgkoch@umich.edu, or S.L. Britton at brittons@umich.edu, for information on them. Microbiota analysis was supported with resources and the use of facilities at Arkansas Children's Nutrition Center, University of Arkansas for Medical Sciences in Little Rock, Arkansas. This work was supported with resources and the use of facilities at the Harry S. Truman Memorial VA Hospital in Columbia, Missouri.
REFERENCES
- 1.Allen JM, Berg Miller ME, Pence BD, Whitlock K, Nehra V, Gaskins HR, White BA, Fryer JD, Woods JA. Voluntary and forced exercise differentially alters the gut microbiome in C57BL/6J mice. J Appl Physiol 118: 1059–1066, 2015. [DOI] [PubMed] [Google Scholar]
- 2.Bajaj JS, Ridlon JM, Hylemon PB, Thacker LR, Heuman DM, Smith S, Sikaroodi M, Gillevet PM. Linkage of gut microbiome with cognition in hepatic encephalopathy. Am J Physiol Gastrointest Liver Physiol 302: G168–G175, 2012. [DOI] [PMC free article] [PubMed] [Google Scholar]
- 3.Bermon S, Petriz B, Kajeniene A, Prestes J, Castell L, Franco O. The microbiota: an exercise immunology perspective. Exerc Immunol Rev 21: 70–79, 2015. [PubMed] [Google Scholar]
- 4.Biddle A, Stewart L, Blanchard J, Leschine S. Untangling the genetic basis of fibrolytic specialization by Lachnospiraceae and Ruminococcaceae in diverse gut communities. Diversity 5: 627–640, 2013. [Google Scholar]
- 5.Bokulich NA, Subramanian S, Faith JJ, Gevers D, Gordon JI, Knight R, Mills DA, Caporaso JG. Quality-filtering vastly improves diversity estimates from Illumina amplicon sequencing. Nat Methods 10: 57–59, 2013. [DOI] [PMC free article] [PubMed] [Google Scholar]
- 6.Caesar R, Tremaroli V, Kovatcheva-Datchary P, Cani PD, Bäckhed F. Crosstalk between gut microbiota and dietary lipids aggravates WAT inflammation through TLR signaling. Cell Metab 22: 658–668, 2015. [DOI] [PMC free article] [PubMed] [Google Scholar]
- 7.Caporaso JG, Kuczynski J, Stombaugh J, Bittinger K, Bushman FD, Costello EK, Fierer N, Peña AG, Goodrich JK, Gordon JI, Huttley AG, Kelley ST, Knights D, Koenig JE, Ley RE, Lozupone AC, McDonald D, Muegge BD, Pirrung M, Reeder J, Sevinsky JR, Turnbaugh PJ, Walters AW, Widmann J, Yatsunenko T, Zaneveld J, Knight R. QIIME allows analysis of high-throughput community sequencing data. Nat Methods 7: 335–336, 2010. [DOI] [PMC free article] [PubMed] [Google Scholar]
- 8.Carmody RN, Gerber GK, Luevano JM, Gatti DM, Somes L, Svenson KL, Turnbaugh PJ. Diet dominates host genotype in shaping the murine gut microbiota. Cell Host Microbe 17: 72–84, 2014. [DOI] [PMC free article] [PubMed] [Google Scholar]
- 9.Carvalho FA, Koren O, Goodrich JK, Johansson ME, Nalbantoglu I, Aitken JD, Clemente JC, Cullender TC, Su Y, Chassaing B, Walters WA, González A, Barnich N, Darfeuille-Michaud A, Vijay-Kumar M, Knight R, Ley RE, Gewirtz AT. Transient inability to manage Proteobacteria promotes chronic gut inflammation in TLR5-deficient mice. Cell Host Microbe 12: 139–152, 2012. [DOI] [PMC free article] [PubMed] [Google Scholar]
- 10.Church TS, Kuk JL, Ross R, Priest EL, Biltoft E, Biltoff E, Blair SN. Association of cardiorespiratory fitness, body mass index, and waist circumference to nonalcoholic fatty liver disease. Gastroenterology 130: 2023–2030, 2006. [DOI] [PubMed] [Google Scholar]
- 11.Clarke SF, Murphy EF, O'Sullivan O, Lucey AJ, Humphreys M, Hogan A, Hayes P, O'Reilly M, Jeffery IB, Wood-Martin R, Kerins DM, Quigley E, Ross RP, O'Toole PW, Molloy MG, Falvey E, Shanahan F, Cotter PD. Exercise and associated dietary extremes impact on gut microbial diversity. Gut 63: 1913–1920, 2014. [DOI] [PubMed] [Google Scholar]
- 12.Cornall LM, Mathai ML, Hryciw DH, McAinch AJ. Diet-induced obesity up-regulates the abundance of GPR43 and GPR120 in a tissue specific manner. Cell Physiol Biochem 28: 949–958, 2011. [DOI] [PubMed] [Google Scholar]
- 13.Cox-York KA, Sheflin AM, Foster MT, Gentile CL, Kahl A, Koch LG, Britton SL, Weir TL. Ovariectomy results in differential shifts in gut microbiota in low versus high aerobic capacity rats. Physiol Rep 3: e12488, 2015. [DOI] [PMC free article] [PubMed] [Google Scholar]
- 14.Delzenne NM, Cani PD, Everard A, Neyrinck AM, Bindels LB. Gut microorganisms as promising targets for the management of type 2 diabetes. Diabetologia 58: 2206–2217, 2015. [DOI] [PubMed] [Google Scholar]
- 14a.De Minicis S, Rychlicki C, Agostinelli L, Saccomanno S, Candelaresi C, Trozzi L, Mingarelli E, Facinelli B, Magi G, Palmieri C, Marzioni M, Benedetti A, Svegliati-Baroni G. Dysbiosis contributes to fibrogenesis in the course of chronic liver injury in mice. Hepatology 59: 1738–1749, 2014. [DOI] [PubMed] [Google Scholar]
- 15.Edgar RC. Search and clustering orders of magnitude faster than BLAST. Bioinformatics 26: 2460–2461, 2010. [DOI] [PubMed] [Google Scholar]
- 17.Flint HJ, Scott KP, Louis P, Duncan SH. The role of the gut microbiota in nutrition and health. Nat Rev Gastroenterol Hepatol 9: 577–589, 2012. [DOI] [PubMed] [Google Scholar]
- 18.Friedman MI, Harris RB, Ji H, Ramirez I, Tordoff MG. Fatty acid oxidation affects food intake by altering hepatic energy status. Am J Physiol Regul Integr Comp Physiol 276: R1046–R1053, 1999. [DOI] [PubMed] [Google Scholar]
- 19.Friedman MI. Fuel partitioning and food intake. Am J Clin Nutr 67: 513S–518S, 1998. [DOI] [PubMed] [Google Scholar]
- 20.Gómez-Hurtado I, Such J, Sanz Y, Francés R. Gut microbiota-related complications in cirrhosis. World J Gastroenterol 20: 15624–15631, 2014. [DOI] [PMC free article] [PubMed] [Google Scholar]
- 21.Kim KA, Gu W, Lee IA, Joh EH, Kim DH. High fat diet-induced gut microbiota exacerbates inflammation and obesity in mice via the TLR4 signaling pathway. PLoS One 7: e47713, 2012. [DOI] [PMC free article] [PubMed] [Google Scholar]
- 22.Knights D, Kuczynski J, Charlson ES, Zaneveld J, Mozer MC, Collman RG, Bushman FD, Knight R, Kelley ST. Bayesian community-wide culture-independent microbial source tracking: supplementary material. Nat Methods 8: 761–763, 2011. [DOI] [PMC free article] [PubMed] [Google Scholar]
- 23.Koch LG, Britton SL. Artificial selection for intrinsic aerobic endurance running capacity in rats. Physiol Genomics 5: 45–52, 2001. [DOI] [PubMed] [Google Scholar]
- 24.Kozich JJ, Westcott SL, Baxter NT, Highlander SK, Schloss PD. Development of a dual-index sequencing strategy and curation pipeline for analyzing amplicon sequence data on the miseq illumina sequencing platform. Appl Environ Microbiol 79: 5112–5120, 2013. [DOI] [PMC free article] [PubMed] [Google Scholar]
- 24a.la Fleur S, Ji H, Manalo S, Friedman MI, Dallman MF. The hepatic vagus mediates fat-induced inhibition of diabetic hyperphagia. Diabetes 52: 2321–2330, 2003. [DOI] [PubMed] [Google Scholar]
- 25.Langille MG, Zaneveld J, Caporaso JG, McDonald D, Knights D, Reyes JA, Clemente JC, Burkepile DE, Vega Thurber RL, Knight R, Beiko RG, Huttenhower C. Predictive functional profiling of microbial communities using 16S rRNA marker gene sequences. Nat Biotechnol 31: 814–821, 2013. [DOI] [PMC free article] [PubMed] [Google Scholar]
- 26.Lau E, Carvalho D, Freitas P. Gut microbiota: association with NAFLD and metabolic disturbances. Biomed Res Int 2015: 979515, 2015. [DOI] [PMC free article] [PubMed] [Google Scholar]
- 27.Lecomte V, Kaakoush NO, Maloney CA, Raipuria M, Huinao KD, Mitchell HM, Morris MJ. Changes in gut microbiota in rats fed a high fat diet correlate with obesity-associated metabolic parameters. PLoS One 10: e0126931, 2015. [DOI] [PMC free article] [PubMed] [Google Scholar]
- 28.Lee DC, Artero EG, Sui X, Blair SN. Review: mortality trends in the general population: the importance of cardiorespiratory fitness. J Psychopharmacol 24, Suppl 4: 27–35, 2010. [DOI] [PMC free article] [PubMed] [Google Scholar]
- 29.Ley RE, Bäckhed F, Turnbaugh P, Lozupone CA, Knight RD, Gordon JI. Obesity alters gut microbial ecology. Proc Natl Acad Sci USA 102: 11070–11075, 2005. [DOI] [PMC free article] [PubMed] [Google Scholar]
- 30.Ley RE. Obesity and the human microbiome. Curr Opin Gastroenterol 26: 5–11, 2010. [DOI] [PubMed] [Google Scholar]
- 31.Liu TW, Park YM, Holscher HD, Padilla J, Scroggins RJ, Welly R, Britton SL, Koch LG, Vieira-Potter VJ, Swanson KS. Physical activity differentially affects the cecal microbiota of ovariectomized female rats selectively bred for high and low aerobic capacity. PLoS One 10: e0136150, 2015. [DOI] [PMC free article] [PubMed] [Google Scholar]
- 32.Lozupone C, Knight R. UniFrac: a new phylogenetic method for comparing microbial communities. Appl Environ Microbiol 71: 8228–8235, 2005. [DOI] [PMC free article] [PubMed] [Google Scholar]
- 33.Lupp C, Robertson ML, Wickham ME, Sekirov I, Champion OL, Gaynor EC, Finlay BB. Host-mediated inflammation disrupts the intestinal microbiota and promotes the overgrowth of enterobacteriaceae. Cell Host Microbe 2: 119–129, 2007. [DOI] [PubMed] [Google Scholar]
- 34.McDonald D, Price MN, Goodrich J, Nawrocki EP, DeSantis TZ, Probst A, Andersen GL, Knight R, Hugenholtz P. An improved Greengenes taxonomy with explicit ranks for ecological and evolutionary analyses of bacteria and archaea. ISME J 6: 610–618, 2012. [DOI] [PMC free article] [PubMed] [Google Scholar]
- 35.Mehal WZ. The Gordian Knot of dysbiosis, obesity and NAFLD. Nat Rev Gastroenterol Hepatol 10: 637–644, 2013. [DOI] [PubMed] [Google Scholar]
- 36.Mika A, Van Treuren W, González A, Herrera JJ, Knight R, Fleshner M. Exercise is more effective at altering gut microbial composition and producing stable changes in lean mass in juvenile versus adult male F344 rats. PLoS One 10: e0125889, 2015. [DOI] [PMC free article] [PubMed] [Google Scholar]
- 38.Morris EM, Jackman MR, Johnson GC, Liu TW, Lopez JL, Kearney ML, Fletcher JA, Meers GM, Koch LG, Britton SL, Rector RS, Ibdah JA, MacLean PS, Thyfault JP. Intrinsic aerobic capacity impacts susceptibility to acute high-fat diet-induced hepatic steatosis. Am J Physiol Endocrinol Metab 307: E355–E364, 2014. [DOI] [PMC free article] [PubMed] [Google Scholar]
- 39.Noland RC, Thyfault JP, Henes ST, Whitfield BR, Woodlief TL, Evans JR, Lust JA, Britton SL, Koch LG, Dudek RW, Dohm GL, Cortright RN, Lust RM. Artificial selection for high-capacity endurance running is protective against high-fat diet-induced insulin resistance. Am J Physiol Endocrinol Metab 293: E31–E41, 2007. [DOI] [PubMed] [Google Scholar]
- 40.Obata T, Goto Y, Kunisawa J, Sato S, Sakamoto M, Setoyama H, Matsuki T, Nonaka K, Shibata N, Gohda M, Kagiyama Y, Nochi T, Yuki Y, Fukuyama Y, Mukai A, Shinzaki S, Fujihashi K, Sasakawa C, Iijima H, Goto M, Umesaki Y, Benno Y, Kiyono H. Indigenous opportunistic bacteria inhabit mammalian gut-associated lymphoid tissues and share a mucosal antibody-mediated symbiosis. Proc Natl Acad Sci USA 107: 7419–7424, 2010. [DOI] [PMC free article] [PubMed] [Google Scholar]
- 41.Parks DH, Tyson GW, Hugenholtz P, Beiko RG. STAMP: statistical analysis of taxonomic and functional profiles. Bioinformatics 30: 3123–3124, 2014. [DOI] [PMC free article] [PubMed] [Google Scholar]
- 42.Perseghin G, Lattuada G, De Cobelli F, Ragogna F, Ntali G, Esposito A, Belloni E, Canu T, Terruzzi I, Scifo P, Del Maschio A, Luzi L. Habitual physical activity is associated with intrahepatic fat content in humans. Diabetes Care 30: 683–688, 2007. [DOI] [PubMed] [Google Scholar]
- 43.Price MN, Dehal PS, Arkin AP. FastTree 2—approximately maximum-likelihood trees for large alignments. PLoS One 5: e9490, 2010. [DOI] [PMC free article] [PubMed] [Google Scholar]
- 44.Rector RS, Thyfault JP. Does physical inactivity cause nonalcoholic fatty liver disease? J Appl Physiol 111: 1828–1835, 2011. [DOI] [PubMed] [Google Scholar]
- 45.Rector RS, Uptergrove GM, Morris EM, Borengasser SJ, Laughlin MH, Booth FW, Thyfault JP, Ibdah JA. Daily exercise vs. caloric restriction for prevention of nonalcoholic fatty liver disease in the OLETF rat model. Am J Physiol Gastrointest Liver Physiol 300: G874–G883, 2011. [DOI] [PMC free article] [PubMed] [Google Scholar]
- 46.Rideout JR, He Y, Navas-Molina JA, Walters WA, Ursell LK, Gibbons SM, Chase J, McDonald D, Gonzalez A, Robbins-Pianka A, Clemente JC, Gilbert JA, Huse SM, Zhou HW, Knight R, Caporaso JG. Subsampled open-reference clustering creates consistent, comprehensive OTU definitions and scales to billions of sequences. PeerJ 2: e545, 2014. [DOI] [PMC free article] [PubMed] [Google Scholar]
- 47.Schwartz DM, Wolins NE. A simple and rapid method to assay triacylglycerol in cells and tissues. J Lipid Res 48: 2514–2520, 2007. [DOI] [PubMed] [Google Scholar]
- 48.Schwiertz A, Taras D, Schäfer K, Beijer S, Bos NA, Donus C, Hardt PD. Microbiota and SCFA in lean and overweight healthy subjects. Obesity (Silver Spring) 18: 190–195, 2010. [DOI] [PubMed] [Google Scholar]
- 49.Thyfault JP, Rector RS, Uptergrove GM, Borengasser SJ, Morris EM, Wei Y, Laye MJ, Burant CF, Qi NR, Ridenhour SE, Koch LG, Britton SL, Ibdah JA. Rats selectively bred for low aerobic capacity have reduced hepatic mitochondrial oxidative capacity and susceptibility to hepatic steatosis and injury. J Physiol 587: 1805–1816, 2009. [DOI] [PMC free article] [PubMed] [Google Scholar]
- 50.Turnbaugh PJ, Ley RE, Mahowald MA, Magrini V, Mardis ER, Gordon JI. An obesity-associated gut microbiome with increased capacity for energy harvest. Nature 444: 1027–1031, 2006. [DOI] [PubMed] [Google Scholar]
- 51.Vernon G, Baranova A, Younossi ZM. Systematic review: the epidemiology and natural history of non-alcoholic fatty liver disease and non-alcoholic steatohepatitis in adults. Aliment Pharmacol Ther 34: 274–285, 2011. [DOI] [PubMed] [Google Scholar]
- 52.Watanabe Y, Nagai F, Morotomi M. Characterization of Phascolarctobacterium succinatutens sp. nov., an asaccharolytic, succinate-utilizing bacterium isolated from human feces. Appl Environ Microbiol 78: 511–518, 2012. [DOI] [PMC free article] [PubMed] [Google Scholar]
- 53.Wisløff U, Najjar SM, Ellingsen O, Haram PM, Swoap S, Al-Share Q, Fernström M, Rezaei K, Lee SJ, Koch LG, Britton SL. Cardiovascular risk factors emerge after artificial selection for low aerobic capacity. Science 307: 418–420, 2005. [DOI] [PubMed] [Google Scholar]
- 54.Zhang J, Kobert K, Flouri T, Stamatakis A. PEAR: a fast and accurate Illumina Paired-End reAd mergeR. Bioinformatics 30: 614–620, 2014. [DOI] [PMC free article] [PubMed] [Google Scholar]
- 55.Zhu L, Baker RD, Baker SS. Gut microbiome and nonalcoholic fatty liver diseases. Pediatr Res 77: 245–251, 2015. [DOI] [PubMed] [Google Scholar]
- 56.Zhu L, Baker SS, Gill C, Liu W, Alkhouri R, Baker RD, Gill SR. Characterization of gut microbiomes in nonalcoholic steatohepatitis (NASH) patients: a connection between endogenous alcohol and NASH. Hepatology 57: 601–609, 2013. [DOI] [PubMed] [Google Scholar]