Advanced high-resolution interior tomography has been used to explore the morphometric and geometric differences between surface and core alveoli within the intact mouse lung. Understanding of these differences is of importance when inferring global characteristics from limited sampling methodologies and may provide new insights into lung function and disease susceptibilities. The methodologies can be applied to an investigation of larger animals and humans.
Keywords: systematic uniform random sampling, quantitative CT, pulmonary imaging, lung parenchyma, central line-based morphometry, acinar structure
Abstract
Through interior tomography, high-resolution microcomputed tomography (μCT) systems provide the ability to nondestructively assess the pulmonary acinus at micron and submicron resolutions. With the application of systematic uniform random sampling (SURS) principles applied to in situ fixed, intact, ex vivo lungs, we have sought to characterize morphometric differences in central vs. surface acini to better understand how well surface acini reflect global acinar geometry. Lungs from six mice (A/J strain, 15-20 wk of age) were perfusion fixed in situ and imaged using a multiresolution μCT system (Micro XCT 400, Zeiss). With the use of lower-resolution whole lung images, SURS methods were used for identification of central and surface foci for high-resolution imaging. Acinar morphometric metrics included diameters, lengths, and branching angles for each alveolar duct and total path lengths from entrance of the acinus to the terminal alveolar sacs. In addition, acinar volume, alveolar surface area, and surface area/volume ratios were assessed. A generation-based analysis demonstrated that central acini have significantly smaller branch diameters at each generation with no significant increase in branch lengths. In addition to larger-diameter alveolar ducts, surface acini had significantly increased numbers of branches and terminal alveolar sacs. The total path lengths from the acinar entrance to the terminal nodes were found to be higher in the case of surface acini. Volumes and surface areas of surface acini are greater than central acini, but there were no differences in surface/volume ratios. In conclusion, there are significant structural differences between surface and central acini in the A/J mouse.
NEW & NOTEWORTHY
Advanced high-resolution interior tomography has been used to explore the morphometric and geometric differences between surface and core alveoli within the intact mouse lung. Understanding of these differences is of importance when inferring global characteristics from limited sampling methodologies and may provide new insights into lung function and disease susceptibilities. The methodologies can be applied to an investigation of larger animals and humans.
the mammalian pulmonary acinus is defined as the peripheral part of airways that are provided with alveoli and begin with the transitional bronchiole (4, 46). Functionally, this complex microstructure of alveolar ducts and alveoli (19, 25) represents the largest unit in which all airways contribute to gas exchange. Quantitative assessment of pulmonary acinar structure is therefore an essential prerequisite to building functional models that represent the performance of the lung and assess the state of gas exchange. Gas transport in the acinar airways occurs predominantly by diffusion in the gas phase, and development of models that accurately represent the dynamics of air flow is dependent on a thorough understanding of the geometry of the alveolar ducts (1, 4, 27, 28, 35). Present models of alveolar air flow mechanics rely on quantitative assessment of acinar structure performed using traditional techniques such as histological studies using stereology (25, 44, 45, 47) and casting techniques (4, 22, 32). Reconstruction techniques applied to serial histological sections have sought to address the limitations of traditional techniques and perform direct assessment of functional parameters such as surface area and number of alveoli (19). These techniques are limited by the intensive reconstruction and difficulty in acquiring adequate numbers of representative samples. Optical coherence tomography (OCT) has emerged as a method that provides detailed three-dimensional, as well as four-dimensional (space plus time), information related to acinar level lung structure and mechanics (14–18, 24). OCT does not require tissue fixation and allows for in vivo imaging in real time. Although OCT techniques enable in vivo imaging at previously unavailable resolutions (∼10–12 μm), they are limited by the depth of field. Therefore, present studies are either invasive through the use of needle probes used to access alveoli beneath the lung surface (15), or they are limited to assessment of alveoli at the lung surface through a transparent pleural window (17, 20). However, how representative the alveoli are, relative to the whole lung, at the pleura remains unknown. To assess and understand the underlying heterogeneity in pulmonary structure, we seek to image and assess the branch morphometry of pulmonary acini that extend to the pleural surface and compare our metrics to acini situated deeper in the lung.
To ensure that the acini under study are representative of the respective regions, it becomes important to develop adequate sampling tools to identify and selectively image acini from specified regions of interest. The 2010 ATS/ERS Joint Task Force on Quantitative Assessment of Lung Structure has established standards that outline the principles of design-based stereology and recommendations that seek to maximize accuracy of measurements and balance it against efficient study design (6). Technological improvements in computed tomographic (CT) acquisition systems and reconstruction techniques are providing nondestructive imaging techniques to perform quantitative assessment of acinar morphometry via a synchrotron energy source (3, 21) and interior tomographic techniques (7, 40, 41). Coupled with fixation methods that preserve in vivo structural integrity (42) and the application of the principles of Systematic Uniform Random Sampling (SURS), interior tomography-based assessment techniques allow for nondestructive regional interrogation and characterization of the whole mouse lung at micron and submicron resolution. With appropriate matching of ex vivo structure to in vivo scanning via micro-CT (μCT) techniques, it has been demonstrated that one can estimate configurational changes within individual acini as a function of lung volume changes (10).
In this study, our goals were twofold: 1) to develop a tool to perform sampling of acini in the fixed lung specimens through the application of the principles of SURS, with the added flexibility of selecting anatomical regions of interest, and 2) to use these sampling methods to evaluate regional differences in acinar structure. In regards to our first goal, we have previously (42) developed in vivo imaging protocols, fixation techniques, and high-resolution (HRES) interior tomographic imaging that allow us to perform unbiased characterization of the murine pulmonary acinus, and these have been employed to sample murine lungs appropriately to address our second question.
In regards to our second goal, we have applied these tools to sample acini from two regions of interest, namely acini that extend to the pleural surface (surface acini) and acini that are surrounded on all sides by lung parenchyma (central acini) and assess the variations in acinar morphometry across these two sublocales. The assessment and characterization of the differences in acinar airspace morphometry between these two locales will provide improved understanding of the regional heterogeneity in the lung and provide information that will assist in evaluating the assessment of the surface alveoli and airspaces that have been reported through other optical techniques as representative of the whole lung.
METHODS
A total of six mice from a commonly studied strain were used for this study (A/J, Jackson Laboratories, 15–20 wk of age). The animals were housed in an animal facility at the University of Iowa. All experiments and protocols were performed subject to approval by the Institutional Animal Care and Use Committee (IACUC) at the University of Iowa.
The lung imaging and fixation protocols have been previously presented (40, 42) and are briefly outlined here. Each animal was imaged using an intermittent iso-pressure breath hold (IIBH) technique (38) at a fixed pressure of 20 cmH2O. Following imaging, the vasculature was flushed, and a glycol-based fixative solution was administered through the inferior vena cava, fixing the pulmonary tissue in situ through perfusion of the fixative. The lungs were surgically excised and dried at room temperature while maintaining controlled lung inflation via constant airway pressure at 20 cmH2O to mirror the in vivo imaging pressure. Previous studies (40, 42) have demonstrated that the fixation technique preserves the in vivo-like state of the acinar and alveolar architecture and have applied these techniques to perform stereological assessment of the mouse lung parenchyma (40, 42).
Imaging protocols.
The fixed lung was imaged first at lower resolution (∼12 μm isotropic voxel size) to acquire a large field of view (LFOV) image that served as a guide for selection of the locations for HRES interior tomographic imaging. An XRadia MicroXCT-400 (20–90 KeV) scanner (Zeiss) was used for all HRES imaging. The adjustable microscopic objectives allow for continuous adjustable magnification and resolution. The combination of off-center scan capability and adjustable magnification of the camera allow us to image the whole lung, followed by HRES imaging at particular spots of interest for detailed assessment of individual acini. The scan parameters for the MicroXCT system were as follows: 40 kV, 200 μA, with a 2-s exposure per projection, detector binning of 1, a step size of 0.125° per projection over 180° using a ×0.5 objective lens for the LFOV scans while the HRES scan was acquired with the same source settings with a 8 s per projection exposure, detector binning of 2, step size of 0.125° over 184° using a ×10 magnification lens. The HRES images were acquired with an isotropic voxel size of 2 μm.
SURS.
SURS principles were applied to determine suitable unbiased locations for HRES imaging from the LFOV image. The sampling process was iteratively used to reduce the dimensionality of the lung to first select individual slices from the 3D dataset and reapplied to perform point selection on each 2D image. The process can be performed separately for right and left lungs if needed. In this study, the whole lung was included for sampling. The general steps involved are detailed below.
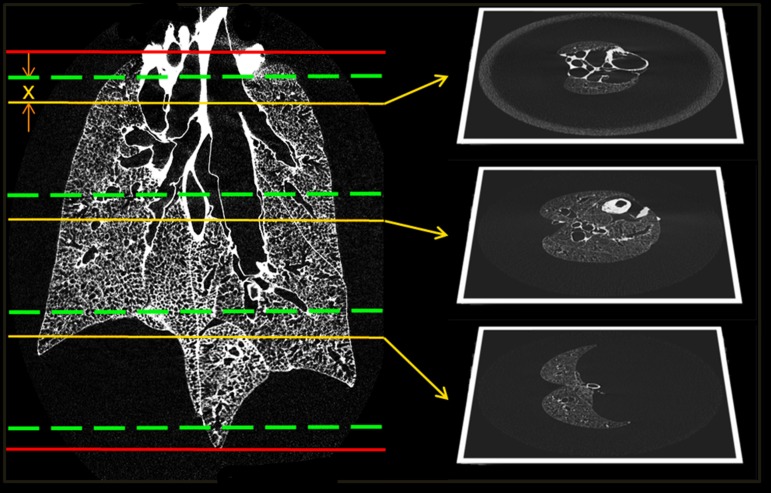
The 3D dataset is visually inspected to identify the axial limits of the region of interest, i.e., first and last axial slices in which the lung can be identified (Zmin, Zmax). The axial limits are shown in red in Fig. 1.
Fig. 1.
Stage 1 of the systematic uniform random sampling process. The red lines indicate the limits of the lung. The slices suitable for sampling are divided into 3 stacks. The green lines represent the stack boundaries. A random offset x is applied identically to each block to select slices as shown above. The sampling reduces the dimensionality of the data from a 3D volume to a set of 2D slices. The selected slices are then subjected to the next stage of sampling.
The axial limits are further constricted by half the size of the FOV of the HRES image (∼1 mm at each end, equaling ∼80 slices at an LFOV resolution of 12 μm). This does not eliminate any part of the lung from sampling because the point selection is used to set the center of the FOV for the HRES image. The new axial limits (Zstart, Zend) represent viable slices for sampling.
The range of slices (Zrange = Zend − Zstart) is divided into n equal stacks. The number of stacks equals the number of locations to be selected for HRES imaging. Each stack has a size S = Zrange/n slices each. The stack boundaries are depicted in green in Fig. 1.
A random offset P is chosen such that 1 ≤ P ≤ S. This offset represents the slice to be selected from each stack. This offset is applied uniformly to each stack such that n slices chosen are: Zstart + i × (S) + P, where i = 0 to n − 1.
The application of the offset is depicted in yellow in Fig. 1. These sets of operations have reduced the 3D dataset to a subselection of 2D slices. The following steps are applied on each slice chosen in this step and represent the second level of SURS.
Note, in our study, three locations each were used for HRES imaging of central and surface acini. This was achieved by setting n = 3 and independently sampling the central and surface acini one after the other. The differentiation in sampling between central and surface acini is established at the second level of sampling.
A grid with row and column separation equaling the FOV of the HRES image (∼2 mm) is overlaid on the 2D slice. This grid mimics the stack separation that was performed in the previous steps. Similarly to the stack offset, a random offset is applied to the starting coordinates of the grid. The grid generation and application of a random offset were performed using an open-source ImageJ-based tool (FIJI) (29). Each intersection point on the grid represents a viable coordinate for sampling a region for imaging; on each slice, one point is selected at random. To limit the points to regions of interest, a binary mask image is used. The sampling tool allows the user to create a temporary 2D mask on the fly through an extrapolation of manual points or by importing a 2D mask that has already been created. This allows the user to limit the viable samples to specific regions of interest based on study design.
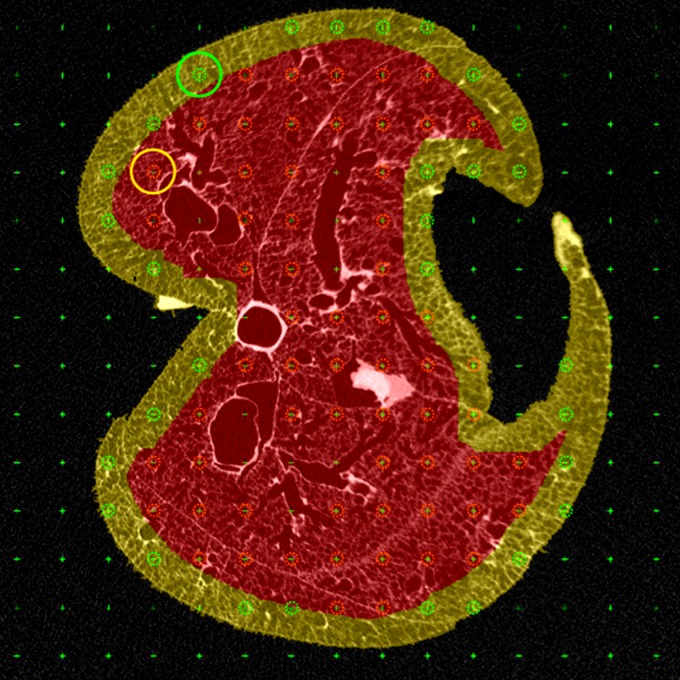
Note, in our study, central acini were sampled using a lung mask that was eroded to eliminate pleural regions, while surface acini were sampled by using a “peel” mask by subtracting the eroded mask from the original mask to isolate acini that are on the pleural surface. An example of a 2D slice with a grid overlay, along with an example of the eroded mask and the “peel” mask, is shown in Fig. 2. All points (excluding those that fall on large airways or pulmonary vasculature) that fall within the corresponding region of interest mask are eligible for HRES imaging. The set of all eligible points for central and surface acini are shown in red and green, respectively.
Fig. 2.
Demonstration of region of interest-based sampling. The masks used to separate the central and surface acini are depicted in red and yellow, respectively. A grid is overlaid on the 2D slice (the intersection points of the grid are indicated by a green cross), and the points that fall within the respective lung masks are eligible for selection. All points that fall on large airways or the blood vessels are eliminated. The points eligible for central and surface sampling are depicted in red and green circles, respectively. The random point chosen for each example and its unadjusted circular field of view (FOV) are also depicted.
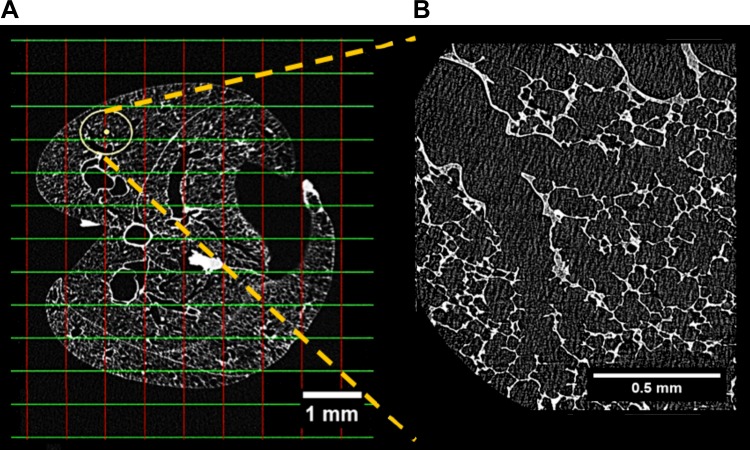
A single random intersection point in each 2D slice, which falls within the binary mask, is chosen at random as a location for HRES imaging. Figure 2 shows an example of one randomly selected point each for central and surface acini and the FOV of the HRES image at that coordinate. The acinus at this randomly selected location is selected for imaging. To ensure that the chosen acinus is completely within the FOV for the HRES image, the LFOV stack is manually inspected to identify the limits of the acinus, and the coordinates are shifted to center the FOV on the chosen acinus. An example of a shifted center and the new FOV are shown in yellow in Fig. 3A along with the corresponding HRES image in Fig. 3B. These selected locations are translated to scanner coordinates and sequenced in a batch for HRES interior tomographic imaging.
Fig. 3.
Example of shifted FOV and corresponding high-resolution (HRES) image. The circle in A represents the FOV of the HRES image at the new shifted coordinate. The center of the FOV has been manually shifted from the nearest grid intersection to ensure that the selected acinus is completely within the FOV. The HRES image corresponding to the highlighted FOV is shown in B.
This protocol resulted in the sampling and imaging of three central and three surface acini from each lung specimen. A total of 36 acini, 18 central and surface acini each, were imaged. Four of the image datasets were removed from analysis because of artifacts during image acquisition, resulting in a total of 32 acini included in this analysis.
Segmentation and morphometric analysis.
Image-based segmentation of individual acini from the surrounding airspace was carried out using a multiscale topo-morphologic approach (26). This approach has previously been applied for acinar segmentation (2), and the advantages of morphometric measurements using reconstructed acini over traditional casting techniques have been studied (40). Acinar volume was calculated by multiplying the voxel count in the binary segmentation mask with the 3D voxel size (2 × 2 × 2 μm3). The segmentation mask was also used to generate a surface mesh using a marching cube algorithm (12). The surface was smoothed using a size-preserving algorithm (37). The alveolar surface area was calculated as the sum of all triangles in the surface mesh.
Morphometric analysis was carried out using a center-line approach that has been previously presented (7). The center line of the acinar segmentation mask was generated by means of an iterative 3D surface-thinning algorithm developed by Lee et al. (11). Manual branch-point selection was carried out to eliminate small branches that lead to individual alveoli and to correct for erroneous branches that arise because of segmentation faults or tissue deterioration. The lengths, diameters (diameter of the alveolar ducts, traditionally referred to as inner diameter), and branching angles for each branch were determined using the center line as a reference. Additional parameters that were computed include number of terminals, total longitudinal path length to each terminal node, and histogram of branches in each acinus grouped by generation as calculated from the entrance to the acinus. The center line was generated using an open-source ImageJ-based tool, FIJI (29), and the manual branch-point selection was performed using ITKSnap (48). All computational analysis was performed on MATLAB (Mathworks).
Statistical analysis.
Two-way ANOVA tests were used to compare each morphometric measure across central and surface acini with the generation number as the second variable. To reliably compare acinar measurements across specimens, the statistical analysis was repeated after normalization by total lung length (as measured from apex to base from the ex vivo LFOV μCT image). ANOVA tests were used to test for significance in acinar volume across central and surface acini with the sample number as the second variable, before and after normalization by total lung volume.
RESULTS
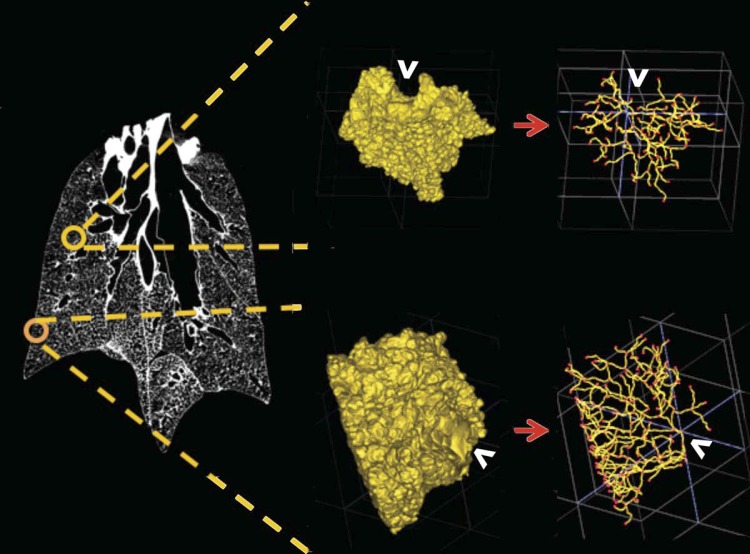
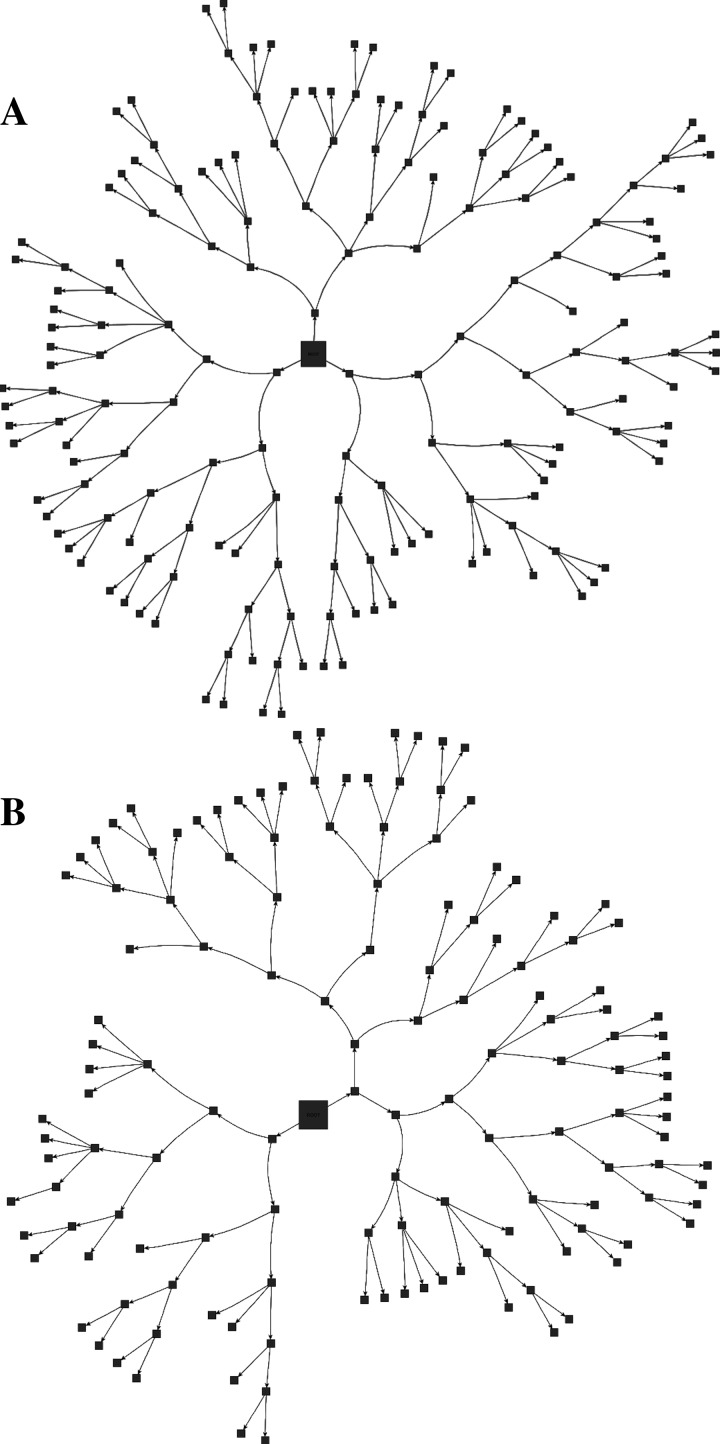
The 3D structures of a surface and central acinus, along with their anatomical location in the lung and their center line, skeleton are shown in Fig. 4. Through direct visual inspection of the 3D-rendered acini, we observed distinct differences in the structure of acini depending on their location within the lung. A flattened radial-tree representation of the acinar branching structure, for one central and surface acinus each, is shown in Fig. 5, A and B, respectively. The entrance to the acinus is enlarged and presented at the center. The radial distance from the center represents an increase in the generation number of the acinus. In the examples shown in Fig. 5, branches in the surface acinus extend to a maximum of nine generations, whereas branches in the central acinus extend to a maximum of eight generations.
Fig. 4.
Sampling of surface and central acini, with the 3D-rendered acinus and the respective center-line trees used for morphometric analysis. Central acini extend isotropically, whereas surface acini have branches “fanning” toward the pleural surface. The white arrows indicate the entrance to the acinus.
Fig. 5.
Schematic representation of the acinar branching structure. A and B: branching structure for 1 central and surface acinus, respectively. The branches are not to scale but represent an example of the acinar branching patterns. The entrance to the acinus is enlarged for better visualization. The distance from the center represents an increase in the generation number of the branch.
The mean total lung volume was 1,099 ± 143 mm3. This is comparable to the lung volumes reported in the C57Bl/6 mice fixed at identical pressures of 20 cmH2O (40) and in A/J fixed mice at pressures comparable to the current protocols (15 cmH2O, 30 cmH2O) (33, 34, 36, 38). The volume of surface acini extending to the pleural surface was significantly greater than that of central acini contained in deeper parts of lung parenchyma (0.27 ± 0.02 mm3 vs. 0.16 ± 0.05 mm3; P < 0.01). There were no significant differences in volume differences between the individual samples. Normalization by total lung volume did not affect statistical significance. Dividing total lung volume by average acinar volume, we estimated average number of acini per lung at 5,510 ± 371 acini.
Similar to acinar volume, the average alveolar surface area of a surface acinus was significantly greater (13.4 ± 2.43 mm2 vs. 10.8 ± 1.4 mm2; P = 0.01), suggesting that the larger volume is not related simply to higher compliance of surface acini but has a structural basis. The surface-to-volume ratio showed no significant difference between the two regions of interest (56.3 ± 6.98/mm in central acini vs. 49.5 ± 9.4/mm for the old mice).
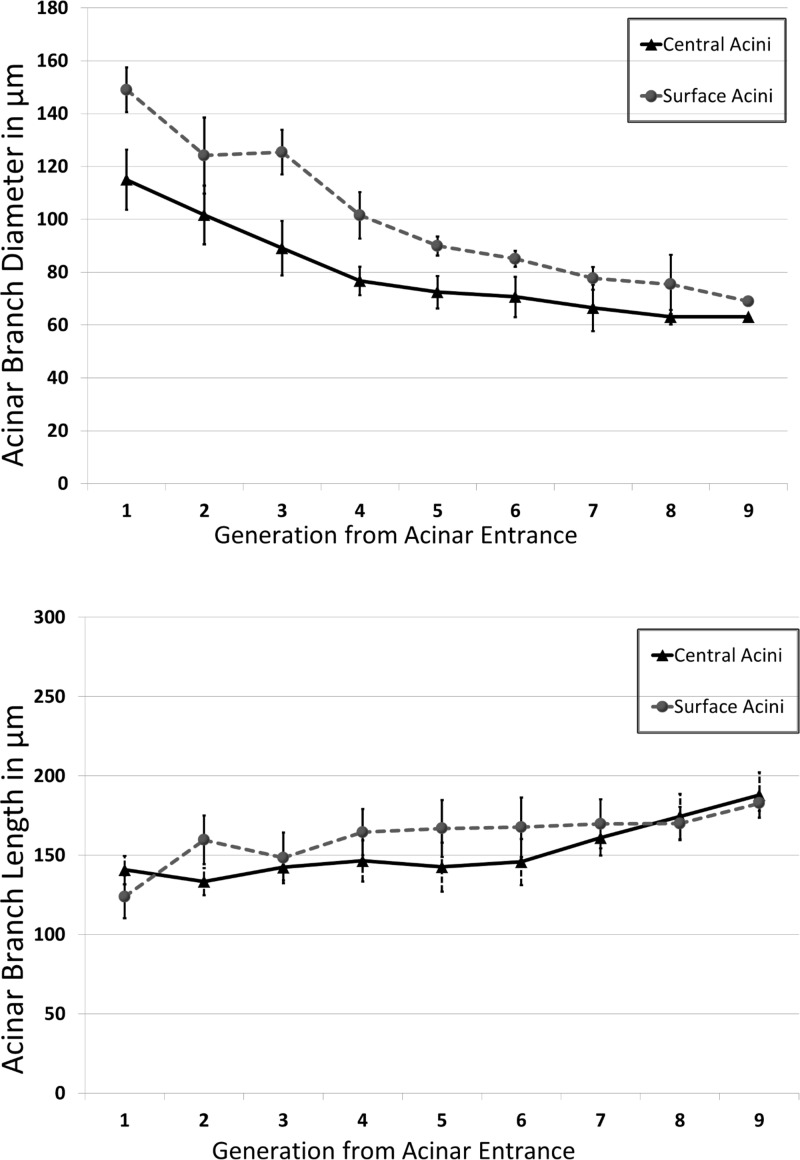
The diameter of the alveolar ducts ranges from 148.00 ± 10.49 μm at the transitional bronchiole to 68.00 ± 11.38 μm at the most distal generation in surface acini and from 115.00 ± 2.72 μm to 63.00 ± 4.32 μm in the central acini. The variations in branch diameters are shown in Fig. 6A. Surface acini have significantly larger branch diameters at every generation except at the last generation (P < 0.01). There were no statistically significant differences in branch lengths in the sequential generations between surface and central acini, even though there appeared to be a tendency toward longer segments in most generations, as evidenced by the branch length distributions by generation shown in Fig. 6B.
Fig. 6.
A and B: variations in acinar branch diameters and branch lengths, respectively, across central and surface acini. Measurements are averaged at each generation. The differences in diameters between surface and central acini are diminished near the terminal nodes, indicating that the alveolar sacs are similar in size. There are no significant differences in branch lengths between central and surface acini.
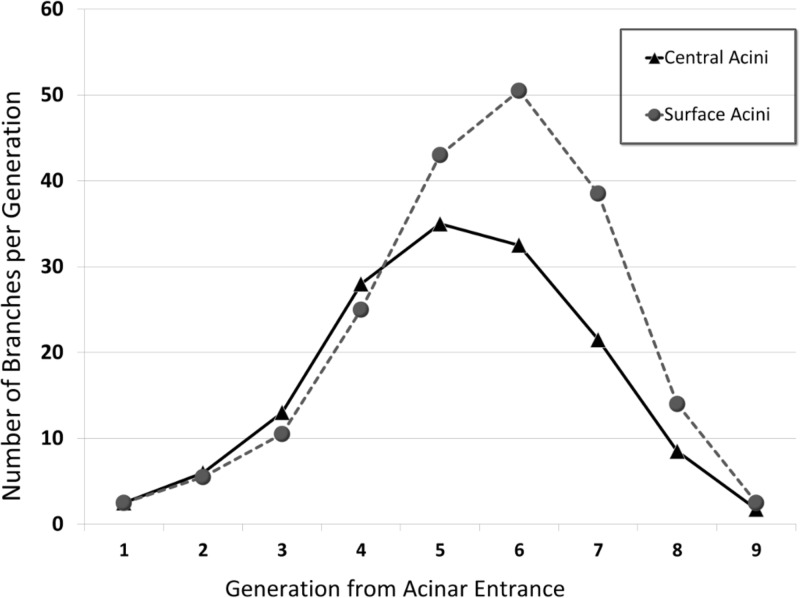
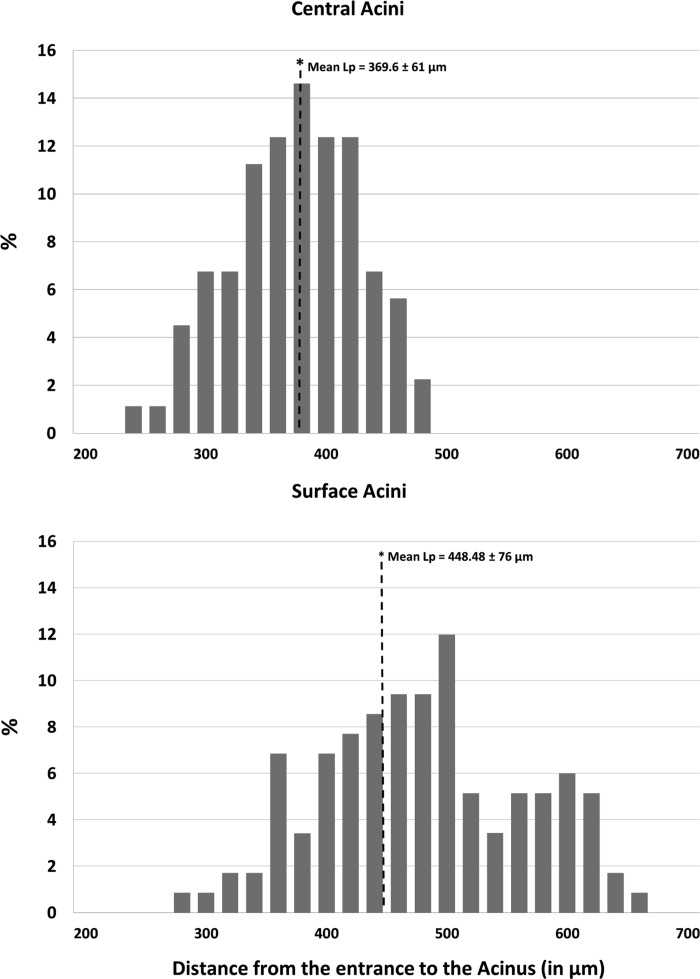
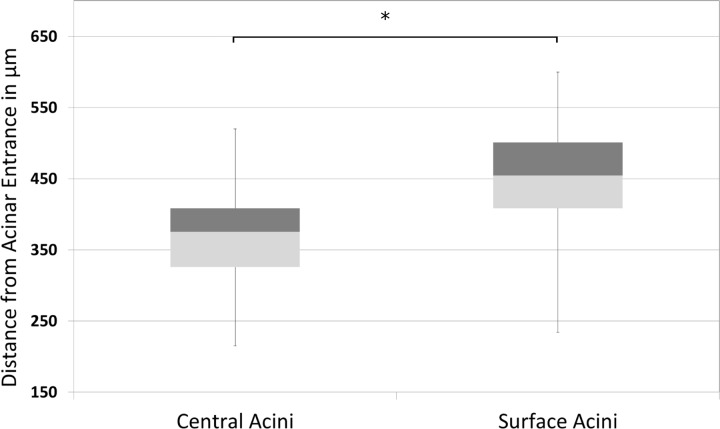
The average branch histogram for central and surface acini, computed as the average number of branches per generation, is shown in Fig. 7. For the first few generations, all acini follow the power law, with exponential increase in number of branches attributable to dichotomic branching as long as there is no break-off (see Fig. 5). In surface acini, this increase continues for two generations more than in central acini, leading to a larger number of branches. All surface acini were found to have alveolar sacs that extended to nine generations, whereas most central acini terminated at the eighth generation. Only two central acini were found to extend to the ninth generation. The higher branch count and generation numbers account for the increase in acinar volume and increase in total path length observed in surface acini. Histograms of percentage distribution of path lengths in central and surface acini are shown in Fig. 8. The mean longitudinal path length, Lp, was found to be greater in surface acini compared with central acini (448.48 ± 76.00 μm vs. 369.90 ± 60.00 μm, P = 0.01). A statistical summary of the path lengths in central and surface acini is shown through a box and whisker plot in Fig. 9. Terminal nodes in surface acini span a wider range of path lengths with the shortest paths comparable to measurements found in central acini. The distribution of branching angles was not found to vary significantly across surface and central acini.
Fig. 7.
Histogram of number of acinar branches categorized by generation number. The branch histogram follows the power law for the first 4–5 generations. Surface acini have increased number of branches, especially in generations 5–7.
Fig. 8.
Distribution of path lengths (Lp) from acinar entrance to terminal alveolar sacs in central and surface acini. The y-axis represents the percent contribution to the total longitudinal path length from each generation. The x-axis represents the distance from the entrance to the acinus in microns. Bins of 20-μm width have been used to group the measurements for a histogram representation. The mean longitudinal path Lp in surface acini is greater than in the case of central acini.
Fig. 9.
Box and whisker plot showing the minimum, first quartile, median, third quartile, and the maximum path lengths from acinar entrance to a terminal node in surface acini compared with central acini. On average, surface acini have increased path lengths, greater number of terminal nodes, and a wider range in total path length. The mean longitudinal path length is significantly increased in surface acini (*P < 0.01).
DISCUSSION
The morphometry of the conducting airways in mammalian species is well documented (5, 23, 25, 30, 31, 39, 44). Although heterogeneity in airway morphometry plays an important role in ventilation heterogeneity and gas exchange, the available experimental data are increasingly incomplete near the respiratory zone (i.e., acini), which forms the entrance to the acinus in mice.
Newer mathematical models of acinar structure incorporate the heterogeneous nature of the alveolar ducts within the acini (8–10) from available experimental data and seek to better assess the relationship between anatomical structure and respiratory function (1, 4, 25, 27, 28, 35). With these increasingly accurate models, there is a need for characterization of interacinar heterogeneity across regions of interest in the lung. Previous studies by McDonough and colleagues (13) have shown evidence for heterogeneity in alveolar density based on lung height in humans. In rats, Zeltner and coworkers (49) have demonstrated regional differences in apex vs. base and in subpleural vs. central lung regions. Haefeli-Bleuer and Weibel (4) have previously commented on the differences in acini located in the pleural regions vs. central lung regions, readily apparent in the shape of the acinus. In the present study, we have observed (see example in Fig. 4) that, on average, all central acini are isotropic and near spherical in shape, whereas surface acini have a fan-shape orientation with branches extending from the terminal bronchiole to the pleural surface. These structural differences between core and surface acini can be compared with the compact fractal nature of a cauliflower floret and the fan-like structure of a broccoli floret, respectively.
To characterize the geometry of the acinar airway tree, we used the dichotomous “generations-down” model, which characterizes the connectivity in the airway tree with a branching ratio of 2 (43, 44, 46), an essential property for modeling gas exchange in the acinus (27, 28, 35). The alternative characterization by Horsfield “orders-up” (5), designed to reduce the variance of airway dimensions in irregular dichotomy, is not helpful in this instance because it cannot represent the connectivity of the tree structure.
The estimate of the total number of acini in this study is comparable to previous estimates of acinar count (3, 42) in rats and C57Bl/6 mice, respectively. On average, we find that surface acini have increased volumes through an increase in alveolar duct diameters and total number of branches, without any significant change in segment lengths. In this study, the difference between surface and central alveolar duct diameter decreased in the more distal alveolar duct generations. Previous studies on C57Bl/6 mice (7) and rats (25) have shown similar results with the convergence of diameters at the terminal alveolar sacs across age groups. The generations furthest from the acinar entrance are comprised of alveolar sacs, and the convergence of the distal diameters of both the central and surface acinar alveolar ducts indicates that the alveolar sacs and individual alveoli have similar geometry in both surface and central acini. In addition, we observed that the alveolar sacs, which form the terminal nodes, extend further from the acinar entrance in surface acini compared with central acini, i.e., the total path length is longer in surface acini. The increased longitudinal path length in surface acini represents the greater average distance traveled by inhaled gas or particles to reach the most distal alveoli. Given the diffusive nature of gas transport within acini, this heterogeneity in acinar structure becomes important in computational modeling of gas exchange (1, 28, 35).
The surface acini have increased alveolar surface area compared with central acini. However, the surface-to-volume ratio was not significantly different between the two groups. This suggests that there is no difference in the geometry of the alveolar ducts with the corresponding alveolar sleeve.
The statistical evidence indicates that there are significant differences in acinar shape and geometry between pleural and central regions of the lung. This heterogeneity suggests that care should be taken when extrapolating the results from assessment of surface acinar and alveolar measurements to represent the whole lung, especially in applying the dynamics of pulmonary physiological processes and in the development of numerical models to represent the lung.
Conclusions.
The in vivo IIBH protocols, fixation techniques, and HRES interior tomographic imaging presented in this study, in accordance with the guidelines set up in the ATS/ERS Task Force report, allow us to perform unbiased characterization of the murine pulmonary acinus. The techniques set forth in this study allow us to perform efficient studies to evaluate and characterize the heterogeneity in acinar morphometry in normal and diseased lungs. The evidence for heterogeneity in central and surface acini has been presented and is indicative of a need for greater investigation across different anatomical regions of the lung.
GRANTS
This project was funded in part by National Institutes of Health Grants R01-HL-080285, 1-S10-RR019242-01, and 1-S10-OD018503-01 and by National Science Foundation/Major Research Instrumentation Grant 0923297 awarded for “MRI: Development of the Next-Generation Nano-CT System for ROI-Focused Scanning and Exact Interior Reconstruction.”
DISCLOSURES
Eric Hoffman is a founder and shareholder in Vida Diagnostics, a company specializing in the development of pulmonary analysis software, and he is a member of the Siemens CT advisory board. John Newell, Jr. is a paid consultant for VIDA Diagnostics.
AUTHOR CONTRIBUTIONS
A.S.K.P., D.M.V., J.D.N., G.W., E.R.W., and E.A.H. conception and design of research; A.S.K.P., D.M.V., G.W., and E.A.H. performed experiments; A.S.K.P., D.M.V., J.D.N., and E.A.H. analyzed data; A.S.K.P., D.M.V., J.D.N., E.R.W., and E.A.H. interpreted results of experiments; A.S.K.P., J.D.N., E.R.W., and E.A.H. prepared figures; A.S.K.P. drafted manuscript; A.S.K.P., D.M.V., J.D.N., G.W., E.R.W., and E.A.H. edited and revised manuscript; D.M.V., J.D.N., G.W., E.R.W., and E.A.H. approved final version of manuscript.
ACKNOWLEDGMENTS
We thank Dr. Youbing Yin for help in computing the surface area of acini. We also thank our collaborators at the Virginia Polytechnic Institute, especially Sourav Mishra and Kriti Sen Sharma for help in high-resolution imaging.
Current affiliation for Dr. Vasilescu: Department of Pathology, University of British Columbia, Vancouver, Canada.
Current affiliation for Dr. Wang: Rensselaer Polytechnic Institute, Troy, New York.
REFERENCES
- 1.Felici M, Filoche M, Straus C, Similowski T, Sapoval B. Diffusional screening in real 3D human acini—a theoretical study. Respir Physiol Neurobiol 145: 279–293, 2005. [DOI] [PubMed] [Google Scholar]
- 2.Gao Z, Vasilescu DM, Hoffman EA, Saha PK. A multi-scale topo-morphologic opening approach for segmenting the pulmonary acinus in high resolution micro-CT images of fixed murine lungs. In: B70 Fine Analysis of Alveolar/Airway Structure and Function. New York, NY: American Thoracic Society, 2010, p. A3630–A3630. [Google Scholar]
- 3.Haberthur D, Barre SF, Tschanz SA, Yao E, Stampanoni M, Schittny JC. Visualization and stereological characterization of individual rat lung acini by high-resolution X-ray tomographic microscopy. J Appl Physiol 115: 1379–1387, 2013. [DOI] [PubMed] [Google Scholar]
- 4.Haefeli-Bleuer B, Weibel ER. Morphometry of the human pulmonary acinus. Anat Rec 220: 401–414, 1988. [DOI] [PubMed] [Google Scholar]
- 5.Horsfield K. Morphometry of airways. In Handbook of Physiology. The Respiratory System. Mechanics of Breathing. Bethesda, MD: Am. Physiol. Soc; 2011, chapt. 11, p. 75–88. [Google Scholar]
- 6.Hsia CC, Hyde DM, Ochs M, Weibel ER. An official research policy statement of the American Thoracic Society/European Respiratory Society: standards for quantitative assessment of lung structure. Am J Respir Crit Care Med 181: 394–418, 2010. [DOI] [PMC free article] [PubMed] [Google Scholar]
- 7.Kizhakke Puliyakote AS, Vasilescu DM, Sen-Sharma K, Wang G, Hoffman EA. A skeleton-tree based approach to acinar morphometric analysis using micro computed tomography with comparison of acini in young and old C57Bl/6 mice. J Appl Physiol. In press. [DOI] [PMC free article] [PubMed] [Google Scholar]
- 8.Koshiyama K, Wada S. Mathematical model of a heterogeneous pulmonary acinus structure. Comput Biol Med 62: 25–32, 2015. [DOI] [PubMed] [Google Scholar]
- 9.Kumar H, Tawhai MH, Hoffman EA, Lin CL. The effects of geometry on airflow in the acinar region of the human lung. J Biomech 42: 1635–1642, 2009. [DOI] [PMC free article] [PubMed] [Google Scholar]
- 10.Kumar H, Vasilescu DM, Yin Y, Hoffman EA, Tawhai MH, Lin CL. Multiscale imaging and registration-driven model for pulmonary acinar mechanics in the mouse. J Appl Physiol 114: 971–978, 2013. [DOI] [PMC free article] [PubMed] [Google Scholar]
- 11.Lee TC, Kashyap RL, Chu CN. Building skeleton models via 3-D medial surface axis thinning algorithms. CVGIP 56: 462–478, 1994. [Google Scholar]
- 12.Lorensen WE, Cline HE. Marching cubes: A high resolution 3D surface construction algorithm. In: ACM Siggraph Computer Graphics. New York City, NY: Association for Computing Machinery, 1987, p. 163–169. [Google Scholar]
- 13.McDonough JE, Knudsen L, Wright AC, Elliott WM, Ochs M, Hogg JC. Regional differences in alveolar density in the human lung are related to lung height. J Appl Physiol 118: 1429–1434, 2015. [DOI] [PubMed] [Google Scholar]
- 14.McLaughlin RA, Noble PB, Sampson DD. Optical coherence tomography in respiratory science and medicine: from airways to alveoli. Physiology 29: 369–380, 2014. [DOI] [PubMed] [Google Scholar]
- 15.McLaughlin RA, Yang X, Quirk BC, Lorenser D, Kirk RW, Noble PB, Sampson DD. Static and dynamic imaging of alveoli using optical coherence tomography needle probes. J Appl Physiol 113: 967–974, 2012. [DOI] [PubMed] [Google Scholar]
- 16.Meissner S, Knels L, Koch E. Improved three-dimensional Fourier domain optical coherence tomography by index matching in alveolar structures. J Biomed Opt 14: 064037, 2009. [DOI] [PubMed] [Google Scholar]
- 17.Meissner S, Knels L, Schnabel C, Koch T, Koch E. Three-dimensional Fourier domain optical coherence tomography in vivo imaging of alveolar tissue in the intact thorax using the parietal pleura as a window. J Biomed Opt 15: 016030, 2010. [DOI] [PubMed] [Google Scholar]
- 18.Meißner S, Krüger A, Wendel M, Knels L, Heller A, Koch T, Koch E. Determination of alveolar geometry by optical coherence tomography to develop a numerical model of the fluid dynamics in the pulmonary acinus. In: Advances in Medical Engineering, edited by Buzug T, Holz D, Bongartz J, Kohl-Bareis M, Hartmann U, and Weber S. Berlin, Germany: Springer, 2007, p. 337–342. [Google Scholar]
- 19.Mercer RR, Crapo JD. Three-dimensional reconstruction of the rat acinus. J Appl Physiol 63: 785–794, 1987. [DOI] [PubMed] [Google Scholar]
- 20.Namati E, Thiesse J, de Ryk J, McLennan G. Alveolar dynamics during respiration. Am J Respir Cell Mol Biol 38: 572–578, 2008. [DOI] [PMC free article] [PubMed] [Google Scholar]
- 21.Parameswaran H, Bartolak-Suki E, Hamakawa H, Majumdar A, Allen PG, Suki B. Three-dimensional measurement of alveolar airspace volumes in normal and emphysematous lungs using micro-CT. J Appl Physiol 107: 583–592, 2009. [DOI] [PMC free article] [PubMed] [Google Scholar]
- 22.Phalen RF, Oldham MJ. Tracheobronchial airway structure as revealed by casting techniques 1–3. Am Rev Respir Dis 128: S1–S4, 1983. [DOI] [PubMed] [Google Scholar]
- 23.Phillips CG, Kaye SR. On the asymmetry of bifurcations in the bronchial tree. Respir Physiol 107: 85–98, 1997. [DOI] [PubMed] [Google Scholar]
- 24.Popp A, Wendel M, Knels L, Koch T, Koch E. Imaging of the three-dimensional alveolar structure and the alveolar mechanics of a ventilated and perfused isolated rabbit lung with Fourier domain optical coherence tomography. J Biomed Opt 11: 014015, 2006. [DOI] [PubMed] [Google Scholar]
- 25.Rodriguez M, Bur S, Favre A, Weibel ER. Pulmonary acinus: geometry and morphometry of the peripheral airway system in rat and rabbit. Am J Anat 180: 143–155, 1987. [DOI] [PubMed] [Google Scholar]
- 26.Saha PK, Zhiyun G, Alford SK, Sonka M, Hoffman EA. Topomorphologic separation of fused isointensity objects via multiscale opening: separating arteries and veins in 3-D pulmonary CT. IEEE Trans Med Imaging 29: 840–851, 2010. [DOI] [PMC free article] [PubMed] [Google Scholar]
- 27.Sapoval B, Filoche M, Weibel ER. Smaller is better-but not too small: A physical scale for the design of the mammalian pulmonary acinus. Proc Natl Acad Sci USA 99: 10411–10416, 2002. [DOI] [PMC free article] [PubMed] [Google Scholar]
- 28.Sapoval B, Weibel ER, Filoche M. Diffusion screening, acinus size and optimal design of mammalian lungs. In: Fractals in Biology and Medicine, edited by Losa GA, Merlini D, Nonnenmacher TF, and Weibel ER. Basel, Switzerland: Birkhäuser, 2002, p. 25–38. [Google Scholar]
- 29.Schindelin J, Arganda-Carreras I, Frise E, Kaynig V, Longair M, Pietzsch T, Preibisch S, Rueden C, Saalfeld S, Schmid B, Tinevez JY, White DJ, Hartenstein V, Eliceiri K, Tomancak P, Cardona A. Fiji: an open-source platform for biological-image analysis. Nat Methods 9: 676–682, 2012. [DOI] [PMC free article] [PubMed] [Google Scholar]
- 30.Schittny JC, Burri PH. Development and growth of the lung. Fishman Pulmon Dis Dis 1: 91–115, 2008. [Google Scholar]
- 31.Schlesinger RB, McFadden LA. Comparative morphometry of the upper bronchial tree in six mammalian species. Anat Rec 199: 99–108, 1981. [DOI] [PubMed] [Google Scholar]
- 32.Schreider JP, Raabe OG. Structure of the human respiratory acinus. Am J Anat 162: 221–232, 1981. [DOI] [PubMed] [Google Scholar]
- 33.Soutiere SE, Mitzner W. On defining total lung capacity in the mouse. J Appl Physiol 96: 1658–1664, 2004. [DOI] [PubMed] [Google Scholar]
- 34.Soutiere SE, Tankersley CG, Mitzner W. Differences in alveolar size in inbred mouse strains. Respir Physiol Neurobiol 140: 283–291, 2004. [DOI] [PubMed] [Google Scholar]
- 35.Swan AJ, Tawhai MH. Evidence for minimal oxygen heterogeneity in the healthy human pulmonary acinus. J Appl Physiol 110: 528–537, 2010. [DOI] [PMC free article] [PubMed] [Google Scholar]
- 36.Tankersley CG, Rabold R, Mitzner W. Differential lung mechanics are genetically determined in inbred murine strains. J Appl Physiol 86: 1764–1769, 1999. [DOI] [PubMed] [Google Scholar]
- 37.Taubin G. Curve and surface smoothing without shrinkage. In: Proceedings of the Fifth International Conference on Computer Vision. Washington, DC: IEEE Computer Society, 1995, p. 852. [Google Scholar]
- 38.Thiesse J, Namati E, Sieren J, Smith A, Reinhardt J, Hoffman E, McLennan G. Lung structure phenotype variation in inbred mouse strains revealed through in vivo micro-CT imaging. J Appl Physiol 109: 1960–1968, 2010. [DOI] [PMC free article] [PubMed] [Google Scholar]
- 39.Tschirren J, Hoffman EA, McLennan G, Sonka M. Intrathoracic airway trees: segmentation and airway morphology analysis from low-dose CT scans. IEEE Trans Med Imaging 24: 1529–1539, 2005. [DOI] [PMC free article] [PubMed] [Google Scholar]
- 40.Vasilescu DM, Gao Z, Saha PK, Yin L, Wang G, Haefeli-Bleuer B, Ochs M, Weibel ER, Hoffman EA. Assessment of morphometry of pulmonary acini in mouse lungs by nondestructive imaging using multiscale microcomputed tomography. Proc Natl Acad Sci USA 109: 17105–17110, 2012. [DOI] [PMC free article] [PubMed] [Google Scholar]
- 41.Vasilescu DM, Klinge C, Knudsen L, Yin L, Wang G, Weibel ER, Ochs M, Hoffman EA. Stereological assessment of mouse lung parenchyma via nondestructive, multiscale micro-CT imaging validated by light microscopic histology. J Appl Physiol 114: 716–724, 2013. [DOI] [PMC free article] [PubMed] [Google Scholar]
- 42.Vasilescu DM, Knudsen K, Ochs M, Weibel ER, Hoffman EA. Optimized murine lung preparation for detailed structural evaluation via micro-computed tomography. J Appl Physiol 112: 159–166, 2012. [DOI] [PMC free article] [PubMed] [Google Scholar]
- 43.Weibel ER. Morphometry of the Human Lung. New York, NY: Academic Press, 1963. [Google Scholar]
- 44.Weibel ER, Gomez DM. Architecture of the human lung. Use of quantitative methods establishes fundamental relations between size and number of lung structures. Science 137: 577–585, 1962. [DOI] [PubMed] [Google Scholar]
- 45.Weibel ER, Hsia CC, Ochs M. How much is there really? Why stereology is essential in lung morphometry. J Appl Physiol 102: 459–467, 2007. [DOI] [PubMed] [Google Scholar]
- 46.Weibel ER, Sapoval B, Filoche M. Design of peripheral airways for efficient gas exchange. Respir Physiol Neurobiol 148: 3–21, 2005. [DOI] [PubMed] [Google Scholar]
- 47.Wulfsohn D, Knust J, Ochs M, Nyengaard J, Gundersen H. Stereological estimation of the total number of ventilatory units in mice lungs. J Microsc 238: 75–89, 2010. [DOI] [PubMed] [Google Scholar]
- 48.Yushkevich PA, Piven J, Hazlett HC, Smith RG, Ho S, Gee JC, Gerig G. User-guided 3D active contour segmentation of anatomical structures: significantly improved efficiency and reliability. NeuroImage 31: 1116–1128, 2006. [DOI] [PubMed] [Google Scholar]
- 49.Zeltner TB, Bertacchini M, Messerli A, Burri PH. Morphometric estimation of regional differences in the rat lung. Exp Lung Res 16: 145–158, 1990. [DOI] [PubMed] [Google Scholar]


