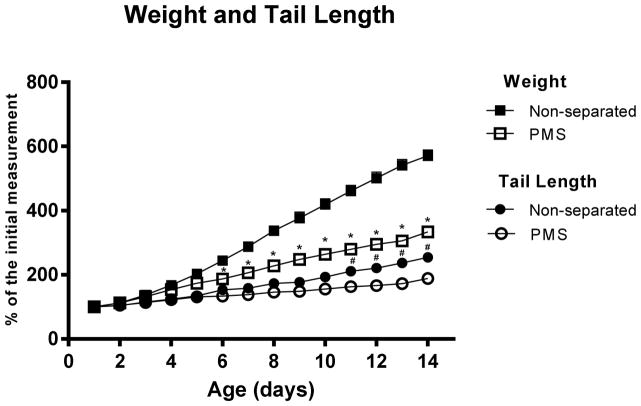
Fig. 1.
Relative weight and tail length gain from experimental mice during timed-prolonged maternal separation (PMS) (N=16) and respective non-separated controls (N=10). Curves are presented as percentage of initial weight at post-natal day 1. Results are expressed in mean ± SEM and were analyzed by unpaired Student t test. * P <0.05 vs non-separated controls.
Results are expressed in mean ± SEM and were analyzed by unpaired Student t test. * P <0.05 vs non-separated controls.

