

Abstract
Introduction
Computed tomography (CT) plays a central role in lung cancer diagnosis. However, CT has relatively low specificity, presenting a challenge in clinical settings. We previously identified 12 microRNAs (miRNAs) whose expressions in tumor tissues were associated with lung cancer.
Methods
Using quantitative reverse transcriptase polymerase chain reaction, we aimed to identify miRNA biomarkers in sputum that could complement CT for diagnosis of lung cancer.
Results
In a training set consisting of 66 lung cancer patients and 68 cancer-free smokers, 10 of the 12 miRNAs were differentially expressed between the cases and controls (p ≤ 0.01). From the miRNAs, a logistic regression model was built on the basis of miR-31 and miR-210, both of which had the best prediction for lung cancer, producing an area under receiver operating characteristic curve of 0.83. Combined use of the two miRNAs yielded 65.2% sensitivity and 89.7% specificity, CT had 93.9% sensitivity and 83.8% specificity for lung cancer diagnosis. Notably, combined analysis of the miRNA biomarkers and CT produced a higher specificity than does CT used alone (91.2% versus 83.8%; p < 0.05). The diagnostic performance of the biomarkers was confirmed in a testing set comprising 64 lung cancer patients and 73 cancer-free smokers.
Conclusion
The sputum miRNA biomarkers might be useful in improving CT for diagnosis of lung cancer, but further independent validation on an external and prospective cohort of patients is required.
Keywords: Lung cancer, MicroRNAs, Sputum, Computed tomography, Diagnosis
Lung cancer is the second most common cancer and the number one cancer killer in the United States and world-wide.1 Lung cancer is classified into non–small-cell lung cancer (NSCLC) and small-cell lung carcinoma (SCLC).2 NSCLC accounts for approximately 80%, whereas SCLC comprises about 20% of all lung cancers. NSCLC is further divided into two main subtypes: adenocarcinoma (AC) and squamouscell carcinoma (SCC).3,4 The 5-year survival rate for stage IV NSCLC is only 10%, whereas it is approximately 80% for stage IA NSCLC.5 Furthermore, the median survival of limited-stage SCLC with treatment is 18 to 24 months. The median survival of extensive-stage SCLC is 6 to 12 months with treatment, and only 2 to 4 months without treatment.6 These statistics provide the primary rationale to improve the early detection of lung cancer.5,7 Chest radiograph has been used for early detection of lung cancer, yet the sensitivity is low.5 A National Cancer Institute–National Lung Screening Trail recently found 20% fewer lung cancer deaths in smokers among those who were screened with computed tomography (CT) compared with those who were screened with chest radiograph.8 Therefore, American Cancer Society recently recommends low-dose CT screening for lung cancer for individuals who are 55 to 74 years old, have at least a 30-pack-year smoking history, and currently smokes or have quit within the past 15 years. However, the results of National Lung Screening Trail show that CT screening has only 61% specificity for lung cancer diagnosis.8 The low specificity often results in anxiety, unnecessary biopsies, and surgeries that carry their own risks to many smokers who have benign diseases. There is, therefore, an urgent need to develop noninvasive and cost-effective approaches that can augment CT, particularly increase its specificity, for diagnosis of lung cancer.
Sputum is one of the most easily and noninvasively accessible body fluids.9–11 Sputum contains airway epithelial cells. Analysis of sputum can indicate the specific source of the abnormal airway epithelial cells in the lungs, thus providing an organ-specific approach for lung cancer diagnosis. Cytological analysis of sputum has been used for diagnosis of lung cancer.11 Yet the sensitivity is low.11 Molecular study of sputum has been used to identify neoplastic cells from lung cancer patients.12 For example, P16 hypermethylation was found in sputum collected from patients with lung cancer 5 to 35 months before cytological and clinical diagnoses of NSCLC.13,14 The assessment of chromosomal aneusomy in exfoliated cells of sputum could help diagnose lung cancer with 76% sensitivity and 88% specificity.15,16 We have previously shown that a panel of sputum-based DNA probes has a higher sensitivity for diagnosis of NSCLC patients than does conventional sputum cytology.17,18
MicroRNAs (miRNAs) are a class of naturally occurring, small noncoding RNA molecules, about 21 to 25 nucleotides in length.19,20 The small molecules play important functions in diverse biological processes, including cell proliferation, differentiation, and apoptosis.19–21 miRNAs can transcriptionally regulate expressions of more than 30% of human protein-coding genes.19,20 Furthermore, some miRNAs act as oncogenes or tumor suppressors in tumorigenesis,22 and dysfunction of the miRNAs contributes to the development and progression of human malignancies, including lung cancer.22 For instance, we showed that miR-486-5p acted as a tumor suppressor in the progression and metastasis of lung cancer.23 Analyzing miRNAs in clinical specimens might provide a potential assay for diagnosis of lung cancer.21 Previously, we found that endogenous miRNAs were stably present in sputum and robustly measurable by using quantitative reverse transcription–polymerase chain reaction (qRT-PCR).24 Using a TaqMan-based miRNA array to profile 377 human mature miRNAs in 20 lung AC tissues and the matched normal lung tissues, we identified seven miRNAs that statistically differently expressed between the paired tumor and normal samples.25 These included four miRNAs (miR-21, miR-182, miR-31, and miR-200b) that were overexpressed and three miRNAs (miR-486, miR-126, and miR-375) that were underexpressed in tumor specimens.25 Furthermore, using GeneChipR miRNA Arrays to profile expression signatures of 818 human mature miRNAs on 15 lung SCC tissues and the paired normal lung tissues, we identified six miRNAs that were statistically differently expressed between the paired tumor and normal samples (all p < 0.01).26 These included three miRNAs (miR-205, miR-210, and miR-708) that were overexpressed, and three miRNAs (miR-126, miR-139, and miR-429) that were underexpressed in tumor specimens. In total, our studies25,26 identified 12 miRNA signatures (miRs-21, 31, 126, 139, 182, 200b, 205, 210, 375, 429, 486, and 708) whose aberrant expressions were associated with NSCLC. We further showed that analysis of four miRNAs (miR-21, miR-486, miR-375, and miR-200b) and three miRNAs (miR-205, miR-210, and miR-708) in sputum could diagnose lung AC and SCC, respectively, with higher sensitivities than sputum cytology could.25,26
On the basis of our previous studies,24–26 the objective of the present study was to determine whether analysis of the miRNA signatures could improve regular CT scan for diagnosis of lung cancer. From the 12 miRNAs, a panel of two miRNAs was identified, which could diagnose lung cancer covering major histological types with 65.2% sensitivity and 89.7% specificity. Importantly, combined use of the miRNA biomarkers and CT provided a higher specificity than did CT used alone for lung cancer diagnosis.
PATIENTS AND METHODS
Patients and Sputum Samples
The study protocol was approved by the Institutional Review Boards of the University of Maryland Medical Center and Baltimore VA Medical Center. Sixty-six lung cancer patients and 68 cancer-free smokers were recruited from the University of Maryland Medical Center for a training set (Table 1), whereas 64 lung cancer patients and 73 cancer-free control smokers from Baltimore VA Medical Center were enrolled for a testing set (Table 2). The sputum samples were collected before the patients received surgical treatment, pre-operative adjuvant chemotherapy and radiotherapy as previously described.24–26 In brief, subjects used water or saline to gently brush tongue, buccal surfaces, teeth, and gingival to remove superficial epithelial cells and bacteria, followed by gargling and rinsing with tap water. They were asked to spontaneously cough sputum as previously described.18,27–29 If this was unsuccessful, participants underwent sputum induction. A variation of the ultrasonic nebulization technique described by Saccomanno9,10 was used for sputum induction. Participants inhaled a nebulized 3% saline solution from an ultrasonic nebulizer for 20 minutes. Sputum was collected in a sterile specimen cup and centrifuged at 1000 g for 15 minutes. Cytospin slides were prepared from each sample and Papanicolaou staining was performed on these to evaluate whether sputum was representative of deep bronchial cells. To ensure the quality of the sputum, the spontaneous or induced sputum samples that had less than 4% oral squamous cells were considered to be adequate for the present study. The cell pellet from each sample was then resuspended in Sputolysin (Calbiochem, San Diego, CA) for 15 minutes at 37°C. The cell pellet was washed again and stored at −80°C for molecular analysis. Presence of solitary pulmonary nodules (SPNs) in the cases and controls was determined based on chest CT scan. Final diagnosis for lung cancer was made with histopathologic examinations of specimens obtained by CT-guided transthoracic needle biopsy, transbronchial biopsy, videotape-assisted thoracoscopic surgery, or surgical resection. The surgical pathologic staging was determined according to the tumor, node, metastasis (TNM) classification of the International Union Against Cancer with the American Joint Committee on Cancer and the International Staging System for Lung Cancer. Histopathological classification was determined according to the World Health Organization classification. The cancer-free smokers had no cancer diagnoses in the last 3 years.
TABLE 1.
Demographic and Clinical Data of Lung Cancer Patients and Cancer-Free Controls in a Training Set
| Parameter | Lung Cancer Patients | % | Cancer-Free Controls | % |
|---|---|---|---|---|
| Total No. | 66 | 68 | ||
| Age, yr, median (SD) | 64 (7) | 67 (5) | ||
| Sex | ||||
| Men | 37 | 56.1 | 43 | 63.2 |
| Women | 29 | 43.9 | 25 | 36.8 |
| Race | ||||
| White American | 38 | 57.6 | 48 | 70.6 |
| African American | 28 | 42.4 | 20 | 29.4 |
| Smoking, pack-years (SD) | 53 (19) | 49 (15) | ||
| Nodule size (cm), median (SD) | 2.6 (1.1) | 1.1 (0.7) | ||
| Histology | ||||
| Adenocarcinoma | 27 | 40.9 | ||
| Squamous-cell carcinoma | 26 | 39.4 | ||
| Small-cell carcinoma | 13 | 19.7 | ||
| Stage of 53 NSCLC | ||||
| I | 17 | 32.1 | ||
| II | 18 | 34.0 | ||
| III–IV | 18 | 33.9 |
NSCLC, non–small-cell lung cancer.
TABLE 2.
Demographic and Clinical Data of Lung Cancer Patients and Cancer-Free Controls in a Testing Set
| Parameter | Lung Cancer Patients | % | Cancer-Free Controls | % |
|---|---|---|---|---|
| Total No. | 64 | 73 | ||
| Age, yr (SD) | 66 (9) | 64 (8) | ||
| Sex | ||||
| Men | 41 | 64.1 | 48 | 65.8 |
| Women | 23 | 35.9 | 25 | 34.2 |
| Race | ||||
| White American | 39 | 60.9 | 43 | 58.9 |
| African American | 25 | 39.1 | 30 | 41.1 |
| Smoking, pack-years (SD) | 55 (16) | 50 (17) | ||
| Nodule size (cm), median (SD) | 2.7 (1.2) | 1.2 (0.6) | ||
| Histology | ||||
| Adenocarcinoma | 30 | 46.8 | ||
| Squamous-cell carcinoma | 28 | 43.8 | ||
| Small-cell carcinoma | 6 | 9.4 | ||
| Stage of 58 NSCLC | ||||
| I | 19 | 32.8 | ||
| II | 19 | 32.8 | ||
| III–IV | 20 | 34.4 |
NSCLC, non–small-cell lung cancer.
RNA Isolation and Expression Analysis of miRNAs by qRT-PCR
Total RNA containing small RNA was extracted from cell pellets of the sputum specimens as previously described.24–26,30 The purity and concentration of RNA were determined from OD260/280 readings by using a dual-beam Ultraviolet (UV) spectrophotometer (Eppendorf AG, Hamburg, Germany). RNA integrity was determined by capillary electrophoresis by using the RNA 6000 Nano Lab-on-a-Chip kit and the Bioanalyzer 2100 (Agilent Technologies, Santa Clara, CA). Twelve miRNAs (miRs-21, 31, 126, 139, 182, 200b, 205, 210, 375, 429, 486, and 708) were evaluated in sputum by using qRT-PCR with Taqman miRNA assays (Applied Biosystems, Foster City, CA) as previously described.24–26 Briefly, RNA was applied for reverse transcription (RT) by using the Applied Biosystems 9700 Thermocycler (Applied Biosystems) with miRNA-specific looped primer and TaqMan MicroRNA RT Kit (Applied Biosystems), according to the manufacturer’s instructions. The reaction includes 50 nM stem-loop RT primer, ×1 RT buffer, 0.25 mM each of deoxyrinonucleotides, and 3.33 U/μl MultiScribe reverse transcriptase in a total volume of 15 μl. The 20 μl PCR reaction included RT product, ×1 TaqMan Universal PCR Master Mix (Applied Biosystems), and the corresponding primers and Taqman probe for the target genes. The reactions were incubated in a 94-well plate at 95°C for 15 minutes, followed by 45 cycles of 95°C for 15 seconds and 60°C for 1 minute. Threshold cycle (Ct) values of the miRNAs were normalized in relation to that of U6. All assays were performed in triplicates, and one no-template control and two interplate controls were carried along in each experiment.
CT Diagnosis
Regular CT imaging was performed as part of clinical standard care using a protocol with a 120-KV, 220-mA tomoscan (model Somatom Plus 4; Seimens, Munich, Germany). In brief, images were taken from the lung apices to the top of the kidneys at a speed of 1.0 seconds per rotation in helical motion. The slice thickness was 5 mm through the mediastinum (from the top of the aorta caudal to 2 cm below the bifurcation of the main stem bronchus) and 8 mm elsewhere. One hundred milliliters of Optiray 240 (St. Louis, MO) was administered as the intravenous contrast agent at 1.5 ml per second. The images were reconstructed by using the Kernal protocols of AB50 for the mediastinum and AB82 Lo for the lung windows. The CT images were read independently by two of five board-certified radiologists who were blinded to molecular analysis. The two radiologists’ findings were recorded and then discussed, and the consensus findings were documented for study purposes. When the two readers could not reach a consensus, the case was presented to another reader among the five, and the adjudicated reading became the final one. The diameter of a nodule, as a measure of its size, was defined as the average of its length and width measured with electronic calipers on the image that showed the largest cross-sectional area of the nodule. A positive result of initial CT was defined as previously described.31,32
Statistical Analysis
Pearson’s correlation coefficient tests with multivariate regression analysis were carried out to evaluate the associations between expressions of miRNAs and clinicopathologic and demographic characteristics of the participants. To determine the diagnostic performances of the miRNAs, receiver operating characteristics (ROC) curves were constructed by using expression levels for each miRNA in cancer patients and cancer-free controls.33 The cutoff value was chosen at the point of highest Youden index for each miRNA from the ROC in the training set. Furthermore, ROC plots were analyzed and areas under the curve (AUCs) were calculated. A logistic regression model with constrained parameters as in least absolute shrinkage and selection operator was used to define an optimal panel of miRNAs that could differentiate lung cancer patients from controls with the highest sensitivity and specificity.34 To compare the sensitivities and specificities of the panel of miRNAs and CT scan used alone, the combination of the miRNAs and CT, differences between AUC values of each approach were compared as described by Hanley and McNeil.35 All p values shown were two sided, and a p value less than 0.05 was considered statistically significant.
RESULTS
Demographic and Clinical Characteristics of the Subjects
Of the 66 lung cancer patients in the training set, 13 patients had SCLC and 53 patients had NSCLC (Table 1). Of the 53 NSCLC cases, there were 17 NSCLC patients at stage I, 18 at stage II, and 18 at stage III–IV. There were 27 NSCLC patients with AC and 26 with SCC. The mean age of the lung cancer cases was 64 years and 37 were men. There were 38 white and 28 African American patients diagnosed with lung cancer. The mean number of smoking pack-years of the lung cancer cases was 53. The 68 cancer-free subjects included 39 with chronic obstructive pulmonary disease (COPD), 16 with pneumonia, seven with sarcoidosis, and four with inflammatory granuloma. The cancer-free subjects comprised 43 men. There were 48 whites and 20 African Americans. The mean age of the control subjects was 67 years. The mean number of smoking pack-years of the control subjects was 49. The mean size of SPNs in lung cancer patients and cancer-free smokers was 2.6 and 1.1 cm in diameter, respectively. In the testing set, six patients had SCLC and 58 had NSCLC. There were 19 NSCLC patients at stage I, 19 at stage II, and 20 at stage III–IV. There were 30 NSCLC patients with AC and 28 with SCC. The mean age of the lung cancer cases was 66 years and 41 are men. There were 39 white and 25 African American patients diagnosed with lung cancer. The mean number of smoking pack-years of the lung cancer cases was 55. The 73 cancer-free subjects comprised 40 with COPD, 18 with pneumonia, eight with sarcoidosis, and seven with inflammatory granuloma. The cancer-free smokers comprised 48 men. There were 43 white and 30 African Americans. The mean age of the control subjects was 64 years. The mean number of smoking pack-years of the control subjects was 50. The mean size of SPNs in lung cancer patients and cancer-free smokers was 2.7 and 1.2 cm in diameter, respectively.
Expressions of the miRNAs in Sputum and the Correlations with Clinicopathological Characteristics
The 12 miRNAs were successfully tested in the sputum specimens of cases and controls by using qRT-PCR analysis with 32 Ct values or less. In the training set, 10 of the 12 miRNAs (miRs-21, 31, 126, 182, 200b, 205, 210, 375, 486, and 708) displayed statistically different expression levels between cancer patients and controls by using Pearson’s correlation coefficient test (all p < 0.01). miRs-21, 31, 182, 200b, 205, 210, and 708 exhibited higher expression levels, whereas 126, 375, and 486 displayed lower levels in sputum of lung cancer patients compared with the levels in cancer-free subjects (all p < 0.01) (Supplementary Table 1, Supplemental Digital Content 1, http://links.lww.com/JTO/A493). The expressions of the 10 miRNAs in sputum were related to the size of SPNs (all p < 0.01). The expression levels of miR-31 and miR-486-5p in sputum were positively associated with smoking history of lung cancer patients (p = 0.04 and p < 0.01, respectively). The expressions of miRs-21, 200b, 375, and 486 in sputum were more closely associated with AC (all p < 0.05), whereas miRs-205, 210, and 708 were related to SCC (All p < 0.05). There was no correlation of the changes of all the miRNAs with age, ethnicity, and lung tumor stage (All p > 0.05).
Optimizing a Panel of Sputum miRNA Biomarkers for Diagnosis of Lung Cancer
We used ROC curve analysis to evaluate capacity of each miRNA for discriminating lung cancer patients from controls in the training set. The individual miRNAs exhibited area under the ROC curve (AUC) values of 0.61 to 0.79 in distinguishing cancer cases from control subjects (Supplementary Table 1, Supplemental Digital Content 1, http://links.lww.com/JTO/A493). Consequently, they yielded 53.1% to 76.0% sensitivities and 55.9% to 71.4% specificities for diagnosis of lung cancer (Supplementary Table 1, Supplemental Digital Content 1, http://links.lww.com/JTO/A493). To optimize a panel of miRNA biomarkers for lung cancer with high accuracy, we used logistic regression models with constrained parameters as in least absolute shrinkage and selection operator to analyze the miRNAs. From the 10 miRNAs, miR-31 and miR-210 were selected as the best biomarkers (all p < 0.01). Combined use of the two miRNAs produced 0.83 AUC (Fig. 1), offering superior performance compared with any of the 10 miRNAs used alone (all p < 0.01). Furthermore, using all the 10 miRNAs together did not produce improvement of AUC value over the panel of the two miRNAs (all p > 0.05). The cutoff value for each of the two miRNAs was selected at the point of the highest Youden index. The use of the two miRNAs in combination generated 65.2% sensitivity and 89.7% specificity for lung cancer diagnosis. The maximum sensitivity for combined use of the two miRNA markers was 87.5% and the associated specificity was 59.6%. The two miRNAs did not exhibit statistical differences of sensitivity and specificity between stages and histologic subtypes of lung tumors (p > 0.05). Therefore, miR-31 and miR-210 used together might hold promise for diagnosis of the major types of lung cancer.
FIGURE 1.
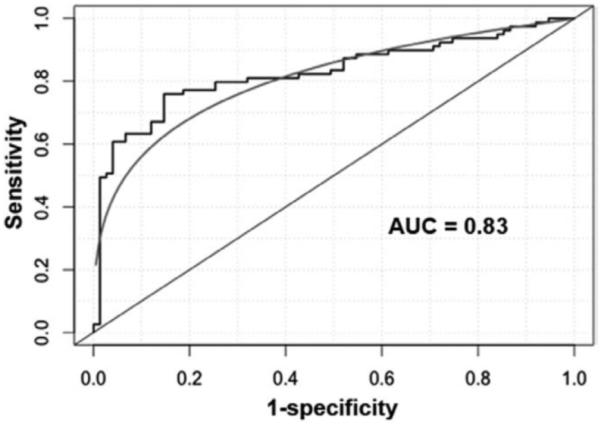
miR-31 and miR-210 are identified as potential sputum biomarkers for diagnosis of lung cancer. Logistic regression models with constrained parameters as in least absolute shrinkage and selection operator based on area under ROC (AUC) are applied to optimize a small panel of miRNAs with high sensitivity and specificity from 10 miRNA candidates in a training set of 66 lung cancer patients and 68 cancer-free smokers. Combined use of miR-31 and miR-210 produces an AUC of 0.83. ROC, receiver operating characteristics; AUC, area under the curve.
Comparison and Synergetic Value of the Sputum miRNA Biomarkers and CT for Lung Cancer Diagnosis
The initially regular CT scan identified 62 of the 66 lung cancer cases in the training set, and classified 11 of the 68 cancer-free subjects as lung cancer patients, yielding 93.9% sensitivity and 83.8% specificity for diagnosis of lung cancer. Therefore, CT had a lower specificity, whereas a higher sensitivity than did the panel of the two miRNA biomarkers for lung cancer diagnosis (83.8% versus 89.7%; 93.9% versus 65.2%, respectively; all p < 0.05).
To determine whether the panel of the miRNAs could improve CT, we incorporated the analysis of the miRNAs with CT diagnosis by using a logistic model. As displayed in Figure 3, combined use of the miRNA biomarkers and CT generated 0.95 AUC (Fig. 2A), which was significantly higher than that (0.83) of combined use of miR-31 and miR-210 (p < 0.05). Integrated analysis of the miRNAs and CT imaging had synergetic consequence. Subsequently, the combined strategy provided a considerably higher specificity (91.2% versus 83.8%; p < 0.05) and a similar sensitivity compared with CT (92.4% versus 93.9%; p > 0.05) (Fig. 2B). Therefore, integrated use of the miRNAs and CT scan would present a higher specificity compared with CT used alone, without significantly reducing its sensitivity for lung cancer diagnosis. Interestingly, the inclusion of pack-years of smoking history into this combined model further elevated the AUC from 0.95 to 0.97 (Fig. 3). Accordingly, a combined model with regular CT, smoking pack-years, and the miRNA biomarkers produced a higher specificity (95.6%) compared with CT imaging (83.8%), maintaining a similar sensitivity (95.5% versus 93.9%; p > 0.05) for lung cancer diagnosis. Therefore, the sputum-based biomarkers might potentially be useful in increasing specificity of CT scan for lung cancer diagnosis among smokers.
FIGURE 3.
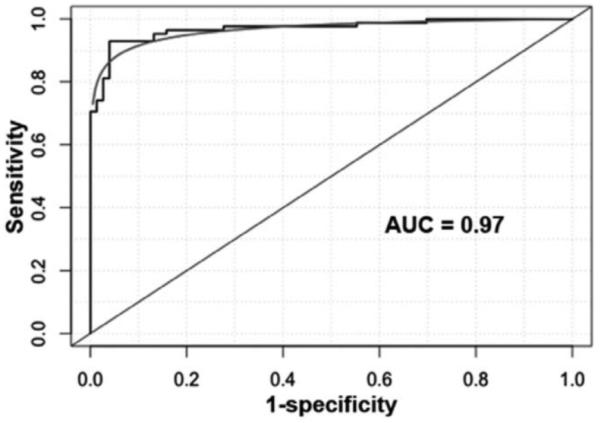
The inclusion of smoking factor into the combined model of the miRNAs and CT improves the performance of the model for lung cancer diagnosis in the training set of cases and controls. The addition of smoking pack-years to the miRNA biomarkers and CT has a high AUC value (0.97) compared with combined analysis of miRNAs and CT imaging for lung cancer diagnosis (0.95, p < 0.05). miRNAs, microRNAs; CT, computed tomography; AUC, area under the curve.
FIGURE 2.

The panel of the two miRNAs (miR-31 and miR-210) improves the specificity of CT scan for lung cancer diagnosis in the training set of 66 cases and 68 cancer-free smokers. A, The incorporation of the two miRNAs with regular CT imaging creates 0.95 AUC, which is considerably higher than that (0.83) of the use of miR-31 and miR-210 in combination (p < 0.05). B, Combined use of miRs-31 and 210 can result in 65.2% sensitivity and 89.7% specificity. Initial CT scan produces 93.9% sensitivity and 83.8% specificity. CT has a lower specificity and a higher sensitivity compared with the panel of the sputum miRNA biomarkers (all p < 0.05). Integrating the miRNAs and CT imaging yields a higher specificity than does CT scan used alone (91.2% versus 83.8%; p < 0.05). miRNAs, microRNAs; CT, computed tomography; AUC, area under the curve.
Validating the Diagnostic Performance of the Biomarker in the Testing Set of Specimens
To validate the panel of miRNA biomarkers for diagnosis of lung cancer, miR-31 and miR-210 were assessed on sputum of additional 64 stage I NSCLC patients and 73 cancer-free smokers. In this testing set, miR-31 and miR-210 displayed higher expression levels in sputum of lung cancer patients compared with cancer-free smokers (all p < 0.01). The individual miRNAs exhibited AUC values of 0.79 and 0.77, respectively, in distinguishing cancer cases from control subjects (Supplementary Table 2, Supplemental Digital Content 1, http://links.lww.com/JTO/A493). The expressions of the two miRNAs in sputum were positively related with smoking history and the size of SPNs of participants (all p < 0.01). There was no correlation of the changes of the two miRNAs with age, ethnicity, lung tumor stage, and histological types (all p > 0.05). Furthermore, the miRNAs used together differentiated lung cancer patients from the controls with 64.1% sensitivity and 89.2% specificity (Fig. 4) in the testing set, which were consistent with the parameters of the two miRNAs in the training set (65.2% sensitivity and 89.7% specificity). The observation might demonstrate the repeatability of the potential sputum biomarkers for lung cancer. In addition, in the testing set of specimens, regular CT scan had 93.8% sensitivity and 83.6% specificity. Therefore, the miRNA biomarkers generated a higher specificity, whereas it showed a lower sensitivity compared with CT scan for lung cancer diagnosis (89.2% versus 83.6%; 64.1% versus 93.8%, respectively, all p < 0.05) (Fig. 4). Importantly, the incorporation of the miRNA biomarkers with CT diagnosis produced a significantly higher specificity (91.8% versus 83.6%; p < 0.05), and a similar sensitivity compared with CT (92.2% versus 93.8%; p > 0.05) (Fig. 4). Taken together, the results created from the testing set confirmed the robustness of analysis of the sputum miRNAs, which could potentially augment CT’s specificity for lung cancer diagnosis.
FIGURE 4.
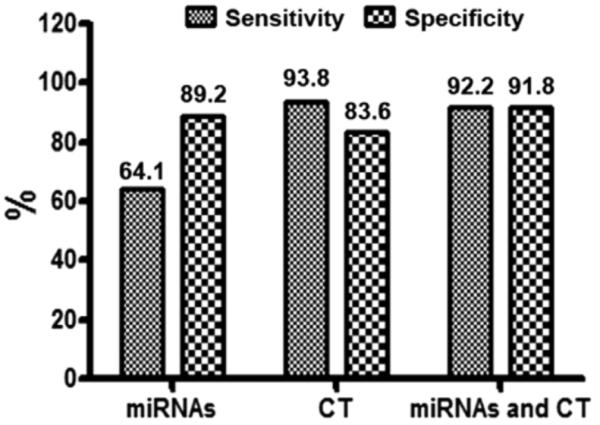
The validation of the two miRNAs (miR-31 and miR-210) in a testing set of 64 lung cancer cases and 73 cancer-free smokers confirms their performance in improving the specificity of CT scan for lung cancer diagnosis. Combined use of miR-31 and miR-210 could create 64.1% sensitivity and 89.2% specificity in the testing set. Regular CT scan produces 93.8% sensitivity and 83.6% specificity. CT has a lower specificity and a higher sensitivity compared with the panel of the miRNA biomarkers (all p < 0.05). Combined analysis of the miRNAs and CT imaging has a higher specificity than does CT scan used alone (91.8% versus 83.6%; p < 0.05). miRNAs, microRNAs; CT, computed tomography.
DISCUSSION
The major challenge for the use of CT in clinical settings for lung cancer diagnosis is the lack of specificity commonly seen when it is applied to a population of heavy smokers. Our present research shows that a panel of miRNA might address the insufficiencies of CT, because the analysis of the miRNAs in sputum could increase CT’s specificity. Furthermore, the observation in the heterogeneous lung cancer cases indicates the potential of using the miRNAs for diagnosis of major subtypes of lung cancer, including AC, SCC, and SCLC. In addition, the miRNAs do not display difference between early and advanced stages of lung tumors. Moreover, the combined strategy of the miRNA biomarkers and CT not only overcomes the limitation of the radiological imaging that often produces a low specificity for lung cancer, but also surmounts the major obstacle of sputum-based biomarkers, by which, it is difficult to localize tumor masses in the lungs. Interestingly, the inclusion of smoking status into the combined model of the biomarkers and CT scan could dramatically increase the specificity of CT, while keeping a similar sensitivity. Therefore, the sputum-based miRNA biomarkers might potentially be useful in improving CT for diagnosis of lung cancer.
From our previously identified 12 lung tumor–associated miRNAs18,24–26 we previously showed that analysis of four miRNAs (miR-21, miR-486, miR-375, and miR-200b) could potentially be useful for diagnosis of AC, and three miRNAs (miR-205, miR-210, and miR-708) in sputum might be valuable to diagnose lung SCC.25,26 These previous observations are confirmed in the current study, because the expressions of miR-21, miR-486, miR-375, and miR-200b are more closely associated with AC, whereas the expression of miR-205, miR-210, and miR-708 are more related to SCC. Furthermore, the results of the present study support our efforts in the development of noninvasive biomarkers for lung cancer, as it optimizes a panel of two miRNA biomarkers (miR-31 and miR-210) that can augment CT scan for lung cancer, regardless of the different types. In addition, the repeatability of analysis of the biomarkers could be demonstrated by the fact that miRNAs display a similar sensitivity and specificity for diagnosis of lung cancer between training and testing sets. Therefore, the present study extends our previous work by further developing potential biomarkers that might diagnose major histological types of lung cancer. Given the heterogeneity of lung tumors, the panel of the two miRNA biomarkers would be more practically useful for diagnosing lung cancer, as compared with the ones25,26 that are only applied to a single type of lung cancer.
The two miRNAs (miR-31 and miR-210) that make up the potential biomarkers were suggested as being involved in tumorigenesis.36,37 Previously, miR-210 was found to regulate the hypoxic response of tumor cells.38–40 Its overexpression was detected in a variety of solid tumors.38,41,42 Furthermore, miR-210 overexpression associated with advanced stages of breast and oral cancers.43,44 Increased miR-210 expression could mediate mitochondrial changes associated with modulation of activity in lung cancer.45 In addition, analysis of miR-210 expressions in serum could diagnose diffuse large B-cell lymphoma and pancreatic cancer.46,47 We recently showed that miR-210 was one of the miRNAs that could be measured in plasma for diagnosis of NSCLC.48 miR-31 might have a tissue-specific malignant role, because it has restricted expression patterns in carcinoma cells originating from different tissues.34 A low expression level of miR-31 was found in primary breast tumors and inversely associated with the distant metastases.49 Up-regulation of miR-31 was observed in colorectal50 and head-and-neck tumors.51 Although the detail mechanism underlying miR-31 dysregulation in tumorigenesis remains to be investigated, studying miR-31 expression in serum could be a potential approach for diagnosis of esophageal SCC.52
Sputum samples of some control subjects in the training and testing sets had altered miRNA expressions, which may be considered false positives. Intriguingly, all these cancerfree subjects were either COPD patients or individuals having more than 45 pack-year history of cigarette smoking. The data suggested that these lung cancer-related aberrant miRNA expressions might reflect chronic exposure to tobacco carcinogens and chronic inflammatory conditions, such as COPD. Indeed, it is well known that smoking causes lung cancer and a fivefold increased risk of lung cancer among COPD patients.53–56 The abnormal miRNA expressions in sputum of the controls may be considered early events in the initiation of lung cancer, considering that the expressions of the miRNAs are associated with smoking history. Nevertheless, extensive follow-up of the control subjects is needed to evaluate the possibility. Furthermore, our long-term goal is to develop a diagnostic assay that could improve CT to screen smokers for lung cancer. As a first step, this current study is to use a retrospective cohort to develop potential biomarkers for lung cancer. To finally achieve our long-term goal, we are performing a prospective study to evaluate the prediction performance of the biomarkers in asymptomatic heavy smokers for early detection of lung cancer.
In conclusion, we identified a panel of miRNAs in sputum that might be potential biomarkers for lung cancer, covering major histological types. The sputum-based biomarkers could augment CT scan, and particularly improve its specificity for diagnosis of lung cancer in smokers. We are under-taking a large population study to extensively and vigorously evaluate the usefulness of the biomarkers for the early detection of lung cancer in smokers, which is crucial to translate the newly discovered biomarkers to clinical settings.57 If successful, the future use of sputum-based miRNA biomarkers with radiological imaging would improve the ability to detect lung cancer in smokers at its early stage where therapeutic interventions have a curative potential.
Supplementary Material
ACKNOWLEDGMENTS
This work was supported in part by NCI R01CA161837, VA merit Award I01 CX000512, LUNGevity Foundation Early Detection Award, and University of Maryland Cancer Epidemiology Alliance Seed Grant (F.J.).
Footnotes
Disclosure: The authors declare no conflict of interest.
REFERENCES
- 1.Siegel R, Naishadham D, Jemal A. Cancer statistics, 2013. CA Cancer J Clin. 2013;63:11–30. doi: 10.3322/caac.21166. [DOI] [PubMed] [Google Scholar]
- 2.Travis WD, Brambilla E, Noguchi M, et al. American Thoracic Society. International Association for the Study of Lung Cancer/American Thoracic Society/European Respiratory Society: international multidisciplinary classification of lung adenocarcinoma: executive summary. Proc Am Thorac Soc. 2011;8:381–385. doi: 10.1513/pats.201107-042ST. [DOI] [PubMed] [Google Scholar]
- 3.Jemal A, Tiwari RC, Murray T, et al. Cancer statistics. CA Cancer J Clin. 2004;2004;54:8–29. doi: 10.3322/canjclin.54.1.8. [DOI] [PubMed] [Google Scholar]
- 4.Travis WD, Brambilla E, Noguchi M, et al. International association for the study of lung cancer/american thoracic society/european respiratory society international multidisciplinary classification of lung adenocarcinoma. J Thorac Oncol. 2011;6:244–285. doi: 10.1097/JTO.0b013e318206a221. [DOI] [PMC free article] [PubMed] [Google Scholar]
- 5.Hirsch FR, Franklin WA, Gazdar AF, Bunn PA., Jr. Early detection of lung cancer: clinical perspectives of recent advances in biology and radiology. Clin Cancer Res. 2001;7:5–22. [PubMed] [Google Scholar]
- 6.Demedts IK, Vermaelen KY, van Meerbeeck JP. Treatment of extensive-stage small cell lung carcinoma: current status and future prospects. Eur Respir J. 2010;35:202–215. doi: 10.1183/09031936.00105009. [DOI] [PubMed] [Google Scholar]
- 7.Minna JD, Roth JA, Gazdar AF. Focus on lung cancer. Cancer Cell. 2002;1:49–52. doi: 10.1016/s1535-6108(02)00027-2. [DOI] [PubMed] [Google Scholar]
- 8.Aberle DR, Adams AM, Berg CD, et al. Reduced lung-cancer mortality with low-dose computed tomographic screening. N Engl J Med. 2011;365:395–409. doi: 10.1056/NEJMoa1102873. [DOI] [PMC free article] [PubMed] [Google Scholar]
- 9.Saccomanno G. Sputum cytology. Mayo Clin Proc. 1994;69:97. doi: 10.1016/s0025-6196(12)61629-2. [DOI] [PubMed] [Google Scholar]
- 10.Saccomanno G, Saunders RP, Archer VE, Auerbach O, Kuschner M, Beckler PA. Cancer of the lung: the cytology of sputum prior to the development of carcinoma. Acta Cytol. 1965;9:413–423. [PubMed] [Google Scholar]
- 11.Thunnissen FB. Sputum examination for early detection of lung cancer. J Clin Pathol. 2003;56:805–810. doi: 10.1136/jcp.56.11.805. [DOI] [PMC free article] [PubMed] [Google Scholar]
- 12.Byers T, Hirsch FR. Computed tomography screening for lung cancer: what should we recommend? Cancer Pract. 2001;9:97–99. doi: 10.1046/j.1523-5394.2001.009002097.x. [DOI] [PubMed] [Google Scholar]
- 13.Belinsky SA, Palmisano WA, Gilliland FD, et al. Aberrant promoter methylation in bronchial epithelium and sputum from current and former smokers. Cancer Res. 2002;62:2370–2377. [PubMed] [Google Scholar]
- 14.Belinsky SA. Gene-promoter hypermethylation as a biomarker in lung cancer. Nat Rev Cancer. 2004;4:707–717. doi: 10.1038/nrc1432. [DOI] [PubMed] [Google Scholar]
- 15.Varella-Garcia M, Kittelson J, Schulte AP, et al. Multi-target interphase fluorescence in situ hybridization assay increases sensitivity of sputum cytology as a predictor of lung cancer. Cancer Detect Prev. 2004;28:244–251. doi: 10.1016/j.cdp.2004.04.007. [DOI] [PubMed] [Google Scholar]
- 16.Varella-Garcia M, Schulte AP, Wolf HJ, et al. The detection of chromosomal aneusomy by fluorescence in situ hybridization in sputum predicts lung cancer incidence. Cancer Prev Res (Phila) 2010;3:447–453. doi: 10.1158/1940-6207.CAPR-09-0165. [DOI] [PMC free article] [PubMed] [Google Scholar]
- 17.Li R, Todd NW, Qiu Q, et al. Genetic deletions in sputum as diagnostic markers for early detection of stage I non-small cell lung cancer. Clin Cancer Res. 2007;13(2):482–487. doi: 10.1158/1078-0432.CCR-06-1593. Pt 1. [DOI] [PubMed] [Google Scholar]
- 18.Jiang F, Todd NW, Li R, Zhang H, Fang H, Stass SA. A panel of sputum-based genomic marker for early detection of lung cancer. Cancer Prev Res (Phila) 2010;3:1571–1578. doi: 10.1158/1940-6207.CAPR-10-0128. [DOI] [PubMed] [Google Scholar]
- 19.Galasso M, Sana ME, Volinia S. Non-coding RNAs: a key to future personalized molecular therapy? Genome Med. 2010;2:12. doi: 10.1186/gm133. [DOI] [PMC free article] [PubMed] [Google Scholar]
- 20.Ambros V. MicroRNA pathways in flies and worms: growth, death, fat, stress, and timing. Cell. 2003;113:673–676. doi: 10.1016/s0092-8674(03)00428-8. [DOI] [PubMed] [Google Scholar]
- 21.Lu J, Getz G, Miska EA, et al. MicroRNA expression profiles classify human cancers. Nature. 2005;435:834–838. doi: 10.1038/nature03702. [DOI] [PubMed] [Google Scholar]
- 22.Iorio MV, Croce CM. microRNA involvement in human cancer. Carcinogenesis. 2012;33:1126–1133. doi: 10.1093/carcin/bgs140. [DOI] [PMC free article] [PubMed] [Google Scholar]
- 23.Wang J, Tian X, Han R, et al. Downregulation of miR-486-5p contributes to tumor progression and metastasis by targeting protumorigenic ARHGAP5 in lung cancer. Oncogene. 2013 doi: 10.1038/onc.2013.42. in press. [DOI] [PMC free article] [PubMed] [Google Scholar]
- 24.Xie Y, Todd NW, Liu Z, et al. Altered miRNA expression in sputum for diagnosis of non-small cell lung cancer. Lung Cancer. 2010;67:170–176. doi: 10.1016/j.lungcan.2009.04.004. [DOI] [PMC free article] [PubMed] [Google Scholar]
- 25.Yu L, Todd NW, Xing L, et al. Early detection of lung adenocarcinoma in sputum by a panel of microRNA markers. Int J Cancer. 2010;127:2870–2878. doi: 10.1002/ijc.25289. [DOI] [PMC free article] [PubMed] [Google Scholar]
- 26.Xing L, Todd NW, Yu L, Fang H, Jiang F. Early detection of squamous cell lung cancer in sputum by a panel of microRNA markers. Mod Pathol. 2010;23:1157–1164. doi: 10.1038/modpathol.2010.111. [DOI] [PubMed] [Google Scholar]
- 27.Jiang F, Todd NW, Qiu Q, Liu Z, Katz RL, Stass SA. Combined genetic analysis of sputum and computed tomography for noninvasive diagnosis of non-small-cell lung cancer. Lung Cancer. 2009;66:58–63. doi: 10.1016/j.lungcan.2009.01.004. [DOI] [PMC free article] [PubMed] [Google Scholar]
- 28.Katz RL, Zaidi TM, Fernandez RL, et al. Automated detection of genetic abnormalities combined with cytology in sputum is a sensitive predictor of lung cancer. Mod Pathol. 2008;21:950–960. doi: 10.1038/modpathol.2008.71. [DOI] [PMC free article] [PubMed] [Google Scholar]
- 29.Qiu Q, Todd NW, Li R, et al. Magnetic enrichment of bronchial epithelial cells from sputum for lung cancer diagnosis. Cancer. 2008;114:275–283. doi: 10.1002/cncr.23596. [DOI] [PMC free article] [PubMed] [Google Scholar]
- 30.Berman KS, Verma UN, Harburg G, Minna JD, Cobb MH, Gaynor RB. Sulindac enhances tumor necrosis factor-alpha-mediated apoptosis of lung cancer cell lines by inhibition of nuclear factor-kappaB. Clin Cancer Res. 2002;8:354–360. [PubMed] [Google Scholar]
- 31.Henschke CI, Yankelevitz DF, Smith JP, Miettinen OS, ELCAP Group Screening for lung cancer: the early lung cancer action approach. Lung Cancer. 2002;35:143–148. doi: 10.1016/s0169-5002(01)00416-0. [DOI] [PubMed] [Google Scholar]
- 32.Henschke CI, Yankelevitz DF, Naidich DP, et al. CT screening for lung cancer: suspiciousness of nodules according to size on baseline scans. Radiology. 2004;231:164–168. doi: 10.1148/radiol.2311030634. [DOI] [PubMed] [Google Scholar]
- 33.Pepe MS. Oxford. Oxford University Press; New York: 2003. The Statistical Evaluation of Medical Tests for Classification and Prediction. [Google Scholar]
- 34.Tian GL, Tang ML, Fang HB, Tan M. Efficient methods for estimating constrained parameters with applications to lasso logistic regression. Comput Stat Data Anal. 2008;52:3528–3542. doi: 10.1016/j.csda.2007.11.007. [DOI] [PMC free article] [PubMed] [Google Scholar]
- 35.Hanley JA, McNeil BJ. The meaning and use of the area under a receiver operating characteristic (ROC) curve. Radiology. 1982;143:29–36. doi: 10.1148/radiology.143.1.7063747. [DOI] [PubMed] [Google Scholar]
- 36.Valastyan S, Weinberg RA. miR-31: a crucial overseer of tumor metastasis and other emerging roles. Cell Cycle. 2010;9:2124–2129. doi: 10.4161/cc.9.11.11843. [DOI] [PubMed] [Google Scholar]
- 37.Hong L, Han Y, Zhang H, Zhao Q, Qiao Y. miR-210: a therapeutic target in cancer. Expert Opin Ther Targets. 2013;17:21–28. doi: 10.1517/14728222.2012.732066. [DOI] [PubMed] [Google Scholar]
- 38.McCormick R, Buffa FM, Ragoussis J, Harris AL. The role of hypoxia regulated microRNAs in cancer. Curr Top Microbiol Immunol. 2010;345:47–70. doi: 10.1007/82_2010_76. [DOI] [PubMed] [Google Scholar]
- 39.Gee HE, Camps C, Buffa FM, et al. hsa-mir-210 is a marker of tumor hypoxia and a prognostic factor in head and neck cancer. Cancer. 2010;116:2148–2158. doi: 10.1002/cncr.25009. [DOI] [PubMed] [Google Scholar]
- 40.Camps C, Buffa FM, Colella S, et al. hsa-miR-210 Is induced by hypoxia and is an independent prognostic factor in breast cancer. Clin Cancer Res. 2008;14:1340–1348. doi: 10.1158/1078-0432.CCR-07-1755. [DOI] [PubMed] [Google Scholar]
- 41.Nakada C, Tsukamoto Y, Matsuura K, et al. Overexpression of miR-210, a downstream target of HIF1α, causes centrosome amplification in renal carcinoma cells. J Pathol. 2011;224:280–288. doi: 10.1002/path.2860. [DOI] [PubMed] [Google Scholar]
- 42.Malzkorn B, Wolter M, Liesenberg F, et al. Identification and functional characterization of microRNAs involved in the malignant progression of gliomas. Brain Pathol. 2010;20:539–550. doi: 10.1111/j.1750-3639.2009.00328.x. [DOI] [PMC free article] [PubMed] [Google Scholar]
- 43.Scapoli L, Palmieri A, Lo Muzio L, et al. MicroRNA expression profiling of oral carcinoma identifies new markers of tumor progression. Int J Immunopathol Pharmacol. 2010;23:1229–1234. doi: 10.1177/039463201002300427. [DOI] [PubMed] [Google Scholar]
- 44.Hong L, Yang J, Han Y, Lu Q, Cao J, Syed L. High expression of miR-210 predicts poor survival in patients with breast cancer: a meta-analysis. Gene. 2012;507:135–138. doi: 10.1016/j.gene.2012.07.025. [DOI] [PubMed] [Google Scholar]
- 45.Chang W, Lee CY, Park JH, et al. Survival of hypoxic human mesenchymal stem cells is enhanced by a positive feedback loop involving miR-210 and hypoxia-inducible factor 1. J Vet Sci. 2013;14:69–76. doi: 10.4142/jvs.2013.14.1.69. [DOI] [PMC free article] [PubMed] [Google Scholar]
- 46.Lawrie CH, Gal S, Dunlop HM, et al. Detection of elevated levels of tumour-associated microRNAs in serum of patients with diffuse large B-cell lymphoma. Br J Haematol. 2008;141:672–675. doi: 10.1111/j.1365-2141.2008.07077.x. [DOI] [PubMed] [Google Scholar]
- 47.Papaconstantinou IG, Manta A, Gazouli M, et al. Expression of microRNAs in patients with pancreatic cancer and its prognostic significance. Pancreas. 2013;42:67–71. doi: 10.1097/MPA.0b013e3182592ba7. [DOI] [PubMed] [Google Scholar]
- 48.Shen J, Liu Z, Todd NW, et al. Diagnosis of lung cancer in individuals with solitary pulmonary nodules by plasma microRNA biomarkers. BMC Cancer. 2011;11:374. doi: 10.1186/1471-2407-11-374. [DOI] [PMC free article] [PubMed] [Google Scholar]
- 49.Valastyan S, Reinhardt F, Benaich N, et al. A pleiotropically acting microRNA, miR-31, inhibits breast cancer metastasis. Cell. 2009;137:1032–1046. doi: 10.1016/j.cell.2009.03.047. [DOI] [PMC free article] [PubMed] [Google Scholar] [Retracted]
- 50.Xu RS, Wu XD, Zhang SQ, et al. The tumor suppressor gene RhoBTB1 is a novel target of miR-31 in human colon cancer. Int J Oncol. 2013;42:676–682. doi: 10.3892/ijo.2012.1746. [DOI] [PubMed] [Google Scholar]
- 51.Odar K, Boštjančič E, Gale N, Glavač D, Zidar N. Differential expression of microRNAs miR-21, miR-31, miR-203, miR-125a-5p and miR-125b and proteins PTEN and p63 in verrucous carcinoma of the head and neck. Histopathology. 2012;61:257–265. doi: 10.1111/j.1365-2559.2012.04242.x. [DOI] [PubMed] [Google Scholar]
- 52.Zhang T, Wang Q, Zhao D, et al. The oncogenetic role of microRNA-31 as a potential biomarker in oesophageal squamous cell carcinoma. Clin Sci (Lond) 2011;121:437–447. doi: 10.1042/CS20110207. [DOI] [PubMed] [Google Scholar]
- 53.Punturieri A, Szabo E, Croxton TL, Shapiro SD, Dubinett SM. Lung cancer and chronic obstructive pulmonary disease: needs and opportunities for integrated research. J Natl Cancer Inst. 2009;101:554–559. doi: 10.1093/jnci/djp023. [DOI] [PMC free article] [PubMed] [Google Scholar]
- 54.Houghton AM. Mechanistic links between COPD and lung cancer. Nat Rev Cancer. 2013;13:233–245. doi: 10.1038/nrc3477. [DOI] [PubMed] [Google Scholar]
- 55.Schwartz AG. Genetic epidemiology of cigarette smoke-induced lung disease. Proc Am Thorac Soc. 2012;9:22–26. doi: 10.1513/pats.201106-037MS. [DOI] [PMC free article] [PubMed] [Google Scholar]
- 56.Caramori G, Casolari P, Cavallesco GN, Giuffrè S, Adcock I, Papi A. Mechanisms involved in lung cancer development in COPD. Int J Biochem Cell Biol. 2011;43:1030–1044. doi: 10.1016/j.biocel.2010.08.022. [DOI] [PubMed] [Google Scholar]
- 57.Srivastava S. Cancer biomarker discovery and development in gastrointestinal cancers: early detection research network-a collaborative approach. Gastrointest Cancer Res. 2007;1(4 Suppl 2):S60–S63. [PMC free article] [PubMed] [Google Scholar]
Associated Data
This section collects any data citations, data availability statements, or supplementary materials included in this article.