Peripheral T-cell lymphomas (PTCLs) are a heterogeneous group of non-Hodgkin lymphomas (NHLs), characterized by aggressive clinical behavior. Nodal PTCL (n-PTCL) includes four disorders: angioimmunoblastic T-cell lymphoma (AITL), peripheral T-cell lymphoma not otherwise specified (PTCL-NOS) and anaplastic large cell lymphoma (ALCL) (ALK-positive and ALK-negative forms). While AITL and ALCL both have their own particular morphological and phenotypic features, n-PTCL-NOS comprises a variety of peripheral T-cell lymphomas. Recently, gene expression studies have identified three subgroups of PTCL-NOS that have prognostic implications. One is characterized by the overexpression of TBX21 and a better outcome, and the other two, which have a worse prognosis, have either cytotoxic markers or GATA3 overexpression.1
Iqbal et al.1 found the GATA3-positive subgroup of tumors to be enriched in MYC and proliferation gene signatures, amongst others. MYC is one of the most frequently dysregulated oncogenes in cancer and is critical to the development of mature PTCLs.2
In an attempt to validate these findings, we investigated the potential relationship between the presence of C-MYC, GATA3 and a high level of Ki-67 expression in paraffin-embedded tumoral tissue in a series of 128 n-PTCL patients (including 74 AITL and 54 PTCL-NOS) using tissue microarrays (TMAs) (Online Supplementary Information and Online Supplementary Table S1). Cut-off values for these three markers were based on previous reports1,3–5 (Online Supplementary Information).
We found positivity for C-MYC in 13.3% (17/128), and a high level of Ki-67 expression in 24.2% (31/128) of the cases analyzed. In this study, GATA3 expression was observed in 21.9% (28/128) of the n-PTCL cases; 20.3% (15/74) of the AITLs and 24.1% (13/54) of the PTCL-NOS patients were positive (Online Supplementary Table S2). Previous studies had reported GATA3 expression in 33%1 and 45%4 of the PTCL-NOS patients. Differences in the percentages of positivity may have been due to the different sources of the antibody used (ABCAM vs. Santa Cruz Biotechnology), or to differences in case selection criteria.
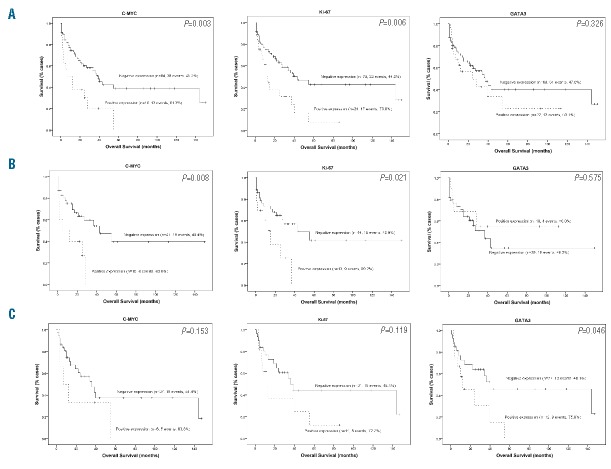
Significant positive associations were found between the expression of C-MYC and the presence of both Ki-67 (P<0.001) and GATA3 (P=0.010) (Table 1), but no significant correlation was found between the expression of Ki-67 and GATA3 (P=0.754) (Table 1). Furthermore, C-MYC and Ki-67 expression conferred poor overall survival (OS) on these patients, as indicated by the univariate analyses (P=0.003 and P=0.006, respectively) (Figure 1A). C-MYC was an independent prognostic factor in the multivariate analysis (P=0.004).
Table 1.

Figure 1.
Kaplan–Meier survival curves of biological marker expression in the complete series (A) of n-PTCL patients and in the AITL (B) and PTCL-NOS (C) histological subgroups.
In the present series, the International Prognostic Index (IPI) and the Prognostic Index for T-cell lymphoma (PIT) were both related to prognosis (data not shown). Cases with a high IPI, PIT or Eastern Cooperative Oncology Group (ECOG) performance status score tended to have a higher percentage of C-MYC staining (P=0.053, P=0.001, and P=0.008, respectively) (Online Supplementary Table S3). On the other hand, no significant correlation of Ki-67 and GATA3 expression was found with any clinical characteristic analyzed (Online Supplementary Table S4 and S5). As expected, in the multivariate analysis of the clinical (IPI and PIT) and biological variables (C-MYC and Ki-67), the Cox regression model identified only PIT as an independent prognostic factor of disease-specific OS (P<0.001).
In the present series, C-MYC was expressed in the AITL and PTCL-NOS tumor subgroups. The correlation between C-MYC and Ki-67 was maintained in AITL patients (P=0.007); on the other hand, a significant positive association was found between the expression of C-MYC and the presence of both Ki-67 (P=0.001) and GATA3 (P=0.004) in the PTCL-NOS subgroup. In addition, the presence of C-MYC and Ki-67 conferred poor prognosis exclusively on the AITL patient subgroup (P=0.008 and P=0.021, respectively) (Figure 1B), while the presence of GATA3 conferred poor prognosis on the PTCL-NOS patients (P=0.046) (Figure 1C). In the multivariate analysis, the Cox regression again identified IPI as an independent prognostic factor of disease-specific OS in both histological tumor subtypes.
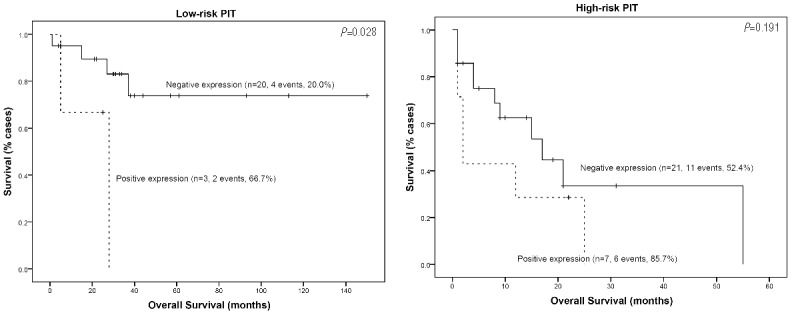
Considering patients by separate PIT risk subgroups indicated that only C-MYC maintained its prognostic implication in the low-risk PIT subgroup of AITL patients (Figure 2). Nevertheless, these results should be interpreted with caution, given the very small number of cases in this subgroup.
Figure 2.

Kaplan–Meier survival curves of C-MYC expression in the AITL subgroup of patients in the low-risk and high-risk PIT subgroups.
MYC is known to be activated by the loss of SNF5 (SMARCB1),2 overexpression of microRNA187,5 and by its own gene amplification or translocation, thereby favoring the rapid appearance of T-cell neoplasms in humans.6 Since C-MYC is involved in cell proliferation,7 the significantly positive relationship between C-MYC expression and proliferation index is not surprising. In the present series, the presence of C-MYC and Ki-67 were both independent prognostic markers in the univariate analysis. Moreover, the significance of the C-MYC marker was also significant in the AITL tumor subgroup. Their significance was not maintained when classic clinical variables were included in the multivariate analysis, although a poor prognosis subgroup of patients within the low-risk PIT subgroup of AITL patients was identified. Previous gene expression studies had identified MYC as being overexpressed in AITL, adult T-cell leukemia/lymphoma, and ALCL cases.1,8 Moreover, C-MYC overexpression is known to be related to a high proliferation index and poor clinical outcome in ALCL.9 Cuadros et al.10 identified a poor prognosis signature related to proliferation using gene expression studies. Went et al.11 associated a high level of Ki-67 expression with PTCL-NOS patient outcome when associated with clinical parameters in the design of a new prognostic index called mPIT (modified Prognostic Index for T-cell lymphoma). Weisenburger et al.12 found that Ki-67 expression conferred poor prognosis on PTCL-NOS patients, while our group3 and Federico et al.13 identified this proliferation rate as a prognostic factor in AITL patients. Recently, gene expression studies1,4 have shown that a specific subgroup of PTCL-NOS is characterized by a high level of expression of GATA3 and poor prognosis. GATA3 and C-MYC regulate each other’s expression in a manner that is not well understood, although they are critical to promoting both proliferation and differentiation of T cells.14,15 In this study, we used gene expression arrays to validate the correlation between C-MYC and GATA3 expression proposed by Iqbal et al.1 The correlation was exclusively maintained in the PTCL-NOS subgroup when considering patients with respect to morphological and phenotypic characteristics. GATA3 expression was of prognostic value in the PTCL-NOS subgroup of tumors, but not in the AITL patients.
Together, these findings validate the relevance of MYC2,5,6 expression in PTCLs, and suggest a specific pathogenic role of this protein in different subgroups of n-PTCLs that warrants further investigation. Additionally, C-MYC expression identifies a group of high-risk AITL patients who would otherwise be considered to be of low-intermediate risk on the basis of their PIT score. However, these results require confirmation in an independent series of n-PTCL patients.
Acknowledgments
We are indebted to the patients who contributed to this study and to the hospitals that supplied the samples. We acknowledge the staff of the Biobanks of the CNIO (RD09/0076/00113), IDIVAL-HUMV (RD09/0076/00076), Hospital Universitario 12 de Octubre (RD09/0076/00118), CHUVI (RD09/0076/00011) and FJD (PT13/0010/0012) for their help in collecting the samples, especially Laura Cereceda.
Footnotes
Funding: this study was supported by grants from the Asociación Española contra el Cancer (AECC), Ministerio de Economía y Competitividad (MINECO) (SAF2013-47416-R), Instituto Salud Carlos III (ISCIII) – Fondos de Investigación Sanitaria (RD06/0020/0107, RD012/0036/0060 and FIS11/1759). The Instituto de Investigación Marqués de Valdecilla (IDIVAL) is partly funded by the Sociedad para el Desarrollo Regional de Cantabria (SODERCAN).
Information on authorship, contributions, and financial & other disclosures was provided by the authors and is available with the online version of this article at www.haematologica.org.
References
- 1.Iqbal J, Wright G, Wang C, et al. Gene expression signatures delineate biological and prognostic subgroups in peripheral T-cell lymphoma. Blood. 2014;123(19):2915–2923. [DOI] [PMC free article] [PubMed] [Google Scholar]
- 2.Wang X, Werneck MB, Wilson BG, et al. TCR-dependent transformation of mature memory phenotype T cells in mice. J Clin Invest. 2011;121(10):3834–3845. [DOI] [PMC free article] [PubMed] [Google Scholar]
- 3.Rodriguez-Pinilla SM, Sanchez ME, Rodriguez J, et al. Loss of TCR-beta F1 and/or EZRIN expression is associated with unfavorable prognosis in nodal peripheral T-cell lymphomas. Blood Cancer J. 2013;3:e111. [DOI] [PMC free article] [PubMed] [Google Scholar]
- 4.Wang T, Feldman AL, Wada DA, et al. GATA-3 expression identifies a high-risk subset of PTCL, NOS with distinct molecular and clinical features. Blood. 2014;123(19):3007–3015. [DOI] [PMC free article] [PubMed] [Google Scholar]
- 5.Yan ZX, Wu LL, Xue K, et al. MicroRNA187 overexpression is related to tumor progression and determines sensitivity to bortezomib in peripheral T-cell lymphoma. Leukemia. 2014;28(4):880–887. [DOI] [PubMed] [Google Scholar]
- 6.Thorns C, Bastian B, Pinkel D, et al. Chromosomal aberrations in angioimmunoblastic T-cell lymphoma and peripheral T-cell lymphoma unspecified: A matrix-based CGH approach. Genes Chromosomes Cancer. 2007;46(1):37–44. [DOI] [PubMed] [Google Scholar]
- 7.Lutz W, Leon J, Eilers M. Contributions of Myc to tumorigenesis. Biochim Biophys Acta. 2002;1602(1):61–71. [DOI] [PubMed] [Google Scholar]
- 8.Iqbal J, Weisenburger DD, Greiner TC, et al. Molecular signatures to improve diagnosis in peripheral T-cell lymphoma and prognostication in angioimmunoblastic T-cell lymphoma. Blood. 2010; 115(5):1026–1036. [DOI] [PMC free article] [PubMed] [Google Scholar]
- 9.Moritake H, Shimonodan H, Marutsuka K, Kamimura S, Kojima H, Nunoi H. C-MYC rearrangement may induce an aggressive phenotype in anaplastic lymphoma kinase positive anaplastic large cell lymphoma: Identification of a novel fusion gene ALO17/C-MYC. Am J Hematol. 2011;86(1):75–78. [DOI] [PubMed] [Google Scholar]
- 10.Cuadros M, Dave SS, Jaffe ES, et al. Identification of a proliferation signature related to survival in nodal peripheral T-cell lymphomas. J Clin Oncol. 2007;25(22):3321–3329. [DOI] [PubMed] [Google Scholar]
- 11.Went P, Agostinelli C, Gallamini A, et al. Marker expression in peripheral T-cell lymphoma: a proposed clinical-pathologic prognostic score. J Clin Oncol. 2006;24(16):2472–2479. [DOI] [PubMed] [Google Scholar]
- 12.Weisenburger DD, Savage KJ, Harris NL, et al. Peripheral T-cell lymphoma, not otherwise specified: a report of 340 cases from the International Peripheral T-cell Lymphoma Project. Blood. 2011; 117(12):3402–3408. [DOI] [PubMed] [Google Scholar]
- 13.Federico M, Rudiger T, Bellei M, et al. Clinicopathologic characteristics of angioimmunoblastic T-cell lymphoma: analysis of the international peripheral T-cell lymphoma project. J Clin Oncol. 2013; 31(2):240–246. [DOI] [PMC free article] [PubMed] [Google Scholar]
- 14.Wang Y, Misumi I, Gu AD, et al. GATA-3 controls the maintenance and proliferation of T cells downstream of TCR and cytokine signaling. Nat Immunol. 2013;14(7):714–722. [DOI] [PMC free article] [PubMed] [Google Scholar]
- 15.van Hamburg JP, de Bruijn MJ, Dingjan GM, et al. Cooperation of Gata3, C-MYC and Notch in malignant transformation of double positive thymocytes. Mol Immunol. 2008;45(11):3085–3095. [DOI] [PubMed] [Google Scholar]


