

Abstract
Key points
Blood glucose is an important fuel for endurance exercise. It can be derived from ingested carbohydrate, stored liver glycogen and newly synthesized glucose (gluconeogenesis).
We hypothesized that athletes habitually following a low carbohydrate high fat (LCHF) diet would have higher rates of gluconeogenesis during exercise compared to those who follow a mixed macronutrient diet.
We used stable isotope tracers to study glucose production kinetics during a 2 h ride in cyclists habituated to either a LCHF or mixed macronutrient diet.
The LCHF cyclists had lower rates of total glucose production and hepatic glycogenolysis but similar rates of gluconeogenesis compared to those on the mixed diet.
The LCHF cyclists did not compensate for reduced dietary carbohydrate availability by increasing glucose synthesis during exercise but rather adapted by altering whole body substrate utilization.
Abstract
Endogenous glucose production (EGP) occurs via hepatic glycogenolysis (GLY) and gluconeogenesis (GNG) and plays an important role in maintaining euglycaemia. Rates of GLY and GNG increase during exercise in athletes following a mixed macronutrient diet; however, these processes have not been investigated in athletes following a low carbohydrate high fat (LCHF) diet. Therefore, we studied seven well‐trained male cyclists that were habituated to either a LCHF (7% carbohydrate, 72% fat, 21% protein) or a mixed diet (51% carbohydrate, 33% fat, 16% protein) for longer than 8 months. After an overnight fast, participants performed a 2 h laboratory ride at 72% of maximal oxygen consumption. Glucose kinetics were measured at rest and during the final 30 min of exercise by infusion of [6,6‐2H2]‐glucose and the ingestion of 2H2O tracers. Rates of EGP and GLY both at rest and during exercise were significantly lower in the LCHF group than the mixed diet group (Exercise EGP: LCHF, 6.0 ± 0.9 mg kg−1 min−1, Mixed, 7.8 ± 1.1 mg kg−1 min−1, P < 0.01; Exercise GLY: LCHF, 3.2 ± 0.7 mg kg−1 min−1, Mixed, 5.3 ± 0.9 mg kg−1 min−1, P < 0.01). Conversely, no difference was detected in rates of GNG between groups at rest or during exercise (Exercise: LCHF, 2.8 ± 0.4 mg kg−1 min−1, Mixed, 2.5 ± 0.3 mg kg−1 min−1, P = 0.15). We conclude that athletes on a LCHF diet do not compensate for reduced glucose availability via higher rates of glucose synthesis compared to athletes on a mixed diet. Instead, GNG remains relatively stable, whereas glucose oxidation and GLY are influenced by dietary factors.
Key points
Blood glucose is an important fuel for endurance exercise. It can be derived from ingested carbohydrate, stored liver glycogen and newly synthesized glucose (gluconeogenesis).
We hypothesized that athletes habitually following a low carbohydrate high fat (LCHF) diet would have higher rates of gluconeogenesis during exercise compared to those who follow a mixed macronutrient diet.
We used stable isotope tracers to study glucose production kinetics during a 2 h ride in cyclists habituated to either a LCHF or mixed macronutrient diet.
The LCHF cyclists had lower rates of total glucose production and hepatic glycogenolysis but similar rates of gluconeogenesis compared to those on the mixed diet.
The LCHF cyclists did not compensate for reduced dietary carbohydrate availability by increasing glucose synthesis during exercise but rather adapted by altering whole body substrate utilization.
Abbreviations
- ASA24
automated self‐administered 24 h recall
- βHB
β‐hydroxybutyrate
- BMI
body mass index
- CV
coefficient of variation
- EGP
endogenous glucose production
- FFA
free fatty acids
- GLY
glycogenolysis
- GNG
gluconeogenesis
- HR
heart rate
- HRmax
maximum heart rate
- LCHF
low carbohydrate high fat
- MIDA
mass isotopomer distribution analysis
- MUFA
monounsaturated fatty acids
- PPO
peak power output
- PUFA
polyunsaturated fatty acids
- Ra
rate of appearance
- Rd
rate of disappearance
- RER
respiratory exchange ratio
- RPE
rating of perceived exertion
volume of carbon dioxide production
volume of oxygen uptake
maximal oxygen uptake
minute ventilation
Introduction
Plasma glucose is an important source of energy for exercise and can be derived from the ingestion of exogenous carbohydrate and from glucose produced endogenously by the liver and, to a lesser extent, by the kidneys (Nuttall et al. 2008). As exercise duration and intensity increase, the demand for plasma glucose becomes greater (Romijn et al. 1993; van Loon et al. 2001; Trimmer et al. 2002) such that the termination of exhaustive endurance exercise is often associated with hypoglycaemia (Coyle et al. 1986; Cermak & van Loon, 2013). Thus, the liver plays a crucial role in maintaining glucose homeostasis during endurance exercise, particularly when exogenous carbohydrate is not freely available. Endogenous glucose production (EGP) occurs via two processes: glycogenolysis (GLY), which is the hydrolysis of stored liver glycogen, and gluconeogenesis (GNG), which is the synthesis of new glucose in the liver and kidneys from precursors such as lactate, glycerol, certain amino acids and potentially ketone bodies (Glew, 2010). EGP and particulary hepatic GLY are potently suppressed by carbohydrate ingestion and the consequent rise in plasma glucose and insulin concentrations (Jeukendrup et al. 1999). On the other hand, low plasma glucose and insulin concentrations and a rise in plasma glucagon, catecholamine and/or glucocorticoid concentrations can stimulate EGP. This tight regulation maintains euglycaemia by matching the rate of EGP to the rate at which glucose is taken out of the circulation by tissues.
In endurance athletes who eat a conventional high carbohydrate or mixed macronutrient diet, the rate of EGP after an overnight fast doubles from rest to exercise at ∼50% of maximal oxygen uptake () (Trimmer et al. 2002) and can increase up to 4‐fold from rest to exercise at 75% (Emhoff et al. 2013). These changes are the result of higher rates of both hepatic GLY and GNG, although hepatic GLY appears to play the dominant role, particularly as the intensity of exercise increases. Indeed, hepatic GLY has been reported to account for as much as 80% of EGP during exercise at 65% (Trimmer et al. 2002; Emhoff et al. 2013).
Rates of hepatic GLY are dependent on hepatic glycogen content (Arkinstall et al. 2004) and are therefore greatest after a period of high carbohydrate feeding (Bisschop et al. 2000), although they gradually decline with fasting (Landau et al. 1996) or as endurance exercise progresses (Ahlborg et al. 1974). Conversely, the main factor that determines the rate of GNG is gluconeogenic substrate delivery to the liver (Miller et al. 2002; Gustavson et al. 2003). For example, lactate is considered the primary precursor for hepatic GNG (Ahlborg et al. 1974; Consoli et al. 1990; Meyer et al. 2002) and becomes especially important as exercise intensity increases and plasma lactate concentrations rise. During very high intensity exercise, however, there is a marked reduction in hepatic blood flow (Wahren et al. 1971), which potentially limits GNG as a result of reduced precursor delivery (Sumida et al. 2006). Glycerol becomes an important precursor during prolonged fasting (Landau et al. 1996; Jensen et al. 2001) or during prolonged exercise when the rates of lipolysis are increased (Ahlborg et al. 1974). Additionally, increased plasma free fatty acid (FFA) concentrations may directly stimulate the production of glucose via GNG (Chen et al. 1999; Roden et al. 2000; Stingl et al. 2001).
Clearly, substrate availability can have a profound influence on the nature of EGP; however, it is unclear how altering the macronutrient content of an athlete's diet affects rates of GNG and hepatic GLY during exercise. This is important because low carbohydrate high fat (LCHF) diets are becoming increasingly popular among athletes as a potential means of improving endurance performance, managing weight or reducing the risk of developing chronic disease (Paoli et al. 2013; Paoli et al. 2015; Volek et al. 2016). Athletes eating a LCHF diet experience a dramatic shift away from carbohydrate towards fat oxidation during exercise (Phinney et al. 1983; Goedecke et al. 1999; Volek et al. 2016). Even so, they are still able to sustain relatively high carbohydrate oxidation rates of between 1.0 and 1.5 g min−1 during prolonged endurance exercise in the fasted state (Lambert et al. 1994; Zajac et al. 2014). These rates are lower than in control athletes eating a mixed macronutrient diet (2.0 to 2.5 g min−1) but, in the context of very limited dietary carbohydrate intake, it is unclear from where this carbohydrate is derived. Because athletes eating a LCHF diet have reduced muscle and liver glycogen stores (Bergström et al. 1967; Nilsson & Hultman, 1973; Phinney et al. 1983; Lambert et al. 1994) and often eat less than 50 g of carbohydrate per day, we hypothesized that they will produce substantially more glucose from GNG than athletes eating a diet higher in carbohydrate. Therefore, the present study aimed to determine whether there are differences in rates of EGP, hepatic GLY and total GNG during exercise between groups of endurance‐trained cyclists who habitually eat either a mixed macronutrient or LCHF diet.
Methods
Ethical approval
The present study was approved by the Human Research Ethics Committee of the Faculty of Health Sciences, University of Cape Town, and was performed in accordance with the principles of the Declaration of Helsinki. Written informed consent was obtained from all participants before they were enrolled in the study.
Overview of study
The participants in this cross‐sectional study included a group of seven healthy, well‐trained male cyclists who had habitually eaten a LCHF diet for at least the previous 8 months, and a group of seven healthy ‘control’ cyclists matched for age, body mass index (BMI), cycling ability and body fat percentage who had habitually eaten a mixed macronutrient diet for at least as long as the LCHF group. To confirm eligibility and to match the two groups, participants underwent a screening phase where in‐depth diet history and anthropometry were assessed. They also completed a peak power output (PPO) / test on a cycle ergometer and a familiarization trial ride. Eligible participants then performed a 2 h laboratory ride at 55% of their PPO, during which stable isotope tracers were used to study glucose kinetics, whereas indirect calorimetry was used to estimate whole body substrate oxidation.
Participants and inclusion/exclusion criteria
Participants were eligible if they were well‐trained male cyclists who had at least 2 years of cycling experience and had been actively competing and/or training for at least the past 3 months; were free from known metabolic medical conditions; were not currently taking any medications; were between the ages of 18 and 45 years; had not gained or lost more than 2 kg of body weight for at least the previous 6 weeks; and had not substantially changed their diet composition for the previous 6 months. Participants in the LCHF group were included if they ate less than 50 g of carbohydrate per day or no more than 10% of total calories as carbohydrate. Participants in the mixed diet group were included if they ate more than 350 g of carbohydrate per day or more than 50% of total calories as carbohydrate.
Diet assessment
Habitual diet was assessed using in‐depth interviews, written questionnaires about their diet history and a non‐quantitative food frequency questionnaire. These tools were used to identify participants that we were confident had not significantly changed their diets within the past 6 months and probably fit into either the LCHF or mixed diet groups. Participants who reported conflicting information were not enrolled in the study. Participants then kept a first 3 day diet record, which included at least one exercising day and one non‐work day. Participants were counselled how to accurately record the description and quantities of their food intake. With the assistance of the participant, the investigator then entered foods and dietary information from the 3 day record into online Automated Self‐Administered 24 hour Recall (ASA24) software, which is based on the USDA Automated Multiple‐Pass Method that has been validated previously (Kipnis et al. 2003; Moshfegh et al. 2008). Nutrients of foods not available on ASA24 were entered manually and all nutrient data in the ASA24 reports were checked by the investigator. This dietary record was used to determine eligibility and served as a familiarization for the diet assessment immediately prior to the tracer infusion trial. Participants who qualified for the trial were then asked to maintain their habitual diet for the duration of the study and the investigators were in regular communication with the participants during the trial to check that they only ate foods suitable for their respective diets. In the 3 days prior to the tracer infusion trial, a second detailed diet record was kept by the participant, which was captured into ASA24 on the day of the tracer infusion trial as described above. All reported data are from this second 3 day diet record. Every participant ate an evening meal between 18.30 and 19.00 h the day before the experimental trial. This meal was chosen to be typical of their usual pre‐race meal and was consistent with their habitual diet assessment in terms of macronutrient content. The study design allowed glucose kinetics to be investigated under LCHF or mixed diet conditions closely reflecting how the respective participants had adapted to train and race.
Maximal exercise test
All exercise trials were performed using the participants’ own bicycles mounted on a cycle ergometer (Computrainer Pro 3D; RacerMate, Seattle, Washington, USA), which was calibrated before and after warm‐up as described previously (Lamberts et al. 2009). After a 10 min warm‐up, an incremental test was started at a work rate of 100 W and the load increased continuously by 20 W min–1 until the participant could no longer sustain a cadence greater than 70 rpm. Minute ventilation volume () and the volume of oxygen uptake () and carbon dioxide production () per minute were recorded using a breath‐by‐breath gas analyser (Jaeger Oxycon Pro, Hoechberg, Germany) (Macfarlane, 2001), which was calibrated immediately before each trial. PPO was calculated as the average workload over the last minute of the test. was calculated as the highest averaged over 15 s. Heart rate (HR) was measured during all exercise trials using a Suunto T6 HR monitor (Suunto Oy, Vantaa, Finland). Maximal heart rate (HRmax) was calculated as the highest HR averaged over 4 s during the PPO test.
Submaximal exercise trials
Participants performed two similar 2 h laboratory rides separated by 72 h. They were required to use motorized transport to travel to the laboratory and were instructed to keep their physical activity to a minimum on the morning of the rides. The first ride served as a familiarization trial. Participants performed a light recovery exercise session in their own time on the day after this familiarization ride but refrained from exercise the day prior to the experimental trial. During the experimental ride, stable isotope tracers were used to study glucose kinetics. Both rides started at a work rate of 100 W less than 55% of the participant's PPO. The work rate was continuously increased up to 55% of their PPO over the first 12 min and then remained constant at 55% of PPO for the duration of the ride. During the last 5 min of each 15 min interval during the ride, participants were fitted with a respiration gas analysis mask to record , and . The first 1 min and last 15 s of each measurement period were excluded from the analysis to ensure that steady‐state data were used. HR was recorded continuously during the ride and averaged during the measurement period. Rating of perceived exertion (RPE) was recorded before and after each 5 min respiratory gas collection period using the Borg 6–20 RPE scale (Borg, 1970).
Experimental protocol
An overview of the experimental trial is presented in Fig. 1. The day before the experimental trial, a baseline blood sample was collected. That evening, participants ate their usual pre‐race meal between 18.30 and 19.00 h, after which they fasted until the end of the experimental ride. Between 21.00 and 23.00 h, participants ingested 4 g kg−1 body weight 2H2O (99.8 atom percent 2H; Cambridge Isotope Laboratories, Cambridge, MA, USA), which enriched their body water to ∼0.5 % 2H2O (data not shown). The next morning, participants arrived at the laboratory at 06.00 h and remained in a supine position when a cannula was inserted into the antecubital vein of each arm. The right cannula was used to sample blood and the left was used for the infusion of [6,6‐2H2]‐glucose (99 atom percent 2H; Cambridge Isotope Laboratories). A heating blanket was placed over the lower right arm to ensure that the sampled blood was arterialized. At ∼06.30 h, a 6.5 mg kg−1 priming dose of [6,6‐2H2]‐glucose was injected, followed by a 2 h continuous infusion of [6,6‐2H2]‐glucose at a rate of 0.055 mg kg−1 min−1 using an automated syringe pump (Travenol Auto Syringe Model 5C; Travenol Laboratories Inc, Hooksett, NH, USA). After 2 h, the [6,6‐2H2]‐glucose infusion rate was doubled to 0.11 mg kg−1 min−1 and the participant commenced the ride. This [6,6‐2H2]‐glucose infusion, blood sampling and exercise protocol is similar to that used previously (Febbraio et al. 2004) and achieved adequate isotopic equilibrium (data not shown).
Figure 1. An overview of the experimental trial starting from the day prior to the 2 h ride .
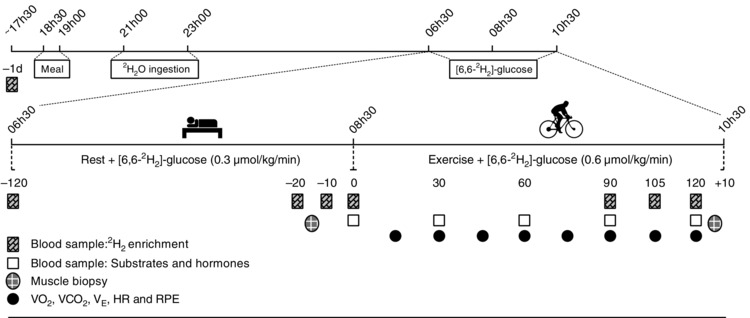
Clock times (above line) and days or minutes relative to the start of exercise (below line) are shown.
Sample collection
Blood samples for isotope analysis were collected in EDTA containing tubes prior to the start of [6,6‐2H2]‐glucose infusion (–120 min); during the final 20 min of the resting infusion period (−20, −10 and 0 min); and during the final 30 min of exercise (90, 105 and 120 min). Blood samples for hormone and substrate analysis were collected immediately prior to exercise (0 min), as well as at 30, 60, 90 and 120 min during exercise. Blood for plasma glucose and lactate analysis was collected in tubes containing fluoride and oxalate; blood for serum FFA and insulin analysis was collected in tubes with a clot activator and gel barrier; blood for plasma glucagon and glycerol analysis was collected in tubes containing EDTA. All blood samples for plasma and serum analysis were centrifuged at 3000 g at 4°C for 10 min immediately after collection. They were then kept frozen on dry ice for the remainder of the trial before being stored at −20 or −80 °C prior to subsequent analysis. Whole blood was used immediately for β‐hydroxybutyrate (βHB) analysis. To measure muscle glycogen usage during the ride, a muscle biopsy was collected from the vastus lateralis muscle of the right leg ∼15 min prior to the start of exercise and from the left leg within 5–10 min of ending exercise. The suction‐assisted needle biopsy technique described by Bergström et al. (1967) and as modified by Evans et al. (1982) was used. Muscle samples were rapidly dissected free of connective tissue and frozen and stored in liquid nitrogen for later analysis.
Isotope enrichment analysis
The fraction of EGP derived from GNG (fractional GNG) was estimated from plasma samples using the average deuterium enrichment method (Chacko et al. 2008). The principle behind this technique is that the glucose produced via GNG incorporates hydrogen from body water at all carbon (C) positions (C‐1, 2, 3, 4, 5, 6, or 6), whereas glucose derived from GLY incorporates hydrogen ions only at the C‐2 position (Wolfe, 1992). Moreover, 2H incorporation at C‐2 is the result of complete 2H exchange with body water during extensive glucose 6‐phosphate to fructose 6‐phosphate isomerization and rapidly achieves 2H enrichment equivalent to that in body water (Landau et al. 1996). Therefore, after ingestion and equilibration of 2H2O in the total body water pool, the average deuterium enrichment of glucose at any position besides C‐2 reflects glucose produced via gluconeogenic pathways (Chacko et al. 2008). Assuming complete equilibration of plasma 2H2O enrichment with deuterium enrichment of glucose at C‐2, fractional GNG can be calculated as the ratio of average deuterium enrichment of glucose at C‐1, 3, 4, 5, 6 and 6 (i.e. not at C‐2) to enrichment of plasma 2H2O (Landau et al. 1996; Chacko et al. 2008). To quantify these specific glucose isotope enrichments, selective ion monitoring was performed as described previously (Chacko et al. 2008). Briefly, the pentaacetate derivatives of plasma glucose were prepared and analysed using gas chromatography–mass spectrometry (6890N/5975B inert EI/CI; Agilent Technologies, Wilmington, DE, USA) in the positive chemical ionization mode using methane as the reagent gas. Selective ion monitoring of m/z 170/169 was performed to determine the M+1 enrichment of deuterium in the circulating glucose carbons (C‐1, 3, 4, 5, 6 or 6) where M is the base mass 169, representing unlabelled glucose (Chacko et al. 2008). To accurately measure the deuterium labelling of glucose from ingested 2H2O, the enrichment of M+1 resulting from natural abundance was subtracted. Deuterium enrichment in plasma water was determined by isotope ratio mass spectrometry (Delta+XL IRMS; Thermo Finnigan, Bremen, Germany) as described previously (Chacko et al. 2008). The M+2 enrichment of glucose derived from infusion of [6,6‐ 2H2]‐glucose was determined from plasma samples using gas chromatography–mass spectrometry in the electron impact ionization mode by selective ion monitoring of m/z 244/242 and was used to measure appearance rate of glucose as described previously (Bier et al. 1977; Chacko & Sunehag, 2010).
Kinetics calculations
Rate of appearance (R a) and rate of disappearance (R d) of glucose was calculated during the last 20 min of rest (−20, −10 and 0 min) and during the last 30 min of exercise (90, 105 and 120 min) using the non‐steady‐state equations of Steele modified for use with stable isotopes (Wolfe, 1992):
Where R a and R d are in mg kg–1 min–1, F is the infusion rate (mg kg–1 min–1), V is the blood pool (0.18 l kg−1) (Emhoff et al. 2013), C is the plasma concentration of glucose (mg dl–1), IE is the M+2 enrichment (molar percent excess) and t is the sampling time (min). The infusion rate was subtracted from R a to calculate the rate of EGP (mg kg–1 min–1).
Fractional GNG was calculated from the average M+1 enrichment of 2H2O as:
Fractional GNG = Average M + 1 enrichment/E 2H2O) Where (M+1)(2H)(m/z 170/169) is the M+1 enrichment of deuterium in glucose measured using m/z 170/169 minus the natural abundance M+1 enrichment, ‘6’ is the number of 2H labelling sites on the m/z 170/169 fragment of glucose and E 2H2O is the deuterium enrichment in plasma water (Chacko et al. 2008).
Absolute rates of GNG and hepatic GLY were calculated as:
Metabolic calculations
Carbohydrate and fat oxidation rates and energy expenditure were calculated from and using the stoichiometric equations and appropriate energy equivalents below, with the assumption that urinary nitrogen excretion rate was negligible (Frayn, 1983):
Substrate analysis
All sample analyses except for βHB were performed in duplicate and the intra‐assay coefficient of variation (CV) is provided for each assay. Plasma glucose (CV, 1.82%) and lactate concentrations (CV, 0.9%) were determined using the glucose oxidase method (YSI 2300; STAT PLUS, Yellow Springs, OH, USA). Serum insulin concentrations (CV, 0.58%) were determined using automated chemiluminescence (Centaur CP system; Siemens Healthcare Diagnostics Inc., New York, NY, USA). Blood βHB concentrations were determined immediately after sampling using a FreeStyle Optium Xceed β‐ketone meter and FreeStyle Optium H test strips (Abbott Laboratories, Abbott Park, IL, USA). Serum FFA concentrations (CV, 4.6%) were determined using a commercial kit (FFA half‐micro test; Roche Applied Science, Mannheim, Germany) and a Multi‐Mode Microplate Reader (BioTek Synergy HT; BioTek Inc., Winooski, VT, USA). Plasma glucagon concentrations (CV, 19%) were determined using a commercial kit (Glucagon EIA Kit; Sigma‐Aldrich, St Louis, MO, USA). Serum glycerol concentrations (CV, 6.7%) were determined using a commercial kit (Abcam, Cambridge, UK).
Muscle glycogen
Muscle glycogen content was measured as glucose equivalents using the glucose oxidase method following the acid hydrolysis of glycogen to glucose (Passonneau & Lauderdale, 1974). Approximately 20 mg of muscle (wet weight) was weighed and freeze dried prior to the analysis. The rate of muscle glycogen utilization (g min–1) was calculated using 15 kg as an estimate of leg muscle mass (Janssen et al. 2000).
Statistical analysis
Normality was tested using Shapiro‐Wilk's W test and Levine's test for equality of variance. Where normally distributed, differences between groups were detected using the independent t test. Where not normally distributed, the Mann–Whitney U test was used. Two‐way ANOVA for repeated measures was used to determine differences in substrate oxidation rates, substrate and hormone concentrations and muscle glycogen content. Where a significant interaction effect was detected, further statistical analysis was performed using Tukey's honestly significant post hoc test. P < 0.05 was considered statistically significant. Statistical analysis was performed using Statistica, version 12 (StatSoft, Inc., Tulsa, OK, USA).
Results
Participant and dietary characteristics
As intended, the two groups were well matched for age, weight, BMI, body fat percentage, PPO and (Table 1). The macronutrient composition of the diets during the 3 days prior to the experimental trial was 21% protein, 72% fat and 7% carbohydrate in the LCHF group and 16% protein, 33% fat and 51% carbohydrate in the mixed diet group. The LCHF group averaged between 15 and 82 g day−1 of total carbohydrate (including dietary fibre) compared to between 272 and 561 g day−1 in the mixed diet group (Table 2). Whether expressed in absolute terms (g day–1) or relative to body weight (g kg–1 day–1), there was no difference in energy intake or protein intake between groups. Despite the LCHF group eating almost twice the amount of total fat, intakes of polyunsaturated fatty acids (PUFA) were not significantly different between groups (P = 0.91) (Table 2). The LCHF group consumed significantly more saturated and monounsaturated fatty acids (MUFA), and significantly less sugars and fibre than the mixed diet group (all P < 0.01) (Table 2).
Table 1.
Participant characteristics for the LCHF and mixed diet groups
| LCHF | Mixed | P | |
|---|---|---|---|
| Age (years) | 36 ± 6 (29–44) | 32 ± 5 (24–40) | 0.24 |
| Weight (kg) | 78 ± 9 (65–90) | 74 ± 8 (62–89) | 0.41 |
| BMI (kg m–2) | 23.6 ± 1.8 (20–27) | 23.4 ± 2.0 (20–27) | 0.76 |
| Body fat (%) | 10 ± 3 (7–14) | 10 ± 3 (7–17) | 0.90 |
| HRmax (beats min–1) | 184 ± 5 (176–193) | 182 ± 8 (172–193) | 0.54 |
| (ml min–1) | 4683 ± 445 (4019–5388) | 4573 ± 483 (3770–5054) | 0.69 |
| (ml kg–1 min–1) | 61 ± 5 (52–68) | 63 ± 8 (46–73) | 0.61 |
| PPO (W) | 369 ± 27 (322–422) | 367 ± 38 (291–412) | 0.93 |
| PPO (W kg–1) | 4.8 ± 0.4 (4.0–5.2) | 5.0 ± 0.4 (4.3–5.4) | 0.34 |
Values are presented as the mean ± SD (range); n = 7 per group. P values were determined by an independent t test.
Table 2.
Dietary characteristics for the LCHF and mixed diet groups
| LCHF | Mixed | P | |
|---|---|---|---|
| Time on diet (months) | 13 ± 6 (8–24) | 107 ± 115 (9–360) | 0.18 |
| Energy intake (kcal day–1) | 2866 ± 296 (2310–3190) | 3187 ± 941 (2387–4916) | 0.41 |
| Protein (g day–1) | 147 ± 35 (78–192) | 131 ± 51 (77–194) | 0.50 |
| Fat (g day–1) | 231 ± 21 (201–256) | 120 ± 52 (65–216) | <0.01 |
| Carbohydrate (g day–1) | 50 ± 20 (15–82) | 394 ± 102 (272–561) | <0.01 |
| Sugars (g day–1) | 25 ± 15 (5–53) | 173 ± 60 (89–264) | <0.01 |
| Fibre (g day–1) | 13 ± 6 (4–18) | 42 ± 17 (16–72) | <0.01 |
| Saturated fat (g day–1) | 97 ± 11 (85–118) | 39 ± 15 (18–124) | <0.01 |
| MUFA (g day–1) | 90 ± 20 (70–124) | 44 ± 20 (24–84) | <0.01 |
| PUFA (g day–1) | 26 ± 7 (16–36) | 26 ± 15 (12–53) | 0.91 |
Values are presented as the mean ± SD (range); n = 7 per group. P values were determined by an independent t test for parametric data and a Mann–Whitney U test for non‐parametric data.
Exercise intensity
Work rate during the 2 h experimental ride was standardized to 55% of each individual's PPO, which equated to a mean of 203 ± 16 W for the LCHF group and 202 ± 23 W for the mixed diet group (P = 0.93). Percentage , % HRmax and RPE were similar between groups for the duration of the ride (data not shown). During the final 30 min of the ride, when EGP and fractional GNG were measured, % was 72 ± 5 % in the LCHF group and 72 ± 7 % in the mixed diet group (P = 0.93) (Table 3).
Table 3.
Average values during minutes 90 to 120 of exercise when EGP and GNG was quantified
| LCHF | Mixed | P | |
|---|---|---|---|
| % HRmax | 87 ± 4 | 90 ± 3 | 0.95 |
| % | 72 ± 5 | 72 ± 7 | 0.93 |
| RER | 0.78 ± 0.02 | 0.90 ± 0.03 | <0.01 |
| Fat oxidation (g min–1) | 1.21 ± 0.15 | 0.56 ± 0.17 | <0.01 |
| Carbohydrate oxidation (g min–1) | 1.22 ± 0.42 | 2.89 ± 0.41 | <0.01 |
| Glucose (mmol l–1) | 4.6 ± 0.9 | 5.0 ± 0.6 | 0.42 |
| Lactate (mmol l–1) | 3.2 ± 1.0 | 2.8 ± 1.2 | 0.21 |
| Insulin (U l–1) | 1.1 ± 0.4 | 1.6 ± 0.7 | 0.12 |
| Glucagon (pg ml–1) | 22 ± 3 | 25 ± 7 | 0.48 |
| FFA (mmol l–1) | 0.9 ± 0.4 | 0.7 ± 0.2 | 0.24 |
| Glycerol (mmol l–1) | 0.30 ± 0.08 | 0.19 ± 0.04 | <0.01 |
| βHB (mmol l–1) | 0.8 ± 0.1 | 0.1 ± 0.1 | <0.01 |
Values are presented as the mean ± SD; n = 7 per group. P values were determined by the group comparison of a repeated measures ANOVA.
Substrate utilization
Total energy expenditure during the ride was not significantly different between groups (P = 0.32). Carbohydrate oxidation rates were significantly lower and fat oxidation rates were significantly higher in the LCHF group compared to the mixed diet group throughout the exercise trial (Fig. 2). Fat oxidation gradually increased in the mixed diet group but remained relatively stable in the LCHF group (Fig. 2 B). Substrate oxidation rates and the respiratory exchange ratio (RER) during the last 30 min of exercise when EGP and fractional GNG were measured are presented in Table 3.
Figure 2. Substrate utilization during exercise .
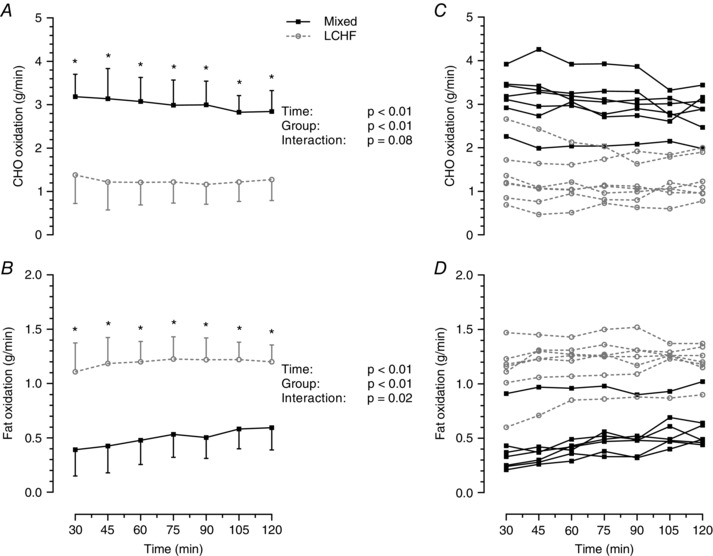
Rate of carbohydrate (CHO) oxidation (A) and rate of fat oxidation (B) during steady‐state exercise at 55% of peak power output. Data presented as the mean ± SD; n = 7 per group; P values were determined by repeated measures ANOVA. *Significant difference between groups using Tukey's post hoc test. Individual values are shown for rates of CHO oxidation (C) and rates of fat oxidation (D).
Substrates and hormones
Plasma glucose concentrations dropped during the 2 h ride, although there was no difference between groups (Fig. 3 A). Plasma lactate concentrations increased similarly in both groups at the onset of exercise and remained relatively stable after 30 min in the mixed group but were increased further at the end of exercise in the LCHF group (Fig. 3 B). Despite this interaction effect, lactate concentrations were not significantly different between groups at any stage during the trial. Serum insulin concentrations decreased throughout exercise in both groups and were lower on average in the LCHF group (group effect, P < 0.05), although there were no significant differences between groups at any specific time points (Fig. 3 C). Serum FFA concentrations increased during exercise but were not significantly different between groups (Fig. 3 D). Serum glycerol concentrations increased during exercise in the LCHF group but not the mixed diet group. On average, glycerol was significantly higher in the LCHF group during exercise (group effect, P = 0.03) (Fig. 3 E), although there were no significant differences between groups at any specific time points. In the LCHF group, blood βHB concentrations decreased at the onset of exercise and then gradually increased throughout exercise (Fig. 3 F). Despite the initial decrease, blood βHB concentrations were significantly higher in the LCHF group at every time point throughout the trial. During the last 30 min of exercise, when EGP and GNG were measured, the average serum glycerol and blood βHB concentrations were significantly higher in the LCHF group than in the mixed diet group (Table 3). However, there were no significant differences in plasma glucose, plasma lactate, serum insulin and serum FFA concentrations between the two groups (Table 3). Plasma glucagon concentrations were only measured at 90 min and 120 min and were not different between groups (P = 0.48) (Table 3).
Figure 3. Blood substrate and hormone concentrations before and during exercise .
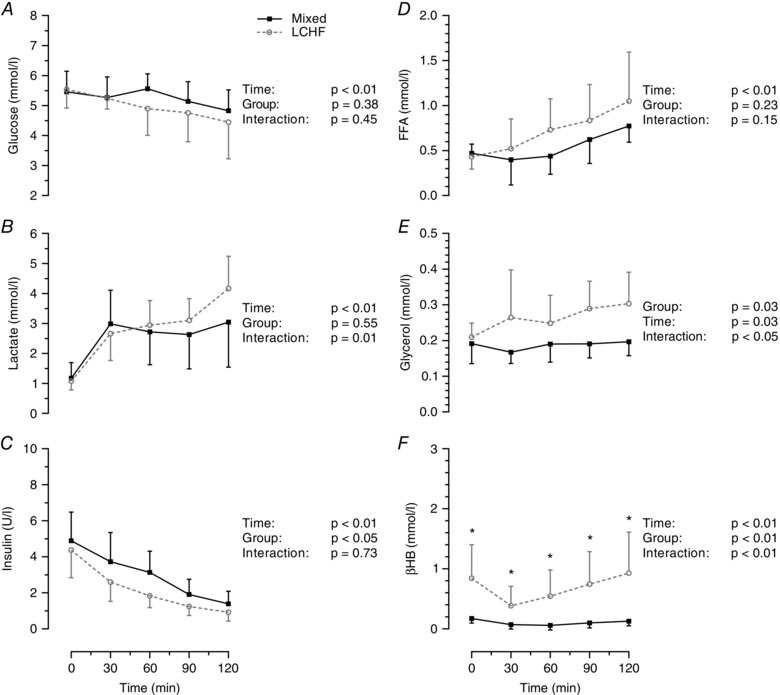
Concentrations of plasma glucose (A), plasma lactate (B), serum insulin (C), serum free fatty acids (D), serum glycerol (E) and blood βHB (F). Data are presented as the mean ± SD; n = 7 per group. P values were determined by repeated measures ANOVA. *Significant difference between groups using Tukey's post hoc test.
Resting glucose kinetics
Fractional GNG was greater in the LCHF group compared to the mixed diet group (0.73 ± 0.05 LCHF; 0.53 ± 0.07 Mixed; P < 0.01), although the absolute rate of GNG prior to exercise was not significantly different between groups (1.2 ± 0.1 mg kg−1 min−1 LCHF; 1.1 ± 0.2 mg kg−1 min−1 Mixed; P = 0.19) (Fig. 4A). Rates of hepatic GLY (0.4 ± 0.1 mg kg−1 min−1 LCHF; 1.0 ± 0.2 mg kg−1 min−1 Mixed; P < 0.01) and, consequently, total EGP (1.6 ± 0.2 mg kg−1 min−1 LCHF; 2.0 ± 0.3 mg kg−1 min−1 Mixed; P < 0.01) was lower in the LCHF group compared to the mixed diet group (Fig. 4 A).
Figure 4. Endogenous glucose production before and during exercise .
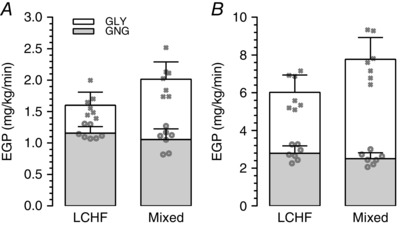
Rates of GNG, GLY and EGP during steady‐state at rest (A) and during exercise (B) (note that different y‐axis scales were used). Bars indicate the mean ± SD; n = 7 per group. GLY and EGP were significantly higher in the mixed diet group at rest and during exercise (P < 0.01). P values were determined by an independent t test for parametric data and a Mann‐Whitney U test for non‐parametric data). Individual values for GNG and EGP are indicated by the open circles and crosses, respectively.
Glucose kinetics during exercise
There was no difference between groups in the absolute rate of GNG during exercise (2.8 ± 0.4 mg kg−1 min−1 LCHF; 2.5 ± 0.3 mg kg−1 min−1 Mixed; P = 0.15) (Fig. 4 B), although the fractional contribution of GNG to EGP was significantly higher in the LCHF group compared to the mixed diet group (0.47 ± 0.05 LCHF; 0.32 ± 0.03 Mixed; P = 0.04). Rates of hepatic GLY (3.2 ± 0.6 mg kg−1 min−1 LCHF; 5.3 ± 0.9 mg kg−1 min−1 Mixed; P < 0.01) (Fig. 4 B) and total EGP (6.0 ± 0.9 mg kg−1 min−1 LCHF; 7.8 ± 1.1 mg kg−1 min−1 Mixed; P < 0.01) (Fig. 3 B) during exercise were significantly lower in the LCHF group than the mixed diet group. Additionally, glucose R d was significantly lower in the LCHF group (6.4 ± 1.0 mg kg−1 min−1 LCHF; 8.2 ± 1.0 mg kg−1 min−1 Mixed; P = 0.02).
Muscle glycogen
Pre‐exercise muscle glycogen content was 1.8‐fold greater in the mixed diet group compared to the LCHF group (P < 0.01), although no difference was detected between groups at the end of exercise (P = 0.98) (Fig. 5). Both groups had a significant reduction in muscle glycogen from pre‐ to post‐exercise (P < 0.01), although the average rate of utilization was significantly lower in the LCHF group (0.06 ± 0.03 vs. 0.15 ± 0.04 g kg−1 wet weight min–1, P < 0.01). This equates to an average muscle glycogen utilization rate of 1.0 ± 0.4 g min−1 in the LCHF group and 2.2 ± 0.7 g min−1 in the mixed diet group (P < 0.01) over the course of the exercise trial, assuming an active muscle mass of 15 kg.
Figure 5. Muscle glycogen content pre‐ and post‐exercise .
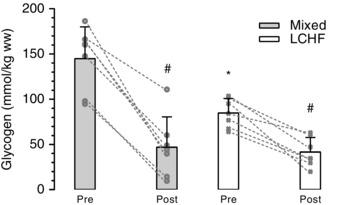
Muscle glycogen content pre‐ and post‐exercise expressed per kg wet weight (ww); n = 7 per group; *Significant difference between groups (P < 0.01). #Significant difference to pre‐exercise values within group (P < 0.01). P values determined by repeated measures ANOVA. Values and the change from pre to post are shown for each individual (to convert mmol kg–1 wet weight to mmol kg–1 dry weight, multiply by 4.3).
Glucose production relative to glucose oxidation
The rate at which glucose was produced via GNG was 20 ± 8 % of the estimated rate of total carbohydrate oxidation in the LCHF group and 7 ± 2 % in the mixed diet group during the final 30 min of exercise (P < 0.01) (Fig. 6). Total EGP could provide 42 ± 16 % of glucose oxidation requirements during exercise in the LCHF group, which is significantly higher than the 20 ± 6 % estimated for the mixed diet group (P < 0.01). The difference between the rates of total glucose oxidation (measured using indirect calorimetry) and EGP towards the end of the ride is similar to the average rates of muscle glycogen utilization calculated from the pre‐ and post‐muscle biopsies (Fig. 6).
Figure 6. Rates of gluconeogenesis and hepatic and muscle glycogenolysis relative to total carbohydrate oxidation .
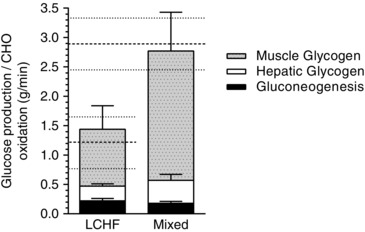
Stacked graph showing the sum of the rates of GNG and hepatic GLY (tracers) and the average rate of muscle glycogen utilization (biopsies) compared to carbohydrate (CHO) oxidation rates (indirect calorimetry) shown by the dashed lines. Values are presented as the mean ± SD; n = 7 per group.
Discussion
The present study is the first to report rates of EGP and GNG during exercise in athletes on a LCHF diet and the first to quantify total GNG during endurance exercise in trained athletes using the deuterium oxide method. The main finding was that there was no difference in the absolute rates of GNG during exercise between fasted cyclists who habitually ate a LCHF diet and those who ate a mixed diet. Conversely, the rates of EGP were significantly higher in the mixed diet group and this was attributable entirely to their greater rates of hepatic GLY.
Glucose production at rest
Our glucose production results prior to exercise are in agreement with a short‐term but well‐controlled diet intervention study by Bisschop et al. (2000), which found that resting GNG was relatively stable across a wide range of carbohydrate and fat intakes, whereas GLY was variable and positively associated with carbohydrate intake. Using a similar tracer methodology to that of the present study, their rates of GNG were 1.1 mg kg−1 min−1 after 11 days on the LCHF diet, which was slightly but significantly higher than after either a mixed or high carbohydrate diet (∼1.0 mg kg−1 min−1) (Bisschop et al. 2000). These values are very similar to those of the present study; however, we did not observe a significant difference between groups. After the LCHF diet, participants in the study by Bisschop et al. (2000) had EGP rates of 1.8 mg kg−1 min−1 compared to 2.1 mg kg−1 min−1 after the mixed diet. These values are also similar to the corresponding groups from the present study, which had resting EGP rates of 1.6 and 2.0 mg kg−1 min−1, respectively. This suggests that reductions in EGP probably occur soon after restricting dietary carbohydrate and this effect is probably not influenced by long‐term adaptation to a LCHF diet or with endurance training. These results also support the findings of Nuttall et al. (2008) who reported that the rate of GNG in healthy individuals at rest is relatively stable across a wide range of dietary conditions and that changes in EGP because of dietary status are mainly a result of differences in GLY.
Glucose production during exercise
The finding that GNG was similar between groups during exercise was somewhat surprising because it has often been speculated that LCHF athletes would rely primarily on newly synthesized glucose from fat‐ and protein‐derived precursors (Volek et al. 2015). One possible explanation is that, because hepatic blood flow is reduced at increasing exercise intensities (Rowell et al. 1964), reduced hepatic blood flow at 72% of in the present study may have limited GNG to a similar degree in both groups. This is supported by the finding that GNG can be increased under conditions of hyperlactatemia, although only at an exercise intensity below the lactate threshold (Emhoff et al. 2013). Alternatively, the combined availability of gluconeogenic substrates, whether from lactate, glycerol or amino acids, may have been similar between groups, which led to similar rates of GNG. Catabolism of muscle glycogen is considered the primary source of plasma lactate (Jacobs, 1981; Hagberg et al. 1982) and therefore the mixed diet group, with their greater muscle glycogen utilization, would have had a greater lactate flux through the circulation. Conversely, the LCHF athletes probbaly would have had a greater release of glycerol from lipolysis of i.m. triglyceride (Zderic et al. 2004), plasma very low density lipoproteins and adipose tissue triglycerides (Helge et al. 2001). Therefore, despite similar rates of GNG, LCHF athletes would probably have derived a greater proportion of their newly synthesized glucose from glycerol, whereas the mixed diet athletes would have derived a greater proportion from lactate.
In the mixed diet group of the present study, the absolute rate of GNG from all precursors was 2.5 mg kg−1 min−1 during minutes 90 to 120 of cycling at 72% . As expected, this was higher than reported previously (1.7 and 1.9 mg kg−1 min−1) when only lactate‐derived GNG was determined under similar exercise and dietary conditions (Emhoff et al. 2013). Of note, rates of EGP in our mixed diet group were consistent with the study by Emhoff et al. (2013). Their method used a [3‐13C]‐lactate tracer, which would also include glucose derived from metabolites in equilibrium with lactate, such as pyruvate and alanine but not glycerol or other amino acids (Emhoff et al. 2013). Therefore, even though lactate is considered the primary precursor for GNG during exercise (Ahlborg et al. 1974; Consoli et al. 1990; Wolfe, 1992), measuring glucose production from only lactate may considerably underestimate the rate of total GNG. This underestimation may be even larger in LCHF athletes or during prolonged low intensity exercise, in which fat oxidation rates are higher and glycerol may contribute a greater proportion of gluconeogenic substrates. In another study by Trimmer (2002), the rates of total GNG were only 1.25 mg kg−1 min−1 and EGP was 6.0 mg kg−1 min−1 after 60 min of cycling at 65% . Therefore, GNG contributed only ∼21% towards EGP, unlike the present study in which GNG contributed 32% (Mixed) and 46% (LCHF) towards EGP. Trimmer (2002) used mass isotopomer distribution analysis (MIDA) from a [2‐13C]‐glycerol precursor to estimates the contributions to GNG from all precursors (Wolfe, 1992) and a [6,6‐2H2]‐glucose tracer to measure EGP, and so it is unclear why absolute and relative rates of GNG were so much lower than the mixed diet cyclists in the current and previous studies (Emhoff et al. 2013). However, the validity of MIDA for this application has been questioned (Landau et al. 1995; Previs et al. 1995; Previs et al. 1999). Additionally, direct comparison of methods in resting post‐absorptive individuals has shown that the [2‐13C]‐glycerol MIDA method produced GNG rates 50% lower than that of a deuterium oxide method similar to the one used in the present study (Ackermans et al. 2001). The present study and that of Emhoff et al. (2013) provide further evidence that the MIDA method may underestimate total rates of GNG.
It is important to consider that, in all of the studies discussed above, glucose production was determined after a 12–14 h fast and after a period of exercise when hepatic glycogen content would have been partially depleted (Nilsson & Hultman, 1973). Because liver glycogen content is acutely sensitive to carbohydrate ingestion (Nilsson & Hultman, 1973) and LCHF adaptation decreases oxidative and up‐regulates non‐oxidative (storage) glucose disposal pathways (Cutler et al. 1995; Bisschop et al. 2001), the mixed diet group would probably have experienced a greater drop in hepatic glycogen content during this period. Therefore, the difference in GLY (and EGP) between groups would have been greater at the start of exercise or early in the post‐absorptive period. Even so, an unexpectedly large proportion of EGP in the LCHF group was derived from liver glycogen (3.2 mg kg−1 min−1 or ∼50%). The probable source of this hepatic glycogen is the GNG of dietary and endogenous substrates at rest. This is supported by the findings of Bisschop et al. (2000) who reported that significant rates of hepatic GLY (0.6 mg kg−1 min−1) can be sustained under resting conditions, despite severe dietary carbohydrate restriction (Bisschop et al. 2000). In the present study, participants performed a light recovery ride followed by a rest day on the 2 days in between the familiarization and main exercise trials. The effect of these rest days on hepatic glycogen storage in the LCHF group is not clear because hepatic glycogen repletion in adapted LCHF athletes has not been measured during recovery from exercise. Nevertheless, we show that, after long‐term adaptation to a LCHF diet, liver glycogen in rested athletes makes a substantial contribution towards EGP during prolonged high intensity exercise.
Hormonal regulation of EGP and substrate metabolism
The role of insulin in regulating GNG remains controversial because it has been reported to suppress GNG according to Klover & Mooney (2004) but has little effect according to Nuttall et al. (2008). In both our experimental groups, serum insulin concentrations decreased as exercise progressed and were slightly lower in the LCHF group compared to the mixed diet group (Fig. 3 C). However, the largest absolute difference between groups was only 1.5 U l−1, which is likely too small to be of physiological significance. Furthermore, during the period when EGP and GNG were measured, there was no difference in serum insulin concentrations between groups. We also found no difference between groups in plasma glucagon concentrations or in the insulin/glucagon ratio during the last 30 min of exercise. Although we did not measure blood catecholamine concentrations, eating a LCHF diet does not appear to drastically alter epinephrine concentrations (Helge et al. 1996; Bisschop et al. 2000) but has been reported to increase norepinephrine concentrations and exercising heart rate compared to a control diet (Jansson & Kaijser, 1982; Helge et al. 1996). Although the precise role of these hormones in regulating hepatic glucose production in the present study is not clear, the similar hormonal milieu between groups may have accounted for the similar rates of GNG.
Whole body fat and carbohydrate oxidation
A number of short‐term intervention studies (5 days to 8 weeks) have shown that a LCHF diet rapidly reduces the RER during submaximal exercise, which reflects an increase in fat and a reduction in carbohydrate oxidation (Phinney et al. 1983; Lambert et al. 1994; Goedecke et al. 1999; Rowlands & Hopkins, 2002). In most cases in which exercise was performed at 65–75% , rates of fat oxidation double from ∼0.5 g min−1 during the control diet, to ∼1.0 g min−1 after a LCHF intervention. Although there was a gradual increase in fat oxidation towards the end of exercise in the mixed diet group, the LCHF group consistently oxidized fat at a rate of 1.2 g min−1 throughout the ride. A similar trend was seen in elite ultra‐distance runners who had followed a LCHF diet for longer than 9 months (Volek et al. 2016). Surprisingly, the rates of fat oxidation after long‐term LCHF adaptation are only marginally higher than those of shorter‐term studies at similar exercise intensities (Cameron‐Smith et al. 2003). However, when an incremental exercise protocol was used specifically to determine the rate and intensity of maximal fat oxidation, the long‐term LCHF‐adapted runners oxidized fat at 1.54 g min−1 at a relative running intensity of 70.3 % (Volek et al. 2016), both of which are considerably higher than had been reported previously.
The rate of carbohydrate oxidation in the mixed diet group was more than double that of the LCHF group throughout the entire 2 h exercise session. This is consistent with greater use of muscle and liver glycogen and a greater plasma glucose uptake (R d) in athletes eating the mixed diet. Consequently, GNG contributed a much greater proportion towards the carbohydrate requirements of the LCHF group (20% LCHF; 7% Mixed), even though both groups had similar rates of absolute GNG. Muscle GLY presumably accounts for the shortfall between total glucose oxidation and EGP in these fasted athletes. Interestingly, the mixed diet group retained high carbohydrate and low fat oxidation rates at the end of exercise despite low but similar muscle (and presumably liver) glycogen stores as the LCHF group. This trend underlies the arguments both for and against LCHF diets as a tool to enhance endurance performance. On the one hand, LCHF athletes potentially have a metabolic and performance advantage during prolonged low‐to‐moderate intensity exercise once endogenous carbohydrate stores are largely reduced (Lambert et al. 1994). On the other hand, it is unclear to what extent LCHF athletes are able to sustain high‐intensity exercise in the face of reduced starting muscle glycogen and carbohydrate oxidation rates (Havemann et al. 2006; Stellingwerff et al. 2006). Further research is required to assess the role of fat oxidation during high intensity exercise in LCHF athletes. In addition, the role of muscle glycogen and muscle glycogen kinetics requires further investigation in adapted LCHF athletes. By contrast to the findings of the present study, as well as previous studies (Phinney et al. 1983; Lambert et al. 1994), a recent investigation by Volek (2016) found no difference in muscle glycogen content pre‐, post‐ and 120 min post‐exercise between long‐term LCHF and high‐carbohydrate adapted athletes. This was despite much lower rates of carbohydrate oxidation in the LCHF group.
Diet
The ability of the ‘keto‐adapted’ brain to utilize ketones as an alternate fuel to glucose is considered to be integral for any therapeutic and potential performance advantage of the ketogenic diet (Paoli et al. 2013). In one of the earliest studies to investigate exercise metabolism during nutritional ketogenesis, Phinney (1983) used a 4 week well‐controlled diet, which contained 85% of calories as fat and 15% as protein, to raise resting plasma βHB concentrations to 1.2 mmol l−1. The LCHF group in the present study consumed ∼50 g day−1 of carbohydrate (7% of calories), which was sufficiently low to induce a moderate state of nutritional ketosis with resting βHB concentrations of 0.8mmol l–1. It remains to be determined to what extent ketones are an important fuel for muscular energy production in these athletes and their impact on endurance performance.
Despite initially attempting to recruit control participants who ate more than 65% of their calories as carbohydrate, our mixed diet group only consumed an average of 394 g day−1 of carbohydrate (51% of calories). Competitive endurance athletes are often advised to consume in the region of 8–10 g kg−1 day−1 of carbohydrate (Coyle, 1991), yet the mixed diet participants in the present study ate only 5.5 g kg−1 day−1. Although this level of carbohydrate was sufficient to inhibit fat oxidation rates compared to the LCHF group, a truly high‐carbohydrate group may have had even lower fat oxidation rates and a greater use of carbohydrate during exercise. Protein intake was similar between groups, which is consistent with recommendations that individuals on a LCHF diet should replace carbohydrate with fat rather than protein. PUFA consumption was also similar between groups despite the LCHF group consuming approximately double the amount of total fat, saturated fat and MUFA than the mixed diet group. Generally, advocates of LCHF diets promote saturated fat and advise against the consumption of omega‐6 fatty acids, whereas conventional advice encourages the consumption of PUFA rather than saturated fats (Hooper et al. 2001; Jakobsen et al. 2009). The dietary fat profile of our LCHF participants therefore reflects the LCHF advice that has been broadcasted by the media in South Africa for the past 2–3 years.
Limitations
The present study comprised a cross‐sectional study of athletes who had voluntarily chosen their respective diets. Therefore, it is possible that participants in the LCHF group were drawn towards their diet because they were particularly suited to it. Conversely, it is possible that those in the mixed diet group chose not to follow a LCHF diet because they were unsuited to it. Prospective randomized controlled dietary intervention studies would help corroborate the findings of the present study.
The use of any tracer technique for metabolic research requires certain assumptions and will have potential errors. The [6,6‐2H2]‐glucose dilution and average deuterium enrichment from 2H2O methods were chosen because they are well validated and are currently considered to be the most appropriate approaches for assessing EGP and fractional GNG, respectively (Chacko et al. 2008; Chung et al. 2015). Both methods assume that near steady‐state isotopic enrichment was reached. The [6,6‐2H2]‐glucose infusion, blood sampling and exercise protocol that we used is similar to that validated previously (Febbraio et al. 2004) and achieved approximate isotopic equilibrium (data not shown). [6,6‐2H2]‐glucose is also considered a non‐recyclable tracer. When the [6,6‐2H2]‐glucose tracer undergoes degradation during glycolytic pathways, the deuteriums on C‐6 are mostly lost and undetectable, before being recycled up via the gluconeogenic pathway (Chung et al. 2015). Furthermore, because both labels are on the same carbon of [6,6‐2H2]‐glucose, any potential recycling of infused tracer (M+2 in this instance) will not interfere with the GNG measurement (M+1) (Chacko et al. 2008). Recently, it was reported that the 2H2O C5‐HMT method might overestimate GNG as a result of transaldalose exchange of the bottom carbons of fructose‐6‐phosphate (Browning & Burgess, 2012). By assessing the average incorporation of deuterium on multiple glucose carbons, any potential error that results in inequality between the top and bottom half of glucose (if real) will probably be reduced (Chung et al. 2015). Furthermore, it has been shown that measured fractional GNG in overnight fasted individuals (similar to that used in the present study) was comparable when using the average deuterium incorporation method and the 13C‐NMR method, which is not influenced by transaldolase exchange (Chung et al. 2015).
Participants were tested after a 14 h fast to simplify interpretation of the stable isotope tracer results and to be consistent with previous studies that investigated glucose kinetics during exercise (Trimmer et al. 2002; Emhoff et al. 2013). However, nutrient ingestion, and in particular carbohydrate ingestion, has profound effects on glucose production during exercise (Jeukendrup et al. 1999) and endurance athletes, particularly those on a mixed macronutrient diet, would usually ingest carbohydrate containing foods in the hours before and during exercise. Caution is required when interpreting these results in the context of normal exercising conditions. Additional studies that investigate glucose production kinetics in the fed state are therefore warranted.
The nutrients consumed in the days (and particularly the day) before the experimental trial would have had the most important impact on the glucose production results. We are confident that the 3 day diet record provides an accurate estimate of dietary intake during this period (reported data). However, accurate estimates of past habitual diets are notoriously difficult to determine. Although considerable effort was made to only select participants whose diet history we could trust, we cannot be certain that participants had truthfully followed a strict LCHF diet, or a mixed macronutrient diet, for the entire period that they specified. However, because there were no differences between the two 3 day diet records and these were consistent with the food frequency and diet history questionnaires, the reported diet data probably provide a reasonable reflection of past habitual diets. Although food was not provided for the participants, the extensive participant‐investigator interaction during the testing period helped to ensure that participants adhered to their respective diets, particularly on the evening prior to the experiment.
The use of indirect calorimetry and stoichiometric equations is widely accepted as a valid technique for estimating whole body substrate utilization during submaximal exercise. It assumes that additional metabolic processes that consume oxygen or produce carbon dioxide are quantitatively negligible. Gluconeogenesis from alanine, lipogenesis and ketogenesis can alter the RER if their products are stored rather than oxidized (Frayn, 1983; Jeukendrup & Wallis, 2005). Although these processes are potentially different between the groups in the present study, their effect on substrate utilization calculations during exercise at 72% is probably too small to significantly influence the reported results (Jeukendrup & Wallis, 2005). Figure 6 was used to contextualize the glucose kinetics findings but has a number of limitations. First, the absolute rate of muscle glycogen use (g min–1) should be treated as an approximate estimate because the mass of active skeletal muscle during cycling at 72% was assumed to be 15 kg. Second, the average rate of muscle glycogen use over the 2 h ride was calculated from pre‐ and post‐exercise muscle biopsies. It is unclear how this rate might have changed as exercise progressed and it may not reflect the actual rates during the final 30 min of exercise when glucose production was measured.
Summary and conclusions
Although there were profound differences in whole body fat and carbohydrate oxidation rates between fasted athletes on either a LCHF or mixed macronutrient diet, we found no difference in the rates of total GNG at rest or during exercise. However, the rates of EGP at rest and during exercise were greater in the mixed diet group compared to the LCHF group and this was entirely a result of higher rates of GLY. Even though plasma lactate and serum glycerol concentrations were fairly similar between groups, we would suggest that the LCHF group derived more hepatic glucose from glycerol than the mixed diet group, whereas the mixed diet group derived more glucose from lactate than the LCHF group. The exact proportions of glycerol to lactate derived GNG in these groups and the effect of feeding prior to and during exercise, requires further investigation. We conclude that rates of GNG during exercise after an overnight fast are relatively stable across a broad range of habitual diets that can significantly alter substrate utilization, although GLY and therefore EGP are influenced by dietary carbohydrate.
Additional information
Competing interests
TDN declared that he has no competing interests but discloses that he is the author of several physiology books and chairman of The Noakes Foundation, which funds research of insulin resistance, diabetes and nutrition as directed by its Board of Directors. All royalties from the sale of books and talks are donated to The Noakes Foundation and the Tim and Marilyn Noakes Sports Science Research Trust. All the remaining authors declare that they have no competing interests.
Author contributions
CCW was responsible for study co‐ordination, as well as data collection and analysis and manuscript production. TDN was responsible for conceiving the study and provision of funding. SKC was responsible for isotope experimental design, isotope sample analysis and manuscript review. JS was responsible for data collection and manuscript review. TAK was responsible for data collection and analysis, as well as manuscript review. JAS was responsible for conceiving the study, provision of funding, as well as data collection and analysis and manuscript production. All authors have approved of the final version of the manuscript, agree to be accountable for all aspects of the work in ensuring that questions related to the accuracy or integrity of any part of the work are appropriately investigated and resolved and all persons designated as authors qualify for authorship, and all those who qualify for authorship are listed. Laboratory experiments were performed at the division of Exercise Science and Sports Medicine at the University of Cape Town.
Funding
This research was funded by the National Research Foundation of South Africa; National Research Foundation Lifetime Achiever Grant 82434, Tim Noakes 2012; National Research Foundation Research Career Award 91443 James Smith, 2013; and National Research Foundation S&F – Scarce Skills Masters Scholarships 90004 Christopher Webster.
References
- Ackermans MT, Pereira Arias AM, Bisschop PH, Endert E, Sauerwein HP & Romijn JA (2001). The quantification of gluconeogenesis in healthy men by (2)H2O and [2‐(13)C]glycerol yields different results: rates of gluconeogenesis in healthy men measured with (2)H2O are higher than those measured with [2‐(13)C]glycerol. J Clin Endocrinol Metab 86, 2220–2226. [DOI] [PubMed] [Google Scholar]
- Ahlborg G, Felig P, Hagenfeldt L, Hendler R & Wahren J (1974). Substrate turnover during prolonged exercise in man. Splanchnic and leg metabolism of glucose, free fatty acids, and amino acids. J Clin Invest 53, 1080–1090. [DOI] [PMC free article] [PubMed] [Google Scholar]
- Arkinstall MJ, Bruce CR, Clark SA, Rickards CA, Burke LM & Hawley JA (2004). Regulation of fuel metabolism by preexercise muscle glycogen content and exercise intensity. J Appl Physiol (1985) 97, 2275–2283. [DOI] [PubMed] [Google Scholar]
- Bergström J, Hermansen L, Hultman E & Saltin B (1967). Diet, muscle glycogen and physical performance. Acta Physiol Scand 71, 140–150. [DOI] [PubMed] [Google Scholar]
- Bier DM, Leake RD, Haymond MW, Arnold KJ, Gruenke LD, Sperling MA & Kipnis DM (1977). Measurement of ‘true’ glucose production rates in infancy and childhood with 6,6‐dideuteroglucose. Diabetes 26, 1016–1023. [DOI] [PubMed] [Google Scholar]
- Bisschop PH, de Metz J, Ackermans MT, Endert E, Pijl H, Kuipers F, Meijer AJ, Sauerwein HP & Romijn JA (2001). Dietary fat content alters insulin‐mediated glucose metabolism in healthy men. Am J Clin Nutr 73, 554–559. [DOI] [PubMed] [Google Scholar]
- Bisschop PH, Pereira Arias AM, Ackermans MT, Endert E, Pijl H, Kuipers F, Meijer AJ, Sauerwein HP & Romijn JA (2000). The effects of carbohydrate variation in isocaloric diets on glycogenolysis and gluconeogenesis in healthy men. J Clin Endocrinol Metab 85, 1963–1967. [DOI] [PubMed] [Google Scholar]
- Borg G (1970). Perceived exertion as an indicator of somatic stress. Scand J Rehabil Med 2, 92–98. [PubMed] [Google Scholar]
- Browning JD & Burgess SC (2012). Use of (2)H(2)O for estimating rates of gluconeogenesis: determination and correction of error due to transaldolase exchange. Am J Physiol Endocrinol Metab 303, E1304–E1312. [DOI] [PMC free article] [PubMed] [Google Scholar]
- Cameron‐Smith D, Burke LM, Angus DJ, Tunstall RJ, Cox GR, Bonen A, Hawley JA & Hargreaves M (2003). A short‐term, high‐fat diet up‐regulates lipid metabolism and gene expression in human skeletal muscle. Am J Clin Nutr 77, 313–318. [DOI] [PubMed] [Google Scholar]
- Cermak NM & van Loon LJ (2013). The use of carbohydrates during exercise as an ergogenic aid. Sports Med 43, 1139–1155. [DOI] [PubMed] [Google Scholar]
- Chacko SK & Sunehag AL (2010). Gluconeogenesis continues in premature infants receiving total parenteral nutrition. Arch Dis Child Fetal Neonatal Ed 95, F413–F418. [DOI] [PubMed] [Google Scholar]
- Chacko SK, Sunehag AL, Sharma S, Sauer PJ & Haymond MW (2008). Measurement of gluconeogenesis using glucose fragments and mass spectrometry after ingestion of deuterium oxide. J Appl Physiol (1985) 104, 944–951. [DOI] [PubMed] [Google Scholar]
- Chen X, Iqbal N & Boden G (1999). The effects of free fatty acids on gluconeogenesis and glycogenolysis in normal subjects. J Clin Invest 103, 365–372. [DOI] [PMC free article] [PubMed] [Google Scholar]
- Chung ST, Chacko SK, Sunehag AL & Haymond MW (2015). Measurements of gluconeogenesis and glycogenolysis: a methodological review. Diabetes 64, 3996–4010. [DOI] [PMC free article] [PubMed] [Google Scholar]
- Consoli A, Nurjhan N, Reilly JJ, Jr. , Bier DM & Gerich JE (1990). Contribution of liver and skeletal muscle to alanine and lactate metabolism in humans. Am J Physiol Endocrinol Metab 259, E677–E684. [DOI] [PubMed] [Google Scholar]
- Coyle EF (1991). Timing and method of increased carbohydrate intake to cope with heavy training, competition and recovery. J Sports Sci 9, 29–52. [DOI] [PubMed] [Google Scholar]
- Coyle EF, Coggan AR, Hemmert MK & Ivy JL (1986). Muscle glycogen utilization during prolonged strenuous exercise when fed carbohydrate. J Appl Physiol (1985) 61, 165–172. [DOI] [PubMed] [Google Scholar]
- Cutler DL, Gray CG, Park SW, Hickman MG, Bell JM & Kolterman OG (1995). Low‐carbohydrate diet alters intracellular glucose metabolism but not overall glucose disposal in exercise‐trained subjects. Metabolism 44, 1264–1270. [DOI] [PubMed] [Google Scholar]
- Emhoff CA, Messonnier LA, Horning MA, Fattor JA, Carlson TJ & Brooks GA (2013). Gluconeogenesis and hepatic glycogenolysis during exercise at the lactate threshold. J Appl Physiol (1985) 114, 297–306. [DOI] [PMC free article] [PubMed] [Google Scholar]
- Evans WJ, Phinney SD & Young VR (1982). Suction applied to a muscle biopsy maximizes sample size. Med Sci Sports Exerc 14, 101–102. [PubMed] [Google Scholar]
- Febbraio MA, Hiscock N, Sacchetti M, Fischer CP & Pedersen BK (2004). Interleukin‐6 is a novel factor mediating glucose homeostasis during skeletal muscle contraction. Diabetes 53, 1643–1648. [DOI] [PubMed] [Google Scholar]
- Frayn KN (1983). Calculation of substrate oxidation rates in vivo from gaseous exchange. J Appl Physiol Respir Environ Exerc Physiol 55, 628–634. [DOI] [PubMed] [Google Scholar]
- Glew RH (2010). You can get there from here: acetone, anionic ketones and even‐carbon fatty acids can provide substrates for gluconeogenesis. Niger J Physiol Sci 25, 2–4. [PubMed] [Google Scholar]
- Goedecke JH, Christie C, Wilson G, Dennis SC, Noakes TD, Hopkins WG & Lambert EV (1999). Metabolic adaptations to a high‐fat diet in endurance cyclists. Metabolism 48, 1509–1517. [DOI] [PubMed] [Google Scholar]
- Gustavson SM, Chu CA, Nishizawa M, Farmer B, Neal D, Yang Y, Vaughan S, Donahue EP, Flakoll P & Cherrington AD (2003). Glucagon's actions are modified by the combination of epinephrine and gluconeogenic precursor infusion. Am J Physiol Endocrinol Metab 285, E534–E544. [DOI] [PubMed] [Google Scholar]
- Hagberg JM, Coyle EF, Carroll JE, Miller JM, Martin WH & Brooke MH (1982). Exercise hyperventilation in patients with McArdle's disease. J Appl Physiol Respir Environ Exerc Physiol 52, 991–994. [DOI] [PubMed] [Google Scholar]
- Havemann L, West SJ, Goedecke JH, Macdonald IA, St Clair Gibson A, Noakes TD & Lambert EV (2006). Fat adaptation followed by carbohydrate loading compromises high‐intensity sprint performance. J Appl Physiol (1985) 100, 194–202. [DOI] [PubMed] [Google Scholar]
- Helge JW, Richter EA & Kiens B (1996). Interaction of training and diet on metabolism and endurance during exercise in man. J Physiol 492 (Pt 1), 293–306. [DOI] [PMC free article] [PubMed] [Google Scholar]
- Helge JW, Watt PW, Richter EA, Rennie MJ & Kiens B (2001). Fat utilization during exercise: adaptation to a fat‐rich diet increases utilization of plasma fatty acids and very low density lipoprotein‐triacylglycerol in humans. J Physiol 537, 1009–1020. [DOI] [PMC free article] [PubMed] [Google Scholar]
- Hooper L, Summerbell CD, Higgins JP, Thompson RL, Clements G, Capps N, Davey S, Riemersma RA & Ebrahim S (2001). Reduced or modified dietary fat for preventing cardiovascular disease. Cochrane Database Syst Rev 7, CD002137. [DOI] [PubMed] [Google Scholar]
- Jacobs I (1981). Lactate, muscle glycogen and exercise performance in man. Acta Physiol Scand Suppl 495, 1–35. [PubMed] [Google Scholar]
- Jakobsen MU, O'Reilly EJ, Heitmann BL, Pereira MA, Balter K, Fraser GE, Goldbourt U, Hallmans G, Knekt P, Liu S, Pietinen P, Spiegelman D, Stevens J, Virtamo J, Willett WC & Ascherio A (2009). Major types of dietary fat and risk of coronary heart disease: a pooled analysis of 11 cohort studies. Am J Clin Nutr 89, 1425–1432. [DOI] [PMC free article] [PubMed] [Google Scholar]
- Janssen I, Heymsfield SB, Wang ZM & Ross R (2000). Skeletal muscle mass and distribution in 468 men and women aged 18–88 yr. J Appl Physiol (1985) 89, 81–88. [DOI] [PubMed] [Google Scholar]
- Jansson E & Kaijser L (1982). Effect of diet on the utilization of blood‐borne and intramuscular substrates during exercise in man. Acta Physiol Scand 115, 19–30. [DOI] [PubMed] [Google Scholar]
- Jensen MD, Ekberg K & Landau BR (2001). Lipid metabolism during fasting. Am J Physiol Endocrinol Metab 281, E789–E793. [DOI] [PubMed] [Google Scholar]
- Jeukendrup AE, Wagenmakers AJ, Stegen JH, Gijsen AP, Brouns F & Saris WH (1999). Carbohydrate ingestion can completely suppress endogenous glucose production during exercise. Am J Physiol Endocrinol Metab 276, E672–E683. [DOI] [PubMed] [Google Scholar]
- Jeukendrup AE & Wallis GA (2005). Measurement of substrate oxidation during exercise by means of gas exchange measurements. Int J Sports Med 26 Suppl 1, S28–S37. [DOI] [PubMed] [Google Scholar]
- Kipnis V, Subar AF, Midthune D, Freedman LS, Ballard‐Barbash R, Troiano RP, Bingham S, Schoeller DA, Schatzkin A & Carroll RJ (2003). Structure of dietary measurement error: results of the OPEN biomarker study. Am J Epidemiol 158, 14–21; discussion 22‐16. [DOI] [PubMed] [Google Scholar]
- Klover PJ & Mooney RA (2004). Hepatocytes: critical for glucose homeostasis. Int J Biochem Cell Biol 36, 753–758. [DOI] [PubMed] [Google Scholar]
- Lambert EV, Speechly DP, Dennis SC & Noakes TD (1994). Enhanced endurance in trained cyclists during moderate intensity exercise following 2 weeks adaptation to a high fat diet. Eur J Appl Physiol Occup Physiol 69, 287–293. [DOI] [PubMed] [Google Scholar]
- Lamberts RP, Swart J, Woolrich RW, Noakes TD & Lambert MI (2009). Measurement error associated with performance testing in well‐trained cyclists : application to the precision of monitoring changes in training status. International SportMed Journal 10, 33–44. [Google Scholar]
- Landau BR, Fernandez CA, Previs SF, Ekberg K, Chandramouli V, Wahren J, Kalhan SC & Brunengraber H (1995). A limitation in the use of mass isotopomer distributions to measure gluconeogenesis in fasting humans. Am J Physiol Endocrinol Metab 269, E18–E26. [DOI] [PubMed] [Google Scholar]
- Landau BR, Wahren J, Chandramouli V, Schumann WC, Ekberg K & Kalhan SC (1996). Contributions of gluconeogenesis to glucose production in the fasted state. J Clin Invest 98, 378–385. [DOI] [PMC free article] [PubMed] [Google Scholar]
- Macfarlane DJ (2001). Automated metabolic gas analysis systems: a review. Sports Med 31, 841–861. [DOI] [PubMed] [Google Scholar]
- Meyer C, Stumvoll M, Dostou J, Welle S, Haymond M & Gerich J (2002). Renal substrate exchange and gluconeogenesis in normal postabsorptive humans. Am J Physiol Endocrinol Metab 282, E428–E434. [DOI] [PubMed] [Google Scholar]
- Miller BF, Fattor JA, Jacobs KA, Horning MA, Suh SH, Navazio F & Brooks GA (2002). Metabolic and cardiorespiratory responses to ‘the lactate clamp’. Am J Physiol Endocrinol Metab 283, E889–E898. [DOI] [PubMed] [Google Scholar]
- Moshfegh AJ, Rhodes DG, Baer DJ, Murayi T, Clemens JC, Rumpler WV, Paul DR, Sebastian RS, Kuczynski KJ, Ingwersen LA, Staples RC & Cleveland LE (2008). The US Department of Agriculture Automated Multiple‐Pass Method reduces bias in the collection of energy intakes. Am J Clin Nutr 88, 324–332. [DOI] [PubMed] [Google Scholar]
- Nilsson LH & Hultman E (1973). Liver glycogen in man–the effect of total starvation or a carbohydrate‐poor diet followed by carbohydrate refeeding. Scand J Clin Lab Invest 32, 325–330. [DOI] [PubMed] [Google Scholar]
- Nuttall FQ, Ngo A & Gannon MC (2008). Regulation of hepatic glucose production and the role of gluconeogenesis in humans: is the rate of gluconeogenesis constant? Diabetes Metab Res Rev 24, 438–458. [DOI] [PubMed] [Google Scholar]
- Paoli A, Bosco G, Camporesi EM & Mangar D (2015). Ketosis, ketogenic diet and food intake control: a complex relationship. Front Psychol 6, 27. [DOI] [PMC free article] [PubMed] [Google Scholar]
- Paoli A, Rubini A, Volek JS & Grimaldi KA (2013). Beyond weight loss: a review of the therapeutic uses of very‐low‐carbohydrate (ketogenic) diets. Eur J Clin Nutr 67, 789–796. [DOI] [PMC free article] [PubMed] [Google Scholar]
- Passonneau JV & Lauderdale VR (1974). A comparison of three methods of glycogen measurement in tissues. Anal Biochem 60, 405–412. [DOI] [PubMed] [Google Scholar]
- Phinney SD, Bistrian BR, Evans WJ, Gervino E & Blackburn GL (1983). The human metabolic response to chronic ketosis without caloric restriction: preservation of submaximal exercise capability with reduced carbohydrate oxidation. Metabolism 32, 769–776. [DOI] [PubMed] [Google Scholar]
- Previs SF, Cline GW & Shulman GI (1999). A critical evaluation of mass isotopomer distribution analysis of gluconeogenesis in vivo. Am J Physiol Endocrinol Metab 277, E154–E160. [DOI] [PubMed] [Google Scholar]
- Previs SF, Fernandez CA, Yang D, Soloviev MV, David F & Brunengraber H (1995). Limitations of the mass isotopomer distribution analysis of glucose to study gluconeogenesis. Substrate cycling between glycerol and triose phosphates in liver. J Biol Chem 270, 19806–19815. [DOI] [PubMed] [Google Scholar]
- Roden M, Stingl H, Chandramouli V, Schumann WC, Hofer A, Landau BR, Nowotny P, Waldhausl W & Shulman GI (2000). Effects of free fatty acid elevation on postabsorptive endogenous glucose production and gluconeogenesis in humans. Diabetes 49, 701–707. [DOI] [PubMed] [Google Scholar]
- Romijn JA, Coyle EF, Sidossis LS, Gastaldelli A, Horowitz JF, Endert E & Wolfe RR (1993). Regulation of endogenous fat and carbohydrate metabolism in relation to exercise intensity and duration. Am J Physiol Endocrinol Metab 265, E380–E391. [DOI] [PubMed] [Google Scholar]
- Rowell LB, Blackmon JR & Bruce RA (1964). Indocyanine green clearance and estimated hepatic blood flow during mild to maximal exercise in upright man. J Clin Invest 43, 1677–1690. [DOI] [PMC free article] [PubMed] [Google Scholar]
- Rowlands DS & Hopkins WG (2002). Effects of high‐fat and high‐carbohydrate diets on metabolism and performance in cycling. Metabolism 51, 678–690. [DOI] [PubMed] [Google Scholar]
- Stellingwerff T, Spriet LL, Watt MJ, Kimber NE, Hargreaves M, Hawley JA & Burke LM (2006). Decreased PDH activation and glycogenolysis during exercise following fat adaptation with carbohydrate restoration. Am J Physiol Endocrinol Metab 290, E380–E388. [DOI] [PubMed] [Google Scholar]
- Stingl H, Krssak M, Krebs M, Bischof MG, Nowotny P, Furnsinn C, Shulman GI, Waldhausl W & Roden M (2001). Lipid‐dependent control of hepatic glycogen stores in healthy humans. Diabetologia 44, 48–54. [DOI] [PubMed] [Google Scholar]
- Sumida KD, Urdiales JH & Donovan CM (2006). Lactate delivery (not oxygen) limits hepatic gluconeogenesis when blood flow is reduced. Am J Physiol Endocrinol Metab 290, E192–E198. [DOI] [PubMed] [Google Scholar]
- Trimmer JK, Schwarz JM, Casazza GA, Horning MA, Rodriguez N & Brooks GA (2002). Measurement of gluconeogenesis in exercising men by mass isotopomer distribution analysis. J Appl Physiol (1985) 93, 233–241. [DOI] [PubMed] [Google Scholar]
- van Loon LJ, Greenhaff PL, Constantin‐Teodosiu D, Saris WH & Wagenmakers AJ (2001). The effects of increasing exercise intensity on muscle fuel utilisation in humans. J Physiol 536, 295–304. [DOI] [PMC free article] [PubMed] [Google Scholar]
- Volek JS, Freidenreich DJ, Saenz C, Kunces LJ, Creighton BC, Bartley JM, Davitt PM, Munoz CX, Anderson JM, Maresh CM, Lee EC, Schuenke MD, Aerni G, Kraemer WJ & Phinney SD (2016). Metabolic characteristics of keto‐adapted ultra‐endurance runners. Metabolism 65, 100–110. [DOI] [PubMed] [Google Scholar]
- Volek JS, Noakes T & Phinney SD (2015). Rethinking fat as a fuel for endurance exercise. Eur J Sport Sci 15, 13–20. [DOI] [PubMed] [Google Scholar]
- Wahren J, Felig P, Ahlborg G & Jorfeldt L (1971). Glucose metabolism during leg exercise in man. J Clin Invest 50, 2715–2725. [DOI] [PMC free article] [PubMed] [Google Scholar]
- Wolfe R (1992). Radioactive and Stable Isotope Tracers in Biomedicine: Principles and Practice of Kinetic Analysis. Wiley‐Liss, New York, NY. [Google Scholar]
- Zajac A, Poprzecki S, Maszczyk A, Czuba M, Michalczyk M & Zydek G (2014). The effects of a ketogenic diet on exercise metabolism and physical performance in off‐road cyclists. Nutrients 6, 2493–2508. [DOI] [PMC free article] [PubMed] [Google Scholar]
- Zderic TW, Davidson CJ, Schenk S, Byerley LO & Coyle EF (2004). High‐fat diet elevates resting intramuscular triglyceride concentration and whole body lipolysis during exercise. Am J Physiol Endocrinol Metab 286, E217–E225. [DOI] [PubMed] [Google Scholar]