

Abstract
Key points
Maternal obesity reduces adipogenic progenitor density in offspring adipose tissue.
The ability of adipose tissue expansion in the offspring of obese mothers is limited and is associated with metabolic dysfunction of adipose tissue when challenged with a high‐fat diet.
Maternal obesity induces DNA demethylation in the promoter of zinc finger protein 423, which renders progenitor cells with a high adipogenic capacity.
Maternal obesity demonstrates long‐term effects on the adipogenic capacity of progenitor cells in offspring adipose tissue, demonstrating a developmental programming effect.
Abstract
Maternal obesity (MO) programs offspring obesity and metabolic disorders, although the underlying mechanisms remain poorly defined. Progenitor cells are the source of new adipocytes. The present study aimed to test whether MO epigenetically predisposes adipocyte progenitors in the fat of offspring to adipogenic differentiation and subsequent depletion, which leads to a failure of adipose tissue plasticity under positive energy balance, contributing to adipose tissue metabolic dysfunction. C57BL/6 female mice were fed either a control diet (10% energy from fat) or a high‐fat diet (45% energy from fat) for 8 weeks before mating. Male offspring of control (Con) and obese (OB) dams were weaned onto a regular (Reg) or obesogenic (Obe) diet until 3 months of age. At weaning, male OB offspring had a higher expression of Zinc finger protein 423 (zfp423), a key transcription factor in adipogenesis, as well as lower DNA methylation of its promoter in progenitors of epididymal fat compared to Con offspring, which was correlated with enhanced adipogenic differentiation. At 3 months of age, progenitor density was 30.9 ± 9.7% lower in OB/Obe compared to Con/Obe mice, accompanied by a limited expansion of the adipocyte number when challenged with a high‐energy diet. This difference was associated with lower DNA methylation in the zfp423 promoter in the epididymal fat of OB/Obe offspring, which was correlated with greater macrophage chemotactic protein‐1 and hypoxia‐inducible factor 1α expression. In summary, MO epigenetically limits the expansion capacity of offspring adipose tissue, providing an explanation for the adipose metabolic dysfunction of male offspring in the setting of MO.
Key points
Maternal obesity reduces adipogenic progenitor density in offspring adipose tissue.
The ability of adipose tissue expansion in the offspring of obese mothers is limited and is associated with metabolic dysfunction of adipose tissue when challenged with a high‐fat diet.
Maternal obesity induces DNA demethylation in the promoter of zinc finger protein 423, which renders progenitor cells with a high adipogenic capacity.
Maternal obesity demonstrates long‐term effects on the adipogenic capacity of progenitor cells in offspring adipose tissue, demonstrating a developmental programming effect.
Abbreviations
- aP2
adipocyte protein 2
- EpiWAT
epididymal white adipose tissue
- H&E
haemotoxylin and eosin
- IL‐6
interleukin‐6
- IngWAT
inguinal white adipose tissue
- MCP
macrophage chemotactic protein
- MO
maternal obesity
- PDGFRα
plate‐derived growth factor receptor α
- Pref1
preadipocyte factor 1
- PPARγ
peroxisome proliferator‐activated receptor γ
- SVFs
stromal‐vascular fractions
- TNF
tumor necrosis factor
- zfp423
zinc finger protein 423
Introduction
According to the latest NHANES (National Health and Nutrition Examination Survey) in 2009 to 2010, 31.9% of non‐pregnant women of childbearing age (aged 20–39 years) in the USA are obese, and another one‐third are overweight (Flegal et al. 2012). In addition, there is a shift towards higher gestational weight gain, reflecting the prevalence of excessive nutrient intake during gestation in affluent countries (Waters et al. 2012). Maternal obesity (MO) in combination with an obesogenic diet can program harmful, persistent metabolic dysfunction in offspring, including pre‐disposition to obesity and type 2 diabetes mellitus (Blackmore et al. 2014; Desai et al. 2015; Patel et al. 2015). Obesity now affects 17% of children in the USA, tripling the rate from just one generation ago (Ogden et al. 2010), and is accompanied by increased rates of childhood metabolic diseases (Biro & Wien, 2010; Shasa et al. 2015). The causative mechanisms for this maternal programming influence on offspring remain poorly defined.
Major adipose tissue development occurs between late gestation to 4 weeks of postnatal age in rodents (Greenwood & Hirsch, 1974), although, to some extent, adipose tissue of both humans and rodents remains expandable later in life (Greenwood & Hirsch, 1974; Spalding et al. 2008). Adipocyte hyperplasia largely ceases at adolescence (Spalding et al. 2008). Thus, the major development of adipose tissue coincides with plastic periods of pregnancy and lactation, when MO probably programs permanent changes in properties of offspring adipose tissue. In agreement with this concept, previous studies have shown that maternal adiposity correlates with offspring adiposity in rodents (Shankar et al. 2008) and human neonates (Modi et al. 2011).
White adipocytes are derived from platelet‐derived growth factor receptor α (PDGFRα) positive cells, which are the putative progenitors for adipogenesis (Lee & Granneman, 2012; Lee et al. 2012; Berry & Rodeheffer, 2013). During adipocyte development, progenitors first commit to becoming preadipocytes and then further differentiate into adipocytes. Progenitors and pre‐adipocytes are the source of adipocytes needed for adipocyte hyperplasia and turnover (Spalding et al. 2008). The ‘adipose tissue expandability hypothesis’ proposes that insufficient availability of precursor to enable increased adipogenesis when challenged with high‐energy diet limits adipocyte hyperplasia and hampers replacement of dead adipocytes. Thus, existing adipocytes undergo hypertrophy to accommodate lipids, eliciting hypoxia and inflammation; excessive lipids beyond the storage capacity of adipose tissue accumulate in other tissues, such as skeletal muscle and liver, resulting in insulin resistance and metabolic dysfunction (Tchkonia et al. 2010; Virtue & Vidal‐Puig, 2010). Thus, maintaining an effective pool of progenitors for adipose expansion and adipocyte replacement is critical for life‐course adipose tissue health (Grey & Vidal‐Puig, 2007; Zeve et al. 2009).
Peroxisome proliferator‐activated receptor γ (PPARγ) is a crucial transcription factor that is necessary to induce late stage adipogenesis: the conversion of preadipocytes to adipocytes (Vernochet et al. 2009). Recently, zinc finger protein 423 (zfp423) was identified as a key regulator of the commitment of progenitors to become preadipocytes. Zfp423 promotes PPARγ expression and adipogenic differentiation (Gupta et al. 2010; Gupta et al. 2012). We previously observed that MO reduces DNA methylation in the zfp423 promoter, which is correlated with enhanced zfp423 expression and progenitor adipogenesis in fetal mouse tissue (Yang et al. 2013). Because DNA methylation is relatively stable, we hypothesized that MO stably elevates zfp423 expression, thereby predisposing progenitors to premature adipogenic differentiation in offspring adipose tissue. As a result, the adipose tissue of MO offspring has an impaired ability to maintain the progenitor pool. This premature differentiation of offspring progenitor cells limits the corresponding adipose tissue expandability, especially when fed a high‐energy diet, leading to adipocyte hypertrophy, a cause of hypoxia and inflammation.
Visceral fat metabolic dysfunction is well correlated with the incidence of diabetes. Therefore, our studies focus on the epididymal fat, a depot that is most commonly used to study the properties of visceral fat in mice (Garin‐Shkolnik et al. 2014; Yi et al. 2014; van Beek et al. 2015). Our findings show that MO epigenetically programs offspring adipose tissue progenitors to premature adipogenic differentiation, reducing progenitor density in offspring adipose tissue and their ability to expand when challenged with a high‐energy diet.
Methods
Ethical approval
Animal studies were conducted in AAALAC‐approved facilities and according to protocols approved by the Institutional Animal Use and Care Committee (IAUCC) of Washington State University. To obtain obese mice, female C57BL/6 mice at 4 weeks of age were fed ad libitum either a control diet (n = 15) (kcal: 10% energy from fat, 20% from protein and 70% from carbohydrate; D12450H; Research Diets, New Brunswick, NJ, USA) or an obesogenic diet (n = 18) (OB; kcal: 45% from fat, 20% from protein and 35% from carbohydrate; D12451; Research Diets) for 8 weeks. Mice were maintained under 12:12 h light/dark cycle with access ad libitum to water and food. Females were mated with proven breeder males fed the control diet. During pregnancy and lactation, maternal mice continued to eat their prepregnancy diet. On postnatal day 1, litters were culled to six pups to ensure the even delivery of maternal nutrition. Mice with litter size less than six pups were excluded from the study. Pups were weaned at postnatal day 21 (P21). Next, two male pups per dam were randomly separated into two subgroups: one pup fed with a regular diet (Reg) and another pup with the same obesogenic diet fed to the maternal OB mice (to avoid confusion, abbreviated as ‘Obe’) until 3 months of age, which generated four treatment groups: Con/Reg, OB/Reg, Con/Obe and OB/Obe. The food intake and daily energy intake of mice were recorded as described previously (Shankar et al. 2008). At the end of treatment, mice were killed by carbon dioxide inhalation and cervical dislocation. Except for special indication, we used epididymal white adipose tissue (EpiWAT) of male offspring for experiments.
Intraperitoneal glucose tolerance test and blood characteristics
The glucose tolerance test was performed as described previously with minor modification (Tong et al. 2011). Following 6 h of fasting, 3‐month‐old offspring were administered 2 g kg−1 d‐glucose diluted in sterilized water. The blood samples were collected from the tail vein at 0, 15, 30, 60 and 120 min post injection and the glucose concentration was measured by means of the glucose oxidase method using a glucose meter (Bayer Contour, Tarrytown, NY, USA). Blood insulin levels were measured using a Mouse Ultrasensitive Insulin ELISA Kit (catalogue no. 80‐INSMSU‐E10; ALPCO Diagnostics, Salem, NH, USA) and triglyceride was measured using triglyceride colourimetric assay kit (catalogue no. 10010303; Cayman, Ann Arbor, MI, USA).
Quantitative real‐time PCR
Total RNAs were extracted using TRIzol (Life Technologies, Grand Island, NY, USA) and cDNA was synthesized from 500 ng of total RNA using an iScript™ cDNA Synthesis Kit (Bio‐Rad, Hercules, CA, USA) in accordance with the manufacturer's instructions. Quantitative real‐time PCR was conducted as described previously with 18S rRNA used as a reference (Fu et al. 2013). All primers are listed in Table 1.
Table 1.
The primer sequences used for real‐time quantitative PCR
| Gene | Forward (5′ to 3′) | Reverse (5′ to 3′) | Size (bp) | Accession number |
|---|---|---|---|---|
| 18s | GTAACCCGTTGAACCCCATT | CCATCCAATCGGTAGTAGCG | 151 | NC_000083.6 |
| aP2 | CGACAGGAAGGTGAAGAGCATCATA | CATAAACTCTTGTGGAAGTCACGCCT | 158 | NM_024406.2 |
| HIF‐1α | CGGCGAGAACGAGAAGAAAAAGA | ATCTGTGCCTTCATCTCATCTTCA | 249 | NM_010431.2 |
| IL‐6 | GCTGGTGACAACCACGGCCT | AGCCTCCGACTTGTGAAGTGGT | 107 | NM_031168.1 |
| TNFα | TGGGACAGTGACCTGGACTGT | TTCGGAAAGCCCATTTGAGT | 67 | NM_001278601.1 |
| MCP1 | GCAGTTAACGCCCCACTCA | CCCAGCCTACTCATTGGGATCA | 68 | NM_011333.3 |
| PPARg2 | AGCTCCAAGAATACCAAAGTGCGAT | AGGTTCTTCATGAGGCCTGTTGTAGA | 98 | XM_006505744.1 |
| PDGFRα | GGACTTACCCTGGAGAAGTGAGAA | ACACCAGTTTGATGGATGGGA | 78 | XM_006504263.2 |
| Pref1 | TGACAATGTCTGCAGGTGCCAT | TATTTCGCAGAATTTCCCGTCC | 145 | XM_006515457.2 |
| Zfp423 | GTCACCAGTGCCCAGGAAGAAGAC | AACATCTGGTTGCACAGTTTACACTCAT | 144 | XM_006531540.1 |
Immunoblotting analysis
Immunoblotting analyses were carried out as described previously (Yang et al. 2013). Polyclonal rabbit antibody against zfp423 (catalogue no. sc‐48785) was purchased from Santa Cruz Biotech (Dallas, TX, USA) and was diluted 1:400. Tubulin antibody (catalogue no. 3873) was purchased from Cell Signalling (Danvers, MA, USA) and was diluted 1:1000. IRDye 800CW goat anti‐rabbit (catalogue no. 926‐32211) and IRDye 680 goat anti‐mouse (catalogue no. 926‐68070) secondary antibodies were purchased from LI‐COR Biosciences (Lincoln, NE, USA) and were diluted 1:15,000.
Isolation of stromal‐vascular cells, cell sorting, in vitro differentiation and Oil‐Red O staining
Cells in the stromal‐vascular fractions (SVFs) of adipose tissue were obtained as described previously (Huang et al. 2012). Cell surface markers CD45 (catalogue no. 103114; BioLegend, San Diego, CA, USA) and PDGFRα (catalogue no. 135908; BioLegend) were used to separate progenitor cells from SVFs by flow cytometry. CD45–/PDGFRα+ cells were sorted and harvested. Induction of adipogenic differentiation was conducted as reported previously (Huang et al. 2012).
Plasmid transfection
Plasmids pMSCVFLAG‐zfp423 (catalogue no. 24764) and pMKO.1‐zfp423 (catalogue no. 35972) from Addgene (Cambridge, MA, USA) were used for overexpression or knockdown of zfp423 as described previously (Yang et al. 2013).
Bisulphite pyrosequencing
Fetal tissue samples were collected as reported previously (Yang et al. 2013). Briefly, fetuses were dissected from the uterus and then the fetal head, heart, lung, liver, surface gelatinous tissue, spinal cord and primordial bones were removed under a dissection microscope. Genomic DNA was isolated from fetal tissue and epididymal adipose tissue using a genomic DNA isolation kit (Qiagen, Redwood City, CA, USA) and 300 ng of genomic DNA was used for bisulphite modification. Bisulphite modification was performed using an EZ DNA methylation‐direct kit (catalogue no. D5021; Zymo Research, Irvine, CA, USA). Then, 2 μl of converted genomic DNA was used as the template to amplify the target sequence. The Biotinylated PCR primers were designed to cover 12 CpG sites located between –982 and –908 bp from ATG and –622 to –548 bp from the transcription start site) (Ensembl Transcript ID: ENSMUST00000109655). Hotstar Taq Polymerase (Qiagen) was used for PCR amplification. The PCR cycling conditions were 95 °C for 15 min, followed by 45 × (95 °C for 30 s, 61 °C for 30 s and 72 °C for 30 s), ending with 72 °C for 5 min. Amplicon size was confirmed by electrophoresis. PCR products were sent to EpigenDx (Hopkinton, MA, USA) for pyrosequencing as described previously (Tost & Gut, 2007).
Histochemical staining, adipocyte and progenitor cell quantification
Paraffin‐embedded fat tissues were cut to a thickness of 5 μm and subjected to haemotoxylin and eosin (H&E) staining (Yan et al. 2010). Adipocye calculations were conducted based on a method described previously (Parlee et al. 2014). Images of H&E‐stained sections were acquired using an EVOS microscope (Advanced Microscopy Group, Bothell, WA, USA). Four to six images per section and four sections from each individual mouse were acquired. For quantification, the longest and shortest diameters were measured on the images using Image‐Pro Plus, version 6.0 (Media Cybernetics, Inc., Rockville, MD, USA) and the average was used for the calculations. Then, adipocyte volume was calculated based on the average adipocyte diameter. The adipocyte number of each fat depot was further calculated by dividing the fat mass by the average adipocyte volume. The expansion ratio of the adipocyte number was calculated by dividing the adipocyte number of the epididymal fat of 3‐month‐old offspring by that of P21 offspring. The relative pool sizes of PDGFRα positive cells were calculated by multiplying SVF density by the percentage of PDGFRα positive cells obtained via flow cytometry analyses. To obtain the relative SVF density, interstitial 4′,6‐diamidino‐2‐phenylindole positive cells were counted. The relative PDGFRα positive cell density was calculated by dividing the pool size of PDGFRα positive cells by the adipose tissue volume.
Statistical analysis
For cell‐related studies, three independent experiments were carried out. For the animal study, each offspring mouse of the same treatment derived from a separate dam was considered as an experimental unit. Data are presented as the mean ± SEM. Data from P21 mice were analysed using an unpaired Student's t test and those from 3‐month‐old mice were analysed using two‐way ANOVA and Tukey's multiple comparison test. P < 0.05 was considered statistically significant.
Results
Body composition and adipose tissue characteristics of Con and OB offspring at weaning and 3 months of age
At mating, the body weight of OB dams was heavier than that of Con dams (Con vs. OB: 20.9 ± 0.37 vs. 27.1 ± 0.71 g; P < 0.0001). The concentrations of blood glucose (135 ± 5.3 vs. 158 ± 6.4 mg dl–1; P < 0.05), insulin (1.2 ± 0.02 vs. 1.8 ± 0.11 ng/ml; P < 0.001) and triglyceride (85 ± 3.1 vs. 98 ± 3.1 mg dl–1; P < 0.01) were higher in OB compared to Con dams. The birth weight of OB neonates was higher than that of Con neonates (Con vs. OB: 1.2 ± 0.01 vs. 1.3 ± 0.02 g; P < 0.01).
At weaning (P21), OB offspring were heavier than Con offspring (P < 0.0001) (Fig. 1 A). The EpiWAT of OB offspring (Con vs. OB; 35 ± 3.1 vs. 91 ± 3.3 mg; P < 0.0001) was much larger compared to Con offspring, as also was the case for inguinal white adipose tissue (IngWAT) (Con vs. OB; 90 ± 4.0 vs. 157 ± 4.9 mg; P < 0.0001). The difference in mass of EpiWAT and IngWAT was maintained after normalization for body weight (P < 0.0001) (Fig. 1 B). When stained with H&E, OB adipose tissue had more abundant adipocytes with larger diameters (Fig. 1 C). In brief, MO increased offspring fat mass, especially for the visceral fat at weaning.
Figure 1. Body weight and adipose tissue characteristics of offspring of Con and OB dams at weaning (A–C) and at 3 months of age (D–J) .
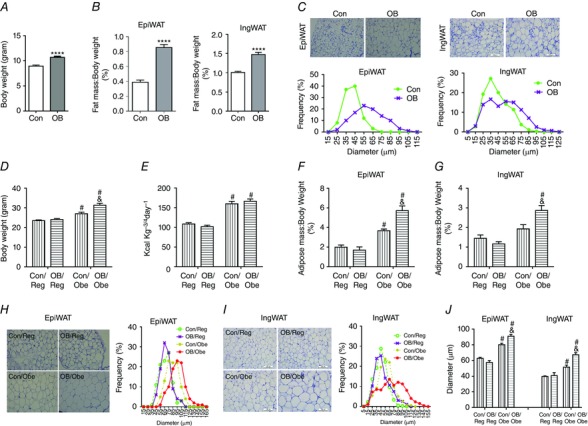
A, body weight of offspring of Con and OB dams at weaning (P21) (Con: n = 13; OB: n = 7). B, fat index (percentage of fat weight normalized to the body weight) of EpiWAT and IngWAT of offspring at P21 (Con: n = 13; OB: n = 7). C, representative images of H&E staining and adipocyte distribution of EpiWAT and IngWAT at P21. D and E, body weight (D) and caloric intake (E) of Con and OB offspring weaned on regular or obesogenic diets (n = 6). F and G, fat index of EpiWAT (F) and IngWAT (G) of 3‐month‐old offspring (n = 6). H and I, representative images of H&E staining and adipocyte distribution of EpiWAT (H) and IngWAT (I) of offspring at 3 months of age. J, average diameters of adipocytes in EpiWAT and IngWAT of offspring at 3 months of age. Data are expressed as the mean ± SEM. For offspring at weaning: ****P < 0.0001 vs. Con as determined using Student's t test. For 3‐month‐old offspring: & P < 0.05 vs. Con within the same post‐weaning diet and # P < 0.05 vs. post‐weaning Reg within the same maternal diet as determined by two‐way ANOVA and Tukey's multiple comparison.
At 3 months of age, regardless of maternal treatment, the body weight of offspring on the high‐energy diet was greater than that of offsprong on a regular diet, which is consistent with their levels of energy intake (Fig. 1 D and E). MO had no effect on offspring body weight when fed a regular diet, although OB/Obe mice were heavier than Con/Obe mice with no difference in energy intake (Fig. 1 D and E). There was no difference in EpiWAT and IngWAT mass between Con/Reg and OB/Reg mice, although fat mass was greater in OB/Obe than Con/Obe mice (Fig. 1 F and G). Large adipocytes were most abundant in OB/Obe mice, followed by Con/Obe mice, with no difference between Con/Reg and OB/Reg mice (Fig. 1 H and I), which is consistent with the differences in average adipocyte diameters (Fig. 1 J). Newly‐formed adipocytes have smaller sizes; note that the OB/Obe tissue section was largely absent of small adipocytes, indicating a lower rate of de novo adipogenesis in the EpiWAT of OB/Obe mice.
Adipocyte number in adipose tissue of Con and OB offspring at weaning and 3 months of age
At weaning, the number of adipocytes in EpiWAT was greater in the offspring of obese mothers (Fig. 2 A). At 3 months of age, the number of adipocytes was increased in EpiWAT, although there was no difference among all treatments (Fig. 2 B). The number of adipocytes in EpiWAT increased by 157.2 11.52% for Con/Reg and 281.3 5.27% for Con/Obe offspring compared to the offspring of obese mothers where the number of adipocytes increased by 91.8 ± 47.03% for OB/Reg and 141.1 ± 22.02% for OB/Obe mice (Fig. 2 A and B). Consistently, Con/OB mice had the highest adipocyte expansion ratio, whereas that for OB/Obe was much lower than Con/Obe mice (P < 0.01) (Fig. 2 C). Similar changes were observed in IngWAT at weaning (Fig. 2 D), as well as at 3 months (increase of 404.2 ± 38.31% for Con/Reg and 500.4 ± 54.23% for Con/Obe) and for the offspring of obese mothers (increase of 295.8 ± 28.47% for OB/Reg and 263.1 ± 80.24% for OB/Obe) (Fig. 2 E and F). Con/Obe mice had a trend for an increase compared to OB/Obe mice (P = 0.10) (Fig. 2 F). These data demonstrate that adipocyte hyperplasia under excessive energy intake was hampered in the EpiWAT of the offspring of obese mothers, which partially explained the hypertrophy of adipocytes in OB/Obe offspring (Fig. 1 H–J).
Figure 2. Adipocyte pool in fat depots of weaning (P21) (A and D) and 3‐month‐old (B, C, E and F) offspring .
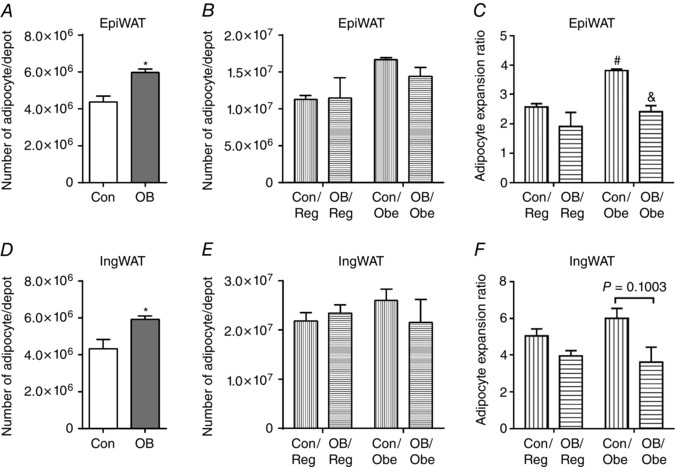
A and B, the number of adipocytes in EpiWAT at P21 (A) and at 3 months of age (B); C, adipocyte expansion in EpiWAT of 3‐month‐old offspring relative to P21 from the dams fed the same diet. D and E, number of adipocytes in IngWAT at P21 (D) and at 3 months of age (E). F, adipocyte expansion in IngWAT of 3‐month‐old offspring relative to P21 from the dams fed with the same diet. Data are expressed as the mean ± SEM (n = 6). For offspring at P21, *P < 0.05 vs. Con as determined using Student's t test. For 3‐month‐old offspring: & P < 0.05 vs. Con within the same post‐weaning diet as determined by two‐way ANOVA and Tukey's multiple comparison.
Density of progenitor cells in the epididymal fat at weaning and 3 months of age
At weaning, we sorted putative adipogenic progenitor cells in SVFs prepared from EpiWAT with cell surface markers, CD45 and PDGFRα, and did not observe any difference in the ratio of CD45–/PDGFRα+ cells between Con and OB offspring (Fig. 3 A). Constantly, the total number of progenitors in EpiWAT did not differ at weaning (Fig. 3 B). On the other hand, the density was lower in the OB group (Fig. 3 C). In agreement, there was no difference in mRNA expression of PDGFRα, nor the expression of preadipocyte factor 1 (Pref‐1), a marker of preadipocytes (Fig. 3 D).
Figure 3. Progenitor cells in epididymal fat (EpiWAT) of Con and OB offspring .
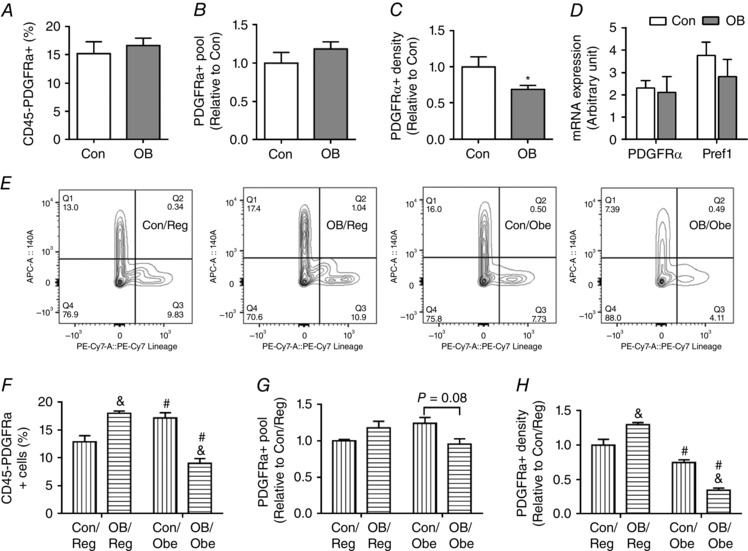
A, percentage of CD45–/PDGFRα+ cells of stromal vascular cells at P21. B, the pool size of progenitors in EpiWAT at P21. C, the density of progenitors at P21. D, mRNA expression of PDGFRα and Pref1 in EpiWAT at P21. E, representative flow cytometry data sorted by using CD45– and PDGFRα+ at 3 months of age. F, percentage of CD45–/PDGFRα+ cells at 3 months of age. G, the pool sizes of progenitors at 3 months of age. H, density of progenitors at 3 months of age. Data are expressed as the mean ± SEM (n = 6). For offspring at weaning: *P < 0.05 vs. Con as determined using Student's t test. For 3‐month‐old offspring: & P < 0.05 vs. Con within the same post‐weaning diet and # P < 0.05 vs. post‐weaning Reg within the same maternal diet as determined by two‐way ANOVA and Tukey's multiple comparison.
At 3 months of age, the ratio of CD45–/PDGFRα+ cells was dramatically lower in OB/Obe mice (∼50% less than OB/Reg and Con/Obe; P < 0.05) (Fig. 3 E and F). Because adipose tissue expansion requires the extensive proliferation and adipogenic differentiation of progenitor cells, the reduction in the ratio of CD45–/PDGFRα+ cells in OB/Obe mice was consistent with the reduction in adipose expansion capacity in these mice (Fig. 2). On the other hand, the ratio of CD45–/PDGFRα+ cells in Con/Obe mice was higher than in Con/Reg mice, indicating the expansion of progenitors (P < 0.05) (Fig. 3 E and F). We further calculated the total number of progenitors (pool size) in EpiWAT. Although there was only a trend for a difference between OB/Obe and Con/Obe mice (P = 0.08) (Fig. 3 G), the density of progenitors was lower in OB/Obe mice (P < 0.05) (Fig. 3 H). In brief, the reduction in progenitor density in OB/Obe compared to Con/Obe mice highlights the programming effects of MO on the progenitor properties of offspring under the high‐energy diet environment.
zfp423 DNA methylation and adipogenic differentiation of progenitor cells from the epididymal fat of Con and OB offspring at weaning
First, we tested the role of zfp423 in the adipogenic differentiation of progenitor cells. We separated progenitor cells (CD45–/PDGFRα+) from wild‐type mice at weaning, and transfected with plasmids to either overexpression or knockdown of zfp423. zfp423 overexpression enhanced and knockdown inhibited the adipogenic differentiation, as indicated by the expression of adipogenic markers, PPARγ and adipocyte protein 2 (aP2) (Fig. 4 A and B), confirming the critical role of zfp423 in regulating adipogenic differentiation in progenitor cells.
Figure 4. zfp423 regulated adipogenesis of progenitor cells derived from adipose tissue .
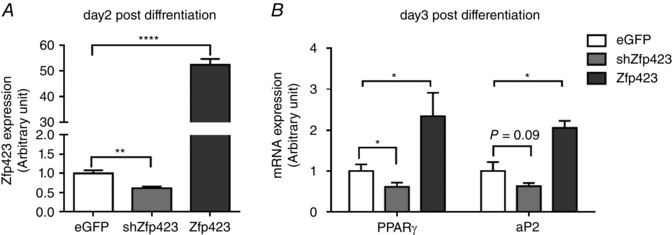
Progenitors were separated from adipose tissue of wild‐type mice at weaning and transfected with enhanced green fluorescent protein control vector, zfp423 overexpression vector or zfp423 shRNA vector, and then adipogenic differentiation was induced. A, mRNA expression of zfp423 at 2 days of adipogenic differentiation. B, mRNA expression of PPARγ and aP2 at 3 days of adipogenic differentiation. Data were analysed by a t test vs. control (n = 3; *P < 0.05; **P < 0.01; ****P < 0.0001; data are the mean ± SEM).
At weaning, zfp423 mRNA expression was ∼3‐fold higher in OB compared to Con offspring EpiWAT (Fig. 5 A). Consistently, the protein content of zfp423 was also much higher in OB offspring (Fig. 5 B). We further analysed DNA methylation in the shore area of the CpG island of the zfp423 promoter, which we previously identified to have differential methylation between control and OB fetal samples (Yang et al. 2013). Using pyrosequencing, we found that the DNA methylation in eight out of 12 CpG sites analysed was lower in OB compared to Con samples; the overall methylation was reduced (Con vs. OB; 5.5 ± 0.14% vs. 3.1 ± 0.15%; P < 0.01) (Fig. 5 C). In combination, these data clearly show that MO enhanced zfp423 expression in the EpiWAT at weaning, which is associated with lower DNA methylation in the zfp423 promoter.
Figure 5. zfp423 expression, DNA methylation of the zfp423 promoter, and differentiation of progenitors of adipose tissue and progenitor cells at weaning .
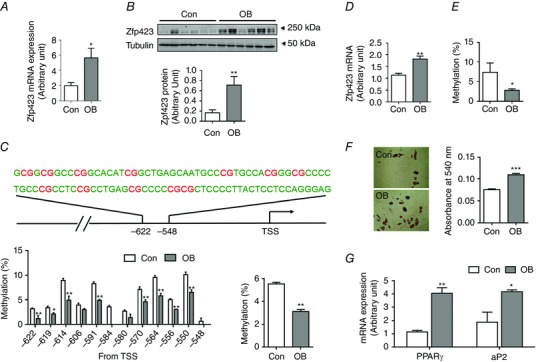
PDGFRα+/CD45– progenitors were separated by flow cytometry. A and B, zfp423 mRNA expression (A) and protein content (B) in EpiWAT (n = 6). C, DNA methylation in the zfp423 promoter of EpiWAT (12 CpG sites, highlighted in red, was measured in the zfp423 promotor, and the percentage of methylation of each site is shown, as well as the average DNA methylation) (n = 6). D, Zfp423 mRNA expression in progenitor cells. E, DNA methylation in the zfp423 promoter of progenitor cells (n = 6). F, Oil‐Red O staining of the presence of adipocytes and quantification of fat content after 8 days of adipogenic differentiation (n = 3). G, mRNA expression of adipogenic markers, PPARγ and aP2, after 8 days of adipogenic differentiation (n = 3). Data are expressed as the mean ± SEM. *P < 0.05; **P < 0.01; ***P < 0.001 vs. Con as determined using Student's t test.
To analyse specific changes in progenitor cells, we separated CD45–/PDGFRα+ progenitor cells and analysed zfp423 mRNA expression and DNA methylation in the promoter. Consistently, OB progenitor cells had much higher zfp423 mRNA expression compared to Con (Fig. 5 D), which is associated with reduced zfp423 DNA methylation (Fig. 5 E). The adipogenic differentiation was higher in OB compared to Con progenitor cells (Fig. 5 F). Correspondingly, mRNA expression of adipogenic marker genes, PPARγ and aP2, was also higher in OB cells (Fig. 5 G). Taken together, these data show that MO enhances the adipogenic differentiation of progenitor cells at weaning.
zfp423 DNA methylation and adipogenic differentiation of progenitor cells from the epididymal fat of Con and OB offspring at 3 months of age
To assess its long‐term impact, we analysed mRNA expression and the protein content of zfp423 in adipose tissue of 3‐month‐old offspring mice. Although there were no significant differences in zfp423 mRNA expression in EpiWAT, the overall trend appeared to be OB/Obe > Con/Obe > OB/Reg > Con/Reg (OB/Obe vs. Con/Reg; P = 0.06) (Fig. 6 A). OB/Obe mice had higher zfp423 protein contents compared to OB/Reg (P < 0.05) or Con/Obe (P < 0.05) mice (Fig. 6 B). In progenitor cells, OB/Obe mice had the highest zfp423 expression (Fig. 6 C). In keeping with these findings, progenitor cells of OB/Obe mice demonstrated the highest adipogenic differentiation capacity indicated both by Oil‐Red O staining (Fig. 6 D) and by mRNA expression of adipogenic markers, PPARγ and aP2 (Fig. 6 E). We then analysed DNA methylation by pyrosequencing. Indeed, the EpiWAT (Fig. 6 F) and progenitor cells (Fig. 6 G) of OB/Obe mice had lower DNA methylation in the zfp423 promoter compared to other treatments. Of note, the level of DNA methylation was less than 2% for all samples, which was much lower than the DNA methylation in the progenitors at weaning, where the DNA methylation levels were 7.3 ± 2.37% (Fig. 5 E). Consistently, the reduction of DNA methylation in the zfp423 promoter also took place during adipose tissue development. It was very low at embryonic day 13.5 (E13.5, 2.7 ± 0.76%; E13.5 vs. P21; P < 0.01), then peaked E17.5 (7.7 ± 1.01%) and was followed by a reduction to 2.9 ± 0.11% at 3 months of age (3 months vs. P21; P < 0.0001), in line with data obtained from progenitor cells and adipose tissue of 3‐month‐old offspring (Fig. 6 F and G).
Figure 6. zfp423 expression, DNA methylation of the zfp423 promoter, and differentiation of progenitors of adipose tissue and progenitor cells at 3‐month‐old offspring .
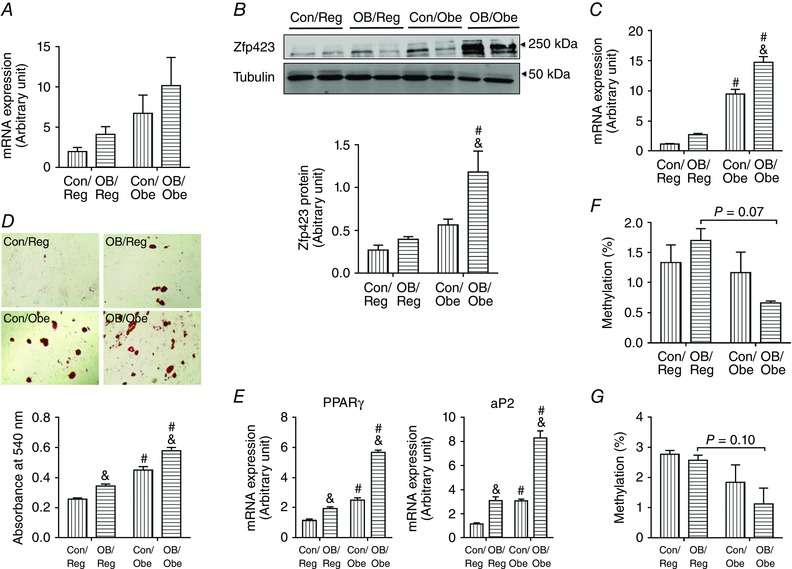
A and B, zfp423 mRNA expression (A) and protein content (B) in EpiWAT of 3‐month‐old offspring (n = 6). C, zfp423 mRNA expression in CD45–/PDGFRα+ progenitor cells (n = 6). D, Oil‐Red O staining of CD45–/PDGFRα+ progenitor cells and quantification of fat content after 8 days of adipogenic differentiation (n = 3). E, mRNA expression of adipogenic markers, PPARγ and aP2, after 8 days of adipogenic differentiation (n = 3). F, the average methylation level of the zfp423 promoter in adipose tissue assayed by bisulphite pyrosequencing (n = 6). G, the average methylation level of the zfp423 promoter in progenitor cells assayed by bisulphite pyrosequencing (n = 6). Data are expressed as the mean ± SEM. &P < 0.05 vs. Con within the same post‐weaning diet and #P < 0.05 vs. post‐weaning Reg within the same maternal diet as determined by two‐way ANOVA and Tukey's multiple comparison.
Inflammation and hypoxic response in adipose tissue and glucose tolerance test in 3‐month‐old offspring
The expression of both interleukin (IL)‐6 and tumor necrosis factor (TNF)α was increased when the offspring were subjected to a high‐energy diet compared to the regular diet, whereas there was no maternal effect under the same post‐weaning diet (Fig. 7 A and B). The expression of macrophage chemotactic protein (MCP)‐1, an important cytokine attracting macrophage infiltration (McCurdy et al. 2012), was highest in OB/Obe mice (Fig. 7 C), as also was the case for the expression of hypoxia‐inducible factor 1α (Fig. 7 D). Compared to OB/Obe mice, expression levels were lower in Con/Obe mice, showing that MO had programming effects on adipose metabolic dysfunction. These data are in line with the enhanced adipocyte sizes in the EpiWAT of OB/Obe mice. In combination, our data strongly support the notion that a reduced expansion capacity leads to unhealthy adipose tissue when challenged with a high‐energy diet.
Figure 7. Whole body glucose tolerance, inflammation and hypoxia in the epididymal fat (EpiWAT) of 3‐month‐old offspring .
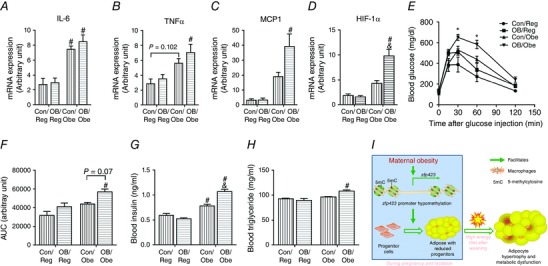
A–D, mRNA expression of IL‐6 (A), TNFα (B), MCP‐1 (C) and HIF‐1α (D) in EpiWAT (n = 6). E, total body glucose tolerance test. F, areas under the curves to measure glucose clearance ability (n = 4). G–H, blood insulin (G) and triglyceride (H) levels (n = 6). I, the underlying mechanism linking maternal obesity to adipose metabolic dysfunction in offspring. Data are expressed as the mean ± SEM. *P < 0.05 vs. all other groups determined by repeated‐measures ANOVA. & P < 0.05 relative to Con within the same post‐weaning diet and # P < 0.05 relative to post‐weaning Reg within the same maternal diet as determined by two‐way ANOVA and Tukey's multiple comparison.
Consistently, following the glucose challenge, the rate of glucose clearance was similar in OB/Reg and Con/Reg mice, although it was reduced in OB/Obe compared to Con/Obe mice (Fig. 7 E and F). We further measured the blood insulin and found that there was no difference between Con/Reg and OB/Reg mice, although OB/Obe mice had a higher blood insulin level compared to Con/Obe mice (Fig. 7 G). A similar change was also observed with respect to the blood triglyceride level (Fig. 7 H). All these data indicate that MO programs the metabolic dysfunction in offspring that are challenged with a high‐energy diet.
Discussion
Recent studies suggest that insufficient adipogenesis in response to excessive dietary energy intake is a critical mechanism leading to adipose tissue inflammation and metabolic dysfunction: the ‘adipose tissue expandability hypothesis’ (Tchkonia et al. 2010; Virtue & Vidal‐Puig, 2010). In this situation, as a result of the limited capacity to generate new adipocytes, existing adipocytes undergo hypertrophy to accommodate excessive fatty acids, and overflow fatty acids spill over to other tissues, incurring ectopic lipid deposition, insulin resistance and dyslipidaemia (Sun et al. 2011; Michaud et al. 2012). Consistent with this notion, lipodystrophy, a condition with decreased adipose tissue, leads to severe insulin resistance and dyslipidaemia (Huang‐Doran et al. 2010), whereas enhancing adipogenesis increases fat mass and improves insulin sensitivity (Okuno et al. 1998; de Souza et al. 2001). The impact of adipose expandability on metabolic dysfunction is greater in the visceral fat because it has a lower capacity for expansion than the subcutaneous fat (Greenwood & Hirsch, 1974; Bertrand et al. 1978; van Beek et al. 2015). Visceral fat mass and adipocyte size are well correlated with diabetes, hyperlipidaemia and cardiovascular diseases (Einstein et al. 2008; Ross et al. 2008; Klein, 2010). Epididymal fat is the most commonly used fat for studying visceral fat properties in mice (Garin‐Shkolnik et al. 2014; Yi et al. 2014; van Beek et al. 2015) and MO programs obesity and increases epididymal fat mass in offspring (Samuelsson et al. 2008; Tong et al. 2011). Given the sex dimorphism and depot difference in fat tissue function (Lemieux et al. 1993; White & Tchoukalova, 2014), the present study focused on the epididymal fat of male offspring aiming to explore the mechanistic impact of MO on offspring obesity and metabolic disorders. We expect that similar mechanisms should also be applicable to females considering the conservativeness of adipogenic mechanisms.
Approximately 10% of fat cells are renewed annually at all adult ages (Spalding et al. 2008). The renewal of adipocytes requires the do novo differentiation of preadipocytes that derive from the commitment of adipocyte progenitors (Gupta et al. 2012; Berry & Rodeheffer, 2013). PDGFRα positive cells residing in adipose tissue are the source of white adipocytes (Lee et al. 2012; Berry & Rodeheffer, 2013). In our previous study, we found that MO enhanced the adipogenesis of fetal progenitors (Yang et al. 2013). Because the offspring adipogenic progenitor cells are derived from fetal progenitor cells, in the present study, we further explored the long‐term changes in progenitor properties of offspring EpiWAT. We used PDGFRα as a marker to identify adipocyte progenitors and found that the progenitor density in OB/Obe mice was lower than Con/Obe mice, which is consistent with our hypothesis that the premature adipogenic differentiation of OB progenitor cells leads to their exhaustion in adipose tissue. In addition, when compared with adipose tissue at weaning, the ratio of expansion was much smaller in OB/Obe mice compared to Con/Obe mice, clearly showing the limited adipose expansion in OB offspring when challenged with a high‐energy diet. Of note, in the present study, two‐dimensional quantification of adipocyte sizes of sectioned tissue samples was employed. Because this method could not distinguish between whether the shortest diameter represents the midline section of a small adipocyte or the off‐midline sectioning of a larger adipocytes, the average adipocyte sizes measured would be smaller than the actual adipocyte sizes. Fortunately, because the same method was used for adipocyte measurement of all samples, the chances of off‐midline sectioning were almost equivalent and would not affect the ratio of adipocyte expansion among treatments, which we were comparing in the present study.
zfp423 is the key regulator that determines the fate of adipocyte progenitors to preadipocytes, and it further promotes adipogenic differentiation by inducing PPARγ expression (Gupta et al. 2010; Gupta et al. 2012). We have previously reported that MO promoted the adipogenesis of fetal progenitor cells, which was associated with the enhanced expression of zfp423 and reduced DNA methylation of its promoter (Yang et al. 2013). These observations prompted us to further examine whether such an epigenetic change is maintained in progenitor cells in offspring adipose tissue. Consistently, at weaning, DNA methylation in the zfp423 promoter remained lower in OB cells compared to Con cells, which was correlated with enhanced zfp423 expression and elevated adipogenic differentiation of progenitor cells. Our data are supported by the results of another study in rats showing enhanced zfp423 expression in adipose tissue of OB offspring (Borengasser et al. 2013).
We also analysed zfp423 DNA methylation both in adipose tissue and in progenitor cells at 3 months of age. Intriguingly, we found that the DNA methylation level of the zfp423 promoter in adipose tissue of all treatments was dramatically lower than that at weaning, showing that a demethylation process probably occurred during adipose development, which has not been reported previously. To confirm this novel observation, we analysed the DNA methylation of the zfp423 promoter during adipose tissue development. We found that the methylation level peaked around E17.5 and demethylation occurred during further development. We also found that the DNA methylation was lower in OB compared to Con mice at weaning, which was correlated with lower DNA methylation both in progenitors and in adipose tissue of OB/Obe compared to Con/Obe mice. In short, these data suggest that DNA demethylation occurred in the zfp423 promoter during adipose development, which was accelerated in the progenitor cells and adipose tissue of OB offspring challenged with a high‐energy diet.
Aligned with lower expansion capacity, OB/Obe adipose tissue had larger adipocytes, which were associated with hypoxic and inflammatory responses, both of which are known to induce adipose tissue metabolic dysfunction (Gustafson et al. 2009; Lee et al. 2014). Furthermore, global glucose clearance ability was also impaired in OB/Obe mice. Our finding is supported by previous studies reporting that impairment of adipocyte turnover is associated with insulin resistance (Kim et al. 2014). Of note, the offspring mice in the present study were only 3 months old, and the detection of hypoxia and inflammation in adipose tissue at such a young age accentuates the significance of these adverse effects of MO on the adipose function of offspring, which probably worsens with advancing age (Kim et al. 2014).
In summary, MO induces persistent epigenetic changes in the key developmental gene regulating adipogenesis in the offspring adipose tissue, thereby impairing the renewal of progenitor cells during adipose expansion, which sequentially impairs the ability of adipose tissue to undergo further expansion, resulting in adipocyte hypertrophy, a cause of hypoxia and inflammation (Fig. 6 G). These insights identify a key novel mechanism linking MO to obesity and metabolic dysfunction in offspring, and open a new window for studying ‘developmental programming’ by focusing on epigenetic changes in adipocyte progenitors.
Additional information
Competing interests
The authors declare that they have no competing interests.
Author contributions
XL, QY, XF, CJR, BW, HP and MD researched the data and wrote the manuscript. MJZ and PWN contributed to the experimental design and discussion and reviewed and edited the manuscript. MD designed the experiments. All the experiments were performed in Washington State University, except for the cell sorting with flow cytometry, which was carried out in University of Idaho. All authors have approved the final version of the manuscript. All authors agree to be accountable for all aspects of the work, ensuring that questions related to the accuracy or integrity of any part are appropriately investigated and resolved. All persons designated as authors qualify for authorship, and all those who qualify for authorship are listed.
Funding
The present study was funded by NIH R01HD067449.
Acknowledgements
The authors wish to thank Ann Norton for performing the cell sorting with flow cytometry.
This is an Editor's Choice article from the 1 August 2016 issue.
References
- Berry R & Rodeheffer MS (2013). Characterization of the adipocyte cellular lineage in vivo. Nat Cell Biol 15, 302–308. [DOI] [PMC free article] [PubMed] [Google Scholar]
- Bertrand HA, Masoro EJ & Yu BP (1978). Increasing adipocyte number as the basis for perirenal depot growth in adult rats. Science 201, 1234–1235. [DOI] [PubMed] [Google Scholar]
- Biro FM & Wien M (2010). Childhood obesity and adult morbidities. Am J Clin Nutrit 91, 1499S–1505S. [DOI] [PMC free article] [PubMed] [Google Scholar]
- Blackmore HL, Niu Y, Fernandez‐Twinn DS, Tarry‐Adkins JL, Giussani DA & Ozanne SE (2014). Maternal diet‐induced obesity programs cardiovascular dysfunction in adult male mouse offspring independent of current body weight. Endocrinology 155, 3970–3980. [DOI] [PMC free article] [PubMed] [Google Scholar]
- Borengasser SJ, Zhong Y, Kang P, Lindsey F, Ronis MJ, Badger TM, Gomez‐Acevedo H & Shankar K (2013). Maternal obesity enhances white adipose tissue differentiation and alters genome‐scale DNA methylation in male rat offspring. Endocrinology 154, 4113–4125. [DOI] [PMC free article] [PubMed] [Google Scholar]
- de Souza CJ, Eckhardt M, Gagen K, Dong M, Chen W, Laurent D & Burkey BF (2001). Effects of pioglitazone on adipose tissue remodelling within the setting of obesity and insulin resistance. Diabetes 50, 1863–1871. [DOI] [PubMed] [Google Scholar]
- Desai M, Jellyman JK & Ross MG (2015). Epigenomics, gestational programming and risk of metabolic syndrome. Int J Obes (Lond) 39, 633–641. [DOI] [PubMed] [Google Scholar]
- Einstein FH, Fishman S, Muzumdar RH, Yang XM, Atzmon G & Barzilai N (2008). Accretion of visceral fat and hepatic insulin resistance in pregnant rats. Am J Physiol Endocrinol Metab 294, E451–E455. [DOI] [PubMed] [Google Scholar]
- Flegal KM, Carroll MD, Kit BK & Ogden CL (2012). Prevalence of obesity and trends in the distribution of body mass index among US adults, 1999–2010. JAMA 307, 491–497. [DOI] [PubMed] [Google Scholar]
- Fu X, Zhao JX, Zhu MJ, Foretz M, Viollet B, Dodson MV & Du M (2013). AMP‐activated protein kinase alpha1 but not alpha2 catalytic subunit potentiates myogenin expression and myogenesis. Mol Cell Biol 33, 4517–4525. [DOI] [PMC free article] [PubMed] [Google Scholar]
- Garin‐Shkolnik T, Rudich A, Hotamisligil GS & Rubinstein M (2014). FABP4 attenuates PPARgamma and adipogenesis and is inversely correlated with PPARgamma in adipose tissues. Diabetes 63, 900–911. [DOI] [PubMed] [Google Scholar]
- Grey SL & Vidal‐Puig AJ (2007). Adipose tissue expandability in the maintenance of metabolic homeostasis. Nutr Rev 65, S7–S12. [DOI] [PubMed] [Google Scholar]
- Greenwood MR & Hirsch J (1974). Postnatal development of adipocyte cellularity in the normal rat. J Lipid Res 15, 474–483. [PubMed] [Google Scholar]
- Gupta RK, Arany Z, Seale P, Mepani RJ, Ye L, Conroe HM, Roby YA, Kulaga H, Reed RR & Spiegelman BM (2010). Transcriptional control of preadipocyte determination by Zfp423. Nature 464, 619–623. [DOI] [PMC free article] [PubMed] [Google Scholar]
- Gupta RK, Mepani RJ, Kleiner S, Lo JC, Khandekar MJ, Cohen P, Frontini A, Bhowmick DC, Ye L, Cinti S & Spiegelman BM (2012). Zfp423 expression identifies committed preadipocytes and localizes to adipose endothelial and perivascular cells. Cell Metab 15, 230–239. [DOI] [PMC free article] [PubMed] [Google Scholar]
- Gustafson B, Gogg S, Hedjazifar S, Jenndahl L, Hammarstedt A & Smith U (2009). Inflammation and impaired adipogenesis in hypertrophic obesity in man. Am J Physiol Endocrinol Metab 297, E999–E1003. [DOI] [PubMed] [Google Scholar]
- Huang‐Doran I, Sleigh A, Rochford JJ, O'Rahilly S & Savage DB (2010). Lipodystrophy: metabolic insights from a rare disorder. J Endocrinol 207, 245–255. [DOI] [PubMed] [Google Scholar]
- Huang Y, Das AK, Yang QY, Zhu MJ & Du M (2012). Zfp423 promotes adipogenic differentiation of bovine stromal vascular cells. PloS ONE 7, e47496. [DOI] [PMC free article] [PubMed] [Google Scholar]
- Kim SM, Lun M, Wang M, Senyo SE, Guillermier C, Patwari P & Steinhauser ML (2014). Loss of white adipose hyperplastic potential is associated with enhanced susceptibility to insulin resistance. Cell Metab 20, 1049–1058. [DOI] [PMC free article] [PubMed] [Google Scholar]
- Klein S (2010). Is visceral fat responsible for the metabolic abnormalities associated with obesity?: implications of omentectomy. Diabetes Care 33, 1693–1694. [DOI] [PMC free article] [PubMed] [Google Scholar]
- Lee YH & Granneman JG (2012). Seeking the source of adipocytes in adult white adipose tissues. Adipocyte 1, 230–236. [DOI] [PMC free article] [PubMed] [Google Scholar]
- Lee YH, Petkova AP, Mottillo EP & Granneman JG (2012). In vivo identification of bipotential adipocyte progenitors recruited by beta3‐adrenoceptor activation and high‐fat feeding. Cell Metab 15, 480–491. [DOI] [PMC free article] [PubMed] [Google Scholar]
- Lee YS, Kim JW, Osborne O, Oh da Y, Sasik R, Schenk S, Chen A, Chung H, Murphy A, Watkins SM, Quehenberger O, Johnson RS & Olefsky JM (2014). Increased adipocyte O2 consumption triggers HIF‐1alpha, causing inflammation and insulin resistance in obesity. Cell 157, 1339–1352. [DOI] [PMC free article] [PubMed] [Google Scholar]
- Lemieux S, Prud'homme D, Bouchard C, Tremblay A & Despres JP (1993). Sex differences in the relation of visceral adipose tissue accumulation to total body fatness. Am J Clin Nutr 58, 463–467. [DOI] [PubMed] [Google Scholar]
- McCurdy CE, Schenk S, Holliday MJ, Philp A, Houck JA, Patsouris D, MacLean PS, Majka SM, Klemm DJ & Friedman JE (2012). Attenuated Pik3r1 expression prevents insulin resistance and adipose tissue macrophage accumulation in diet‐induced obese mice. Diabetes 61, 2495–2505. [DOI] [PMC free article] [PubMed] [Google Scholar]
- Michaud A, Drolet R, Noel S, Paris G & Tchernof A (2012). Visceral fat accumulation is an indicator of adipose tissue macrophage infiltration in women. Metab Clin Exp 61, 689–698. [DOI] [PubMed] [Google Scholar]
- Modi N, Murgasova D, Ruager‐Martin R, Thomas EL, Hyde MJ, Gale C, Santhakumaran S, Dore CJ, Alavi A & Bell JD (2011). The influence of maternal body mass index on infant adiposity and hepatic lipid content. Pediatr Res 70, 287–291. [DOI] [PubMed] [Google Scholar]
- Ogden CL, Carroll MD, Curtin LR, Lamb MM & Flegal KM (2010). Prevalence of high body mass index in US children and adolescents, 2007–2008. JAMA 303, 242–249. [DOI] [PubMed] [Google Scholar]
- Okuno A, Tamemoto H, Tobe K, Ueki K, Mori Y, Iwamoto K, Umesono K, Akanuma Y, Fujiwara T, Horikoshi H, Yazaki Y & Kadowaki T (1998). Troglitazone increases the number of small adipocytes without the change of white adipose tissue mass in obese Zucker rats. J Clin Invest 101, 1354–1361. [DOI] [PMC free article] [PubMed] [Google Scholar]
- Parlee SD, Lentz SI, Mori H & MacDougald OA (2014). Quantifying size and number of adipocytes in adipose tissue. Method Enzymol 537, 93–122. [DOI] [PMC free article] [PubMed] [Google Scholar]
- Patel N, Pasupathy D & Poston L (2015). Determining the consequences of maternal obesity for offspring health. Exp Physiol 100, 1421–1428. [DOI] [PubMed] [Google Scholar]
- Ross R, Berentzen T, Bradshaw AJ, Janssen I, Kahn HS, Katzmarzyk PT, Kuk JL, Seidell JC, Snijder MB, Sorensen TI & Despres JP (2008). Does the relationship between waist circumference, morbidity and mortality depend on measurement protocol for waist circumference? Obes Rev 9, 312–325. [DOI] [PubMed] [Google Scholar]
- Samuelsson AM, Matthews PA, Argenton M, Christie MR, McConnell JM, Jansen EH, Piersma AH, Ozanne SE, Twinn DF, Remacle C, Rowlerson A, Poston L & Taylor PD (2008). Diet‐induced obesity in female mice leads to offspring hyperphagia, adiposity, hypertension, and insulin resistance: a novel murine model of developmental programming. Hypertension 51, 383–392. [DOI] [PubMed] [Google Scholar]
- Shankar K, Harrell A, Liu X, Gilchrist JM, Ronis MJ & Badger TM (2008). Maternal obesity at conception programs obesity in the offspring. Am J Physiol Regul Integr Comp Physiol 294, R528–R538. [DOI] [PubMed] [Google Scholar]
- Shasa DR, Odhiambo JF, Long NM, Tuersunjiang N, Nathanielsz PW & Ford SP (2015). Multi‐generational impact of maternal overnutrition/obesity in the sheep on the neonatal leptin surge in granddaughters. Int J Obes (Lond) 39, 695–701. [DOI] [PMC free article] [PubMed] [Google Scholar]
- Spalding KL, Arner E, Westermark PO, Bernard S, Buchholz BA, Bergmann O, Blomqvist L, Hoffstedt J, Naslund E, Britton T, Concha H, Hassan M, Ryden M, Frisen J & Arner P (2008). Dynamics of fat cell turnover in humans. Nature 453, 783–787. [DOI] [PubMed] [Google Scholar]
- Sun K, Kusminski CM & Scherer PE (2011). Adipose tissue remodelling and obesity. J Clin Invest 121, 2094–2101. [DOI] [PMC free article] [PubMed] [Google Scholar]
- Tchkonia T, Morbeck DE, Von Zglinicki T, Van Deursen J, Lustgarten J, Scrable H, Khosla S, Jensen MD & Kirkland JL (2010). Fat tissue, aging, and cellular senescence. Aging Cell 9, 667–684. [DOI] [PMC free article] [PubMed] [Google Scholar]
- Tong JF, Yan X, Zhao JX, Zhu MJ, Nathanielsz PW & Du M (2011). Metformin mitigates the impaired development of skeletal muscle in the offspring of obese mice. Nutr Diabetes 1, e7. [DOI] [PMC free article] [PubMed] [Google Scholar]
- Tost J & Gut IG (2007). DNA methylation analysis by pyrosequencing. Nat Protoc 2, 2265–2275. [DOI] [PubMed] [Google Scholar]
- van Beek L, van Klinken JB, Pronk AC, van Dam AD, Dirven E, Rensen PC, Koning F, Willems van Dijk K & van Harmelen V (2015). The limited storage capacity of gonadal adipose tissue directs the development of metabolic disorders in male C57Bl/6J mice. Diabetologia 58, 1601–1609. [DOI] [PMC free article] [PubMed] [Google Scholar]
- Vernochet C, Peres SB & Farmer SR (2009). Mechanisms of obesity and related pathologies: transcriptional control of adipose tissue development. FEBS J 276, 5729–5737. [DOI] [PubMed] [Google Scholar]
- Virtue S & Vidal‐Puig A (2010). Adipose tissue expandability, lipotoxicity and the Metabolic Syndrome – an allostatic perspective. Biochim Biophys Acta 1801, 338–349. [DOI] [PubMed] [Google Scholar]
- Waters TP, Huston‐Presley L & Catalano PM (2012). Neonatal body composition according to the revised institute of medicine recommendations for maternal weight gain. J Clin Endocrinol Metab 97, 3648–3654. [DOI] [PMC free article] [PubMed] [Google Scholar]
- White UA & Tchoukalova YD (2014). Sex dimorphism and depot differences in adipose tissue function. Biochim Biophys Acta 1842, 377–392. [DOI] [PMC free article] [PubMed] [Google Scholar]
- Yan X, Zhu MJ, Xu W, Tong JF, Ford SP, Nathanielsz PW & Du M (2010). Up‐regulation of Toll‐like receptor 4/nuclear factor‐kappa B signalling is associated with enhanced adipogenesis and insulin resistance in fetal skeletal muscle of obese sheep at late gestation. Endocrinology 151, 380–387. [DOI] [PMC free article] [PubMed] [Google Scholar]
- Yang QY, Liang JF, Rogers CJ, Zhao JX, Zhu MJ & Du M (2013). Maternal obesity induces epigenetic modifications to facilitate zfp423 expression and enhance adipogenic differentiation in fetal mice. Diabetes 62, 3727–3735. [DOI] [PMC free article] [PubMed] [Google Scholar]
- Yi Z, Stunz LL & Bishop GA (2014). CD40‐mediated maintenance of immune homeostasis in the adipose tissue microenvironment. Diabetes 63, 2751–2760. [DOI] [PMC free article] [PubMed] [Google Scholar]
- Zeve D, Tang W & Graff J (2009). Fighting fat with fat: the expanding field of adipose stem cells. Cell Stem Cell 5, 472–481. [DOI] [PMC free article] [PubMed] [Google Scholar]