

Abstract
Key points
The human stress response activates the autonomic nervous system and endocrine systems to increase performance during environmental challenges.
This response is usually beneficial, improving the chance of overcoming environmental challenges, but costs resources such as energy.
Humans and other animals are known to adapt their responses to acute stress when they are stimulated chronically, presumably to optimise resource utilisation. Characterisation of these adaptations has been limited.
Using advanced imaging techniques, we show that cardiovascular and endocrine physiology, reflective of energy utilisation during acute stress, and energy storage (fat) differ between the sexes when they are exposed to chronic stress.
We examine possible evolutionary explanations for these differences, related to energy use, and point out how these physiological differences could underpin known disparities between the sexes in their risk of important cardiometabolic disorders such as obesity and cardiovascular disease.
Abstract
Obesity and associated diseases, such as cardiovascular disease, are the dominant human health problems in the modern era. Humans develop these conditions partly because they consume excess energy and exercise too little. Stress might be one of the factors contributing to these disease‐promoting behaviours. We postulate that sex‐specific primordial energy optimisation strategies exist, which developed to help cope with chronic stress but have become maladaptive in modern societies, worsening health. To demonstrate the existence of these energy optimisation strategies, we recruited 88 healthy adults with varying adiposity and chronic stress exposure. Cardiovascular physiology at rest and during acute stress (Montreal Imaging Stress Task), and body fat distribution were measured using advanced magnetic resonance imaging methods, together with endocrine function, cardiovascular energy use and cognitive performance. Potential confounders such as lifestyle, social class and employment were accounted for. We found that women exposed to chronic stress had lower adiposity, greater acute stress cardiovascular responses and better cognitive performance. Conversely, chronic stress‐exposed men had greater adiposity and lower cardiovascular responses to acute stress. These results provide initial support for our hypothesis that differing sex‐specific energy conservation strategies exist. We propose that these strategies have initially evolved to benefit humans but are now maladaptive and increase the risk of disorders such as obesity, especially in men exposed to chronic stress.
Key points
The human stress response activates the autonomic nervous system and endocrine systems to increase performance during environmental challenges.
This response is usually beneficial, improving the chance of overcoming environmental challenges, but costs resources such as energy.
Humans and other animals are known to adapt their responses to acute stress when they are stimulated chronically, presumably to optimise resource utilisation. Characterisation of these adaptations has been limited.
Using advanced imaging techniques, we show that cardiovascular and endocrine physiology, reflective of energy utilisation during acute stress, and energy storage (fat) differ between the sexes when they are exposed to chronic stress.
We examine possible evolutionary explanations for these differences, related to energy use, and point out how these physiological differences could underpin known disparities between the sexes in their risk of important cardiometabolic disorders such as obesity and cardiovascular disease.
Abbreviations
- BMI
body mass index
- BP
blood pressure
- CO
cardiac output
- CP
cardiac power
- DBP
diastolic blood pressure
- HR
heart rate
- MBP
mean blood pressure
- MIST
Montreal Imaging Stress Task
- MR
magnetic resonance
- PSS
perceived stress scale
- SBP
systolic blood pressure
- SV
stroke volume
- TAC
total arterial compliance
- TPR
total peripheral resistance
- WU
Wood units
Introduction
Organisms must adapt to environmental challenges to ensure survival and reproductive fitness. The acute stress response is the primary means by which this is achieved. It includes physiological and behavioural changes that aim primarily at increasing energy availability to allow the organism to cope with the increased demands of an acute threat. Energy stores and other limited resources are consumed as a result. In simple organisms, physical stressors such as trauma stimulate stereotyped responses, which may not adapt to repeated stimulation. This can exhaust the organism's resources with sometimes terminal consequences (McNamara & Buchanan, 2005). Higher organisms, by contrast, are capable of altering their responses with repeated or prolonged stimulation to avoid catastrophic outcomes (McEwen, 2007). This usually takes the form of reduced responsiveness over time, known as habituation, which can be seen as an evolutionary advance in resource management.
The trade‐off between optimal responsiveness to environmental stress and optimal resource utilisation differs between the sexes in most animals (Taylor et al. 2000; Kajantie & Phillips, 2006). This maximises sex‐specific survival characteristics in accordance with the different evolutionary pressures that the sexes are confronted with. However, sex‐specific adaptations to chronic stress have not been well characterised in humans. Given that high‐energy food availability was uncommon until recently, we posit that the stress systems of humans evolved to best meet our needs at a time when chronic stress was usually accompanied by nutritional poverty (McEwen, 2012). Such stress system adaptation could be maladaptive in the modern era where food is abundant at all times, potentially promoting disorders such as obesity. Given the complex and poorly understood aetiology of obesity and its status as a key risk factor for serious diseases, greater understanding of mechanisms that promote obesity in modern humans should have major health benefits.
The study of sex‐specific adaptations to stress has been hampered by limited methods for studying stress response physiology (Kajantie & Phillips, 2006). The recent advance of magnetic resonance (MR)‐augmented mental stress testing has changed this by offering accurate, comprehensive assessment of all elements of the cardiovascular acute stress response, together with the adrenocortical response for the first time (Jones et al. 2011). This has been further enhanced by the inclusion of advanced adiposity imaging (Jones et al. 2012). In combination, these measures yield important information about resource utilisation at rest and during stress.
Here we used MR‐augmented stress testing to study the relationship between the acute mental stress response and chronic stress exposure in men and women of reproductive age. The major hypothesis was that chronic stress leads to adaptation of cardiovascular, neuroendocrine and performance elements of the acute mental stress response in a sex‐specific manner.
Methods
Ethical approval
The local ethics board (Bloomsbury, London, UK) approved the study, which conformed to the standards set by the Declaration of Helsinki and all participants gave written informed consent.
Participants
Healthy men (n = 43) and women (n = 45), aged 18–45 years, were recruited from a single primary care practice. Electronic patient records and disease registers were used to exclude medication users, or people with chronic disease.
Chronic stress
Stress exposure history for the past month was assessed with the perceived stress scale (PSS) of Cohen et al. (1983). This measure of chronic stress takes account of how stressful events are perceived to be and correlates better with outcomes than life event scores do.
Acute stress
We used the Montreal Imaging Stress Task (MIST) to induce social stress for 10 min in a MR scanner. The protocol has been detailed before and shown to stimulate endocrine and cardiovascular systems reliably (Jones et al. 2011). Briefly, participants have to answer a series of difficult mathematical problems presented by a computer and are compared to the ‘average’ performance that other users have supposedly achieved. Stress is induced by automated manipulation of task speed and difficulty to ensure that all participants achieve a similarly poor result regardless of ability. Comparison with a falsely elevated ‘average’ performance and investigator requests for performance improvement provide the potential for participants to feel negatively judged in a social setting. The numbers of questions attempted and answered correctly and the mean time taken to answer questions are used to assess cognitive performance during the task. Deceptive elements of the task are revealed to participants upon completion.
Salivary cortisol
Using established protocols (Jones et al. 2011), eight saliva samples were obtained (Salivette Cortisol, Sarstedt, Nümbrecht, Germany), according to a schedule of −60 (arrival), 0, 5, 10, 20, 30, 35 and 40 min relative to the onset of stress. Free cortisol was measured using a commercially available chemiluminescence‐immuno‐assay (IBL, Hamburg, Germany). Participants were asked not to consume caffeine on the study day or to eat food in the 2 h before their arrival.
Cardiac measures
Cardiac function was assessed using a 1.5‐T MR scanner (Avanto, Siemens, Munich, Germany) twice during a 5 min rest period and four times during stress. Aortic flow was measured using an accelerated ECG‐gated spiral phase‐contrast MR sequence (Jones et al. 2011) that allows data acquisition within a 5 s breath‐hold. This sequence has been shown to be highly accurate in comparison to gold standard MR flow measures (Steeden et al. 2011). Images were manually segmented using OsiriX (OsiriX Foundation, Geneva, Switzerland) to measure stroke volume (SV) and cardiac output (CO). Oscillometric systolic (SBP), mean (MBP) and diastolic (DBP) blood pressures (BP) were measured in the non‐dominant arm at 1 min intervals. Total peripheral resistance (TPR; mmHg min l−1; WU) was calculated by dividing MBP by CO. Total arterial compliance (TAC) was calculated by optimisation of a two‐element windkessel model, as described previously (Jones et al. 2011). Cardiac power (CP) was used to assess cardiovascular energy utilisation, calculated as the product of MBP and CO (Williams et al. 2001). Cardiac measures were indexed to body surface area where appropriate (suffix ‘i’).
Fat quantification
We used T2*‐IDEAL (Kowalik et al. 2011) MR to produce separated water and fat images to measure body fat content. This technique has been shown to yield highly accurate estimates of tissue fat in comparison to gold standard techniques such as MR spectroscopy (Kim et al. 2008). The visceral compartment was manually separated from the fat image and the liver was excluded due to frequent artefacts at diaphragm level.
Covariates
Participants completed questionnaires on their social class (UK Office for National Statistics Socioeconomics Classification – NS‐SEC; Office for National Statistics, 2012), ethnicity and education (both based on UK Office for National Statistics 2001 Census), menstrual history (in women), tobacco and alcohol consumption (based on UK Office for National Statistics General Household Surveys) and the number of hours they sleep on average. Habitual physical activity was estimated using the Baecke short questionnaire for the measurement of habitual physical activity in epidemiological studies (Baecke et al. 1982). This validated, repeatable measure has been shown to correspond well with direct measures of physical activity and cardiorespiratory fitness (Jacobs et al. 1993).
Statistics
Analyses were performed with Stata 13.1 (StataCorp, College Station, TX, USA). Repeated measures multilevel linear regression models were used to assess the effect of chronic stress (measured by PSS) on acute stress responses. Interaction terms for time of measurement with PSS were included to assess the effect of PSS on the change in parameters with respect to initial (resting) values. Sex was added as a further interaction term to assess the sex‐dependence of effects of PSS. To illustrate the continuous interaction effects, marginal mean values were estimated for the minimum, median and maximum values of PSS found in the population. Cardiovascular measures at rest and during stress were stable and therefore were averaged within these time periods to simplify analyses and presentation. Regression models were controlled for age and menstrual cycle phase in accordance with prior evidence that these factors affect cardiovascular and endocrine responses to stress (Jones et al. 2012). As chronic stress was shown to influence adiposity and adiposity is known to influence cardiovascular and endocrine function, the models were also adjusted for percentage body fat. All of the regression models were repeated with the addition of social class, education level, race, smoking and alcohol consumption, and physical activity variables to test influence of these possible confounders. Mann–Whitney U tests were used for comparisons of PSS and its component questions between the sexes. MR fat quantification was expressed as the percentage of body compartment (by volume) made up of adipose tissue. Visceral fat percentage was log transformed to a normal distribution prior to use in analyses. Associations between adiposity measures and chronic stress were assessed with linear regression, adjusted for age. Statistical significance was defined as P < 0.05.
Results
Of the 88 participants, 43 (49%) were male, 74 (84%) were White, 60 (68%) were educated to university entrance level or above and 81 (92%) were in higher social classes. Median age was 38 (range 18–45) years. Only nine (10%) were smokers. Mean sleep duration was 7.3 h (SD 1.3). None of these factors differed significantly between sexes. Women had significantly (P < 0.0001) greater mean body fat percentage (40.3%) than men (32.8%). There was a wide range of body fat percentage in both sexes, from 25.6 to 55.6% in women and from 13.1 to 45.5% in men. Median physical activity index was 2.8 out of 5.0 (range 1.5–3.6) with no sex differences. Median PSS score was 16 out of 40 (range 2–30) with no sex differences for PSS or any of its components. At rest, salivary cortisol did not differ between sexes but men had higher TPRi and SBP (Table 1). Other cardiovascular measures at rest did not differ between the sexes.
Table 1.
Mean (± SEM) cardiovascular and endocrine parameters at rest, their change from rest to stress (response) and cognitive performance measures during stress, in men and women
| Women (n = 45) | Men (n = 43) | Sex differences | ||||||
|---|---|---|---|---|---|---|---|---|
| Rest | Response | P | Rest | Response | P | P (rest) | P (response) | |
| HR (bpm) | 67.9 (1.6) | 17.1 (1.5) | < 0.0001 | 65.2 (1.4) | 15.4 (1.5) | < 0.0001 | 0.22 | 0.40 |
| SVi (ml m−2) | 43.6 (0.8) | 1.6 (0.6) | 0.01 | 42.6 (1.1) | 1.6 (0.5) | 0.003 | 0.47 | 0.99 |
| COi (l min−1 m−2) | 2.95 (0.08) | 0.89 (0.10) | < 0.0001 | 2.76 (0.07) | 0.82 (0.09) | < 0.0001 | 0.09 | 0.62 |
| TPRi (WU m2) | 29.2 (0.9) | −4.1 (0.7) | < 0.0001 | 32.4 (0.9) | −3.5 (0.6) | < 0.0001 | 0.01 | 0.51 |
| TACi (ml mmHg−1 | 0.59 (0.02) | −0.12 (0.01) | < 0.0001 | 0.54 (0.02) | −0.06 (0.01) | < 0.0001 | 0.06 | 0.003 |
| m−2) | ||||||||
| SBP (mmHg) | 109.8 (1.6) | 12.8 (1.0) | < 0.0001 | 118.6 (2.1) | 14.7 (1.1) | < 0.0001 | 0.002 | 0.22 |
| MBP (mmHg) | 84.0 (1.2) | 8.3 (0.7) | < 0.0001 | 87.5 (1.4) | 11.1 (0.8) | < 0.0001 | 0.06 | 0.007 |
| DBP (mmHg) | 65.9 (1.3) | 4.8 (0.8) | < 0.0001 | 66.6 (1.5) | 10.0 (0.9) | < 0.0001 | 0.72 | < 0.0001 |
| CPi (W m−2) | 0.54 (0.51, | 0.24 (0.02) | < 0.0001 | 0.53 (0.49, | 0.25 (0.02) | < 0.0001 | 0.61 | 0.72 |
| 0.57)* | 0.56)* | |||||||
| Cortisol (nmol l−1) | 6.3 (5.3, 7.6)* | 2.3 (1.0, 3.9)* | < 0.0001 | 6.4 (5.2, 7.9)* | 2.7 (1.5, 4.3)* | < 0.0001 | 0.91 | 0.67 |
| Questions answered | — | 38.9 (8.2) | — | — | 44.3 (10.3) | — | — | 0.008 |
| Questions correct | — | 18.4 (4.7) | — | — | 20.7 (5.6) | — | — | 0.04 |
| Time to answer (s) | — | 5.5 (1.3) | — | — | 5.0 (1.7) | — | — | 0.15 |
HR, heart rate; SVi, stroke volume index; COi, cardiac index; TPRi, total peripheral resistance index; TACi, total arterial compliance index; SBP, systolic blood pressure; MBP, mean blood pressure; DBP, diastolic blood pressure; CPi, cardiac power index. Indexed variables were adjusted for body surface area.
*Geometric mean and geometric 95% confidence intervals.
Responses to the MIST
When performing the MIST, participants achieved a median of 48% (IQR 45–49%) correct answers. However, the number of questions answered (21–70) and the number answered correctly (3–35) varied widely, confirming that the MIST yielded similar apparent performance measures in all subjects. Salivary cortisol concentrations were obtained at median times of −60 (arrival), −2, 5, 12, 21, 28, 33 and 38 min relative to the onset of the MIST. The MIST caused a significant increase in salivary cortisol, peaking 28 min after stress began. Heart rate (HR), BP, SVi, COi and CPi also increased, and TPRi and TACi decreased (Table 1). TACi decreased less and DBP and MBP increased more in men, compared to women. Men answered more questions and more correctly than women during the stress task but the sexes did not differ on time taken to answer questions.
Associations with chronic stress
Visceral and subcutaneous adiposity (percentage of total body volume that is fat) were taken as measures of energy storage and were both associated with PSS scores (Table 2). Greater PSS scores in women were associated with lower subcutaneous and visceral fat but with higher subcutaneous fat in men. These sex differences were significant on interaction testing.
Table 2.
Linear associations of PSS with adiposity in men and women
| Women (n = 45) | Men (n = 43) | Sex differences | |||
|---|---|---|---|---|---|
| Rest | P | Rest | P | P | |
| Subcutaneous fat | −0.29 | 0.04 | 0.23 | 0.04 | 0.004 |
| Visceral fat | −0.28 | 0.01 | 0.11 | 0.34 | 0.04 |
Adiposity measures are expressed as percentages of body volume. Relationships are expressed as standard deviation (SD) of each parameter per SD of PSS score. Associations were adjusted for participant age.
Rest and peak post‐stress cortisol were not associated with PSS in either sex but the difference between them (stress response) was smaller in women with greater PSS (Fig. 1, Table 3). This was not seen in the men and this sex difference was statistically significant.
Figure 1. Marginal means (± SEM) of salivary cortisol at rest and in response to stress, for minimum, median and maximum values of PSS in men and women, estimated from multilevel linear regression models .
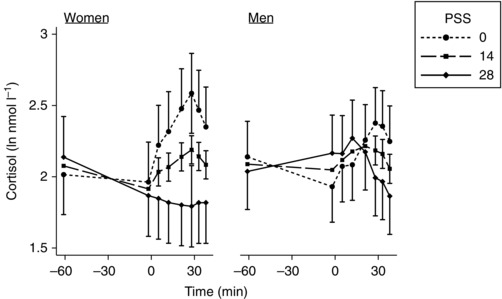
This illustrates the modelled three‐way interaction between time of measurement, sex and PSS. Time zero was the start of the stressor. Table 3 gives the continuous linear associations for rest and peak stress that are illustrated in this figure.
Table 3.
Linear associations of PSS with cardiovascular and endocrine parameters at rest, with their change from rest to stress (response) and with cognitive performance measures during stress, in men and women
| Women (n = 45) | Men (n = 43) | Sex differences | ||||||||
|---|---|---|---|---|---|---|---|---|---|---|
| Rest | P | Response | P | Rest | P | Response | P | P (rest) | P (response) | |
| HR | −0.19 | 0.15 | 0.17 | 0.09 | 0.01 | 0.92 | −0.24 | 0.02 | 0.28 | 0.004 |
| SVi | −0.22 | 0.08 | 0.11 | 0.16 | −0.03 | 0.79 | −0.13 | 0.11 | 0.29 | 0.04 |
| COi | −0.28 | 0.02 | 0.21 | 0.054 | 0.03 | 0.80 | −0.34 | 0.002 | 0.07 | < 0.001 |
| TPRi | 0.31 | 0.03 | −0.21 | 0.03 | −0.02 | 0.91 | 0.18 | 0.07 | 0.11 | 0.006 |
| TACi | −0.04 | 0.75 | 0.02 | 0.89 | −0.09 | 0.49 | 0.09 | 0.49 | 0.80 | 0.69 |
| SBP | −0.13 | 0.33 | 0.09 | 0.32 | 0.03 | 0.83 | −0.19 | 0.04 | 0.40 | 0.03 |
| MBP | −0.02 | 0.88 | 0.05 | 0.63 | −0.02 | 0.91 | −0.14 | 0.15 | 0.97 | 0.18 |
| DBP | −0.07 | 0.61 | 0.10 | 0.32 | 0.03 | 0.81 | −0.14 | 0.17 | 0.60 | 0.10 |
| CPi | −0.22 | 0.048 | 0.19 | 0.09 | 0.03 | 0.78 | −0.36 | 0.002 | 0.09 | < 0.001 |
| Cortisol | 0.04 | 0.83 | −0.27 | 0.01 | −0.05 | 0.77 | 0.04 | 0.73 | 0.72 | 0.047 |
| Questions answered | — | — | 0.29 | 0.04 | — | — | −0.10 | 0.46 | — | 0.04 |
| Questions correct | — | — | 0.30 | 0.04 | — | — | −0.09 | 0.51 | — | 0.03 |
| Time to answer | — | — | −0.23 | 0.09 | — | — | 0.19 | 0.18 | — | 0.12 |
HR, heart rate; SVi, stroke volume index; COi, cardiac index; TPRi, total peripheral resistance index; TACi, total arterial compliance index; SBP, systolic blood pressure; MBP, mean blood pressure; DBP, diastolic blood pressure; CPi, cardiac power index. Indexed variables were adjusted for body surface area. Relationships are expressed as standard deviation (SD) of each parameter per SD of PSS score and result from multilevel regression models, adjusted for age, menstrual phase and percentage body fat.
The effect of PSS on cardiovascular stress responses differed between the sexes (Fig. 2, Table 3). Higher PSS in women was associated with larger stress‐induced increases of HR, COi and CPi and a greater fall of TPRi. Conversely, in men it was associated with smaller HR, COi, CPi and SBP increases and a smaller fall of TPRi. The opposing direction of these associations in the two sexes was supported by significant interaction tests in all cases. SVi, TACi, MBP and DBP responses did not differ according to PSS in either sex. At rest, higher PSS was associated with lower COi, higher TPRi, lower CPi and a trend towards lower SVi in women. No associations between cardiovascular parameters and PSS were seen in men. Interaction testing of these sex differences was not significant (P < 0.1) for COi or CPi.
Figure 2. Marginal means (± SEM) of key cardiovascular parameters at rest and in response to stress, for minimum, median and maximum values of PSS in men and women, estimated from multilevel linear regression models, adjusting for age, menstrual phase and percentage body fat .
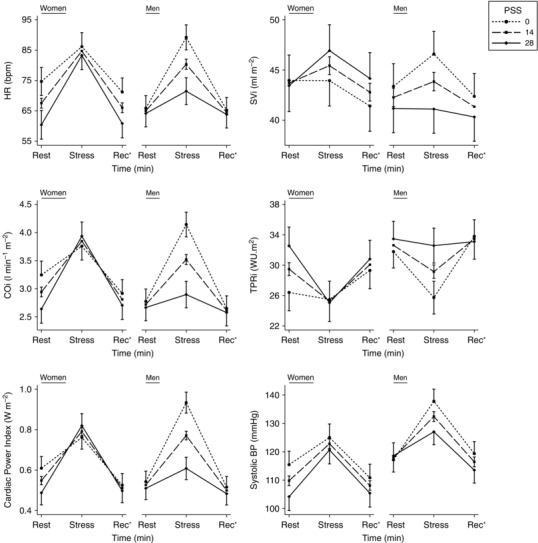
This illustrates the modelled three‐way interaction between time of measurement, sex and PSS. Table 3 gives the continuous linear associations for rest and stress that are illustrated in this figure. *Recovery.
PSS was associated with performance in a sex‐specific manner (Table 3). Greater PSS in women was associated with answering more questions, answering more correctly and a trend towards answering questions more quickly. Interaction testing showed this was different in the men in whom there was no association of performance with PSS.
None of these findings was altered substantially when models were further adjusted for potential confounders, including social class, race, education, smoking, alcohol consumption, physical activity and sleep duration. None of these potential confounders differed according to PSS in either sex.
Relationship between stress responses and performance
Linear regression analyses, with performance measures as dependent variables and stress response measures as independent variables, demonstrated a link between stress response magnitude and performance. Greater mean responses of COi and TPRi were associated with answering more questions (3.4 N l−1 min−1 m−2, P = 0.047; −0.6 N WU−1 m2, P = 0.02, respectively), answering more questions correctly (2.0 N l−1 min−1 m−2, P = 0.03; −0.4 N WU−1 m2, P = 0.01, respectively) and taking less time to answer questions (−0.53 s l−1 min−1 m−2, P = 0.05; 0.10 s WU−1 m2, P = 0.02, respectively). Responses of HR, SVi, TACi, SBP, DBP and cortisol were marginally related or unrelated to answering more questions (0.2 N bpm−1, P = 0.056; 0.3 N mL−1 m−2, P = 0.27; 7.9 N ml−1 mmHg−1 m−2, P = 0.53; 0.1 N mmHg−1, P = 0.45; 0.3 N mmHg−1, P = 0.20, respectively), answering more correctly (0.1 N bpm−1, P = 0.05; 0.2 N ml−1 m−2, P = 0.15; 5.7 N ml−1 mmHg−1 m−2, P = 0.42; 0.1 N mmHg−1, P = 0.41; 0.2 N mmHg−1, P = 0.16, respectively), or the time taken to answer questions (–0.03 s bpm−1, P = 0.07; −0.05 s ml−1 m−2, P = 0.25; −2.1 s ml−1 mmHg−1 m−2, P = 0.29; −0.002 s mmHg−1, P = 0.92; −0.06 s mmHg−1, P = 0.07, respectively). These results are presented for the whole group, as interaction tests did not demonstrate significant differences between sexes.
Discussion
Chronic stress in healthy young adults was associated with sex‐specific differences in acute stress responses, cognitive performance and with altered adiposity. Specifically, women reporting high levels of chronic stress had reduced adiposity and augmented cardiovascular and cognitive responses to acute stress. Conversely, chronically stressed men had greater adiposity and reduced cardiovascular stress responses. These results are compatible with differing energy conservation strategies in the sexes that we believe would have benefited humans in their evolutionary past but might promote disease in today's energy‐rich environments.
On average, men and women mounted a broadly similar acute stress response. HR, SVi, COi, CPi, BP and salivary cortisol all rose, while TACi and TPRi fell. The main benefit of these responses, acting in concert, is to increase energy availability, preparing the body for the physical challenges that occur routinely during stress. However, as stressors have become less physical for most humans, such responses may now be less appropriate. Our results also showed that a greater cardiovascular response was linked to better cognitive performance during stress. This combination of better mental and physical performance is designed to overcome a stressful situation but comes at the expense of increased energy utilisation. Besides contributing to energy availability acutely, one function of the cortisol stress response is to stimulate appetite, compensating for this energy loss by increasing food consumption.
Although the sexes had similar average responses to stress, self‐reported levels of chronic stress had very different effects on acute stress responses. We interpret our measure of chronic stress to represent a condition of repetitive, prolonged stimulation of acute stress responses. This usually leads to adaptation (often habituation) of the acute response, as was observed for the men's cardiovascular responses. In women, however, chronic stress was associated with augmented acute cardiovascular stress responses and better cognitive performance during stress. This would deplete energy stores. In addition, chronically stressed women also had lower acute cortisol stress responses and thus would be less likely to restore their depleted energy reserves via appetite stimulation (Groesz et al. 2011). These findings may help explain the lower adiposity seen in the chronically stressed women in our sample.
Adaptation to chronic stress in men was very different from that in women. Men with high levels of chronic stress down‐regulated their acute cardiovascular responses, consistent with lower energy utilisation. However, their acute cortisol responses were not reduced, consistent with undiminished post‐stress appetite stimulation. This combination may help to explain the greater adiposity seen in the chronically stressed men. Importantly, differences in exercise and sleep could not explain the altered adiposity associated with chronic stress in either sex.
Although most sex differences were apparent during stress, some differences were seen at rest. Women experiencing chronic stress had lower COi and CPi, and higher TPRi at rest. These changes are compatible with reduced energy utilisation at rest.
It is unlikely that differing types of chronic stress exposure between the sexes explain our findings, as the components of the PSS did not differ between the sexes. Therefore, we speculate that sex‐specific adaptations revealed in this study are related to different energy conservation strategies that would have been important early in human evolution. On the timescale of human evolution, abundant high‐energy food is a very recent occurrence. Prior to this, chronic stress, whether through social competition, famine or pestilence, would frequently have been accompanied by nutritional poverty. Mechanisms to optimise energy utilisation during stress offer an evolutionary advantage in such circumstances.
To understand differing adaptations in the sexes that may be present today, we should consider our ancestral past. Both sexes might be expected to down‐regulate their stress response during chronic stress exposure in order to conserve energy. However, in our contemporary population, this appeared to have only occurred in men, but not women. We suggest that these physiological differences in adaptation to chronic stress have emerged as a consequence of differing evolutionary pressures on the sexes.
Evolutionary biologists have observed that in animals that carry their fetuses and rear their offspring, investment in offspring differs substantially between sexes (Trivers, 1972). Humans and other primates have offspring that require parental investment for a considerable portion of their lives. Thus, each child is a significant resource burden for its parents but also represents a very different portion of each parents’ reproductive potential. For mothers this portion is substantial, whilst for fathers it can be much smaller. To maximise their reproductive potential with the most efficient use of resources, parents are likely to invest resources in proportion to their ‘reproductive stake’ in their offspring and to prior investment. Evolutionary pressures would favour physiological and behavioural adaptations that promote this approach.
We interpret the findings in our study to suggest that, in times of chronic stress (as indicated by high levels of our chronic stress measure), men may have evolved to consume more of the available food, and store more energy. In turn, this could reduce the remaining food available to their families. By contrast, women may have evolved to do the opposite, becoming thinner during chronic stress. An explanation for this could be that, in contrast to men, women adapt to chronic stress without reducing food availability for other family members. This would be consistent with their greater reproductive stake in their offspring and with recent evidence that females of many species, including humans, have a stress system that differs from that of males, both behaviourally and physiologically, to facilitate the nurturing role of females (Taylor et al. 2000). This female stress response has been termed the ‘tend and befriend’ trait, contrasting with the ‘fight or flight’ trait more characteristic of males, and involves attachment–caregiving neurological systems. Neuroendocrine evidence from animal and human studies suggests that oxytocin, female reproductive hormones and endogenous opioid peptide mechanisms contribute to these differences (Taylor et al. 2000).
Our findings are also consistent with the idea that women might rely more upon previously generated fat stores during periods of chronic stress. Women are known to store considerably more body fat than men in general (Vague, 1956). Our findings support this, with women having 40.3% body fat on average compared to 32.8% in men. This sex difference in fat storage has not been considered previously as a possible necessity that could allow women to overcome periods of chronic stress by relying on their fat stores.
Regardless of potential evolutionary explanations for the sex differences we observed, the different adaptations to chronic stress in the sexes have implications for disease risk. In particular, in a time when most stressors are psychological in nature rather than physical, increased food uptake during chronic stress, as proposed in the men, will lead to a positive energy balance, potentially promoting obesity, insulin resistance, diabetes and cardiovascular disease. The increased acute cardiovascular stress responses seen in the women are also known to promote later cardiovascular disease, which may counteract any benefit of not developing a positive energy balance and thus having reduced levels of obesity (Chida & Steptoe, 2010). Thus, addressing the hypotheses raised in this paper offers improved understanding of the aetiology of important clinical conditions.
We realise that there are likely to be many other factors that contribute to the development of obesity and cardiovascular risk. For example, although there was some racial and socioeconomic variability in our population, the majority were Caucasian and drawn from a relatively affluent suburban area. Therefore, our findings may not generalise to all races, cultures and sociodemographic groups, which are known to have widely varying levels of adiposity and cardiovascular risk (Borders et al. 2006). Furthermore, it should be noted that prior studies have shown varying relationships according to sex between proxy measures of adiposity, such as body mass index (BMI), and various measures of chronic stress that have typically been based on work stress models (Block et al. 2009). For example, in the Whitehall study of British civil servants, high baseline BMI men exposed to work stress gained weight over 5 years but lower baseline BMI men lost weight. Similar associations were not seen in women after adjustment for baseline BMI (Kivimaki et al. 2006). Further analysis in this cohort found that high job strain with low social support at work was associated with becoming obese and developing a high waist circumference in men but not in women (Brunner et al. 2007). A cohort study in the Netherlands showed that men classified as highly ‘emotional’ eaters gained weight for up to 2 years following a negative life event but no similar association was seen in women (Van Strien et al. 1986). A review of cross‐sectional studies of the association between job‐related chronic stress and obesity found only weakly positive associations between elements of psychological workload and overall body weight (Overgaard et al. 2004). The findings were strongest for men, linking job strain with central adiposity, but disappeared after adjustment for educational status. There were no consistent associations in women. The findings of our study need to be considered in the context of these prior studies and support their tendency to show a link between chronic stress and weight gain in men. However, prior evidence is less clear in women. Thus, our finding of lower adiposity in chronically stressed women stands out. Methodological differences between prior studies and ours may offer an explanation. We used a self‐assessed measure of perceived chronic stress (PSS), rather than a domain‐specific model of chronic stress, such as job strain. This could be important as the perceived stress paradigm makes no assumptions about specific sources of stress, in contrast to job‐related stress models. Furthermore, we measured adipose tissue directly, overcoming the well‐known limitations of adiposity assessment using proxy measures such as BMI. BMI is known to be a poor measure of adiposity in some populations, particularly where muscle mass is unusually low or high, for example due to weight training, or when subjects do not have average bone density. This is likely to be particularly important when differences between the sexes are considered.
Our study has shown statistically significant differences between the sexes in the associations of chronic stress exposure with measures of both neuroendocrine and autonomic responsiveness to acute stress. Our findings are not consistent with a simplistic model of universal habituation in response to chronic stress. Instead, they suggest that chronic stress exposure reduces acute autonomic stress responsiveness in men but not in women and reduces neuroendocrine stress responsiveness in women but not in men. These sex differences were statistically significant and extend prior evidence. For example, in a study of men only, work‐related chronic stress was linked to reduced autonomic stress responsiveness measured with circulating noradrenaline (Wirtz et al. 2008). A more recent study showed a similar association between chronic stress and blunting of the acute autonomic stress response in men that was not seen in women (Teixeira et al. 2015). Although work‐related chronic stress has been associated with lower cortisol responses to acute stress (Bellingrath & Kudielka, 2008), we are not aware of any prior studies that have examined sex differences in this association.
Our study has a number of strengths. We have used state‐of‐the‐art imaging techniques to comprehensively assess adiposity and cardiovascular function with degrees of accuracy and reliability that have not been available in the past. This was combined with a stressor that is designed to deliver a consistent level of social stress to all participants and allows for assessment of cognitive performance. Thus, we were able to assess the effects of stress on resource utilisation and on performance simultaneously. However, it should be noted that it is difficult to be certain how well laboratory stressors reproduce more naturalistic stressors. There has been very little study of this issue but one study comparing the ‘natural’ stress of teaching students to a public speaking laboratory stressor failed to show correlations between cortisol responses to these two stressors, despite the mean cortisol response to the naturalistic stressor having a similar magnitude to that seen in laboratory stressors (Wolfram et al. 2013). An additional strength of our study is that we used a well‐characterised population, controlling for confounding effects of disease, social class, race, education, smoking, alcohol consumption and activity levels. However, it should be noted that our population had a strong bias towards higher social classes, was predominantly White and had few smokers. Therefore, our findings may not generalise to all populations. Our study is cross‐sectional and cannot resolve questions about causation. However, we have used our findings to generate new hypotheses about the sex‐specific nature of adaptations to stress and their potential implications for disease risk. This new theoretical framework can now be tested.
In summary, we have shown that the sexes demonstrate marked differences in cardiovascular, neuroendocrine and metabolic function when exposed to chronic stress. These differences have important implications for stress‐related disorders such as obesity, diabetes and cardiovascular disease that have reached epidemic levels in modern societies. We have attempted to explain the differences in terms of energy optimisation strategies that evolved to meet the needs of the sexes in the past. This hypothesis can now be tested and, if validated, may help to explain some diseases as consequences of maladapted physiological stress responses that were optimised for environments in our evolutionary past.
Additional information
Competing interests
None declared.
Author contributions
A.J. designed and performed experiments, analysed data, obtained funding and wrote the paper. J.C.P. designed experiments and wrote the paper. M.R.M. performed experiments, analysed data and revised the paper. R.W.J., G.T.K., J.A.S. and A.M.T designed experiments and revised the paper. B.W. interpreted data and revised the paper. V.M. designed experiments, analysed data and wrote the paper. All authors have approved the final version of the manuscript and agree to be accountable for all aspects of the work. All persons designated as authors qualify for authorship, and all those who qualify for authorship are listed.
Funding
A.J. was supported by a National Institute for Health Research (UK) Specialist Biomedical Research Centre grant, A.M.T. was supported by a National Institute for Health Research (UK) grant and V.M. was supported by a BHF Intermediate Clinical Fellowship grant.
Acknowledgements
We thank the patients and staff of Chorleywood Health Centre for their support of this study and Steven Kimberley for invaluable assistance with running the study. We also thank Rod Jones, Wendy Norman, Romina Linton and Catherine Tiff for their work on data acquisition and Stuart Stagg and Jacob Salmon for engineering support.
This is an Editor's Choice article from the 1 August 2016 issue.
References
- Baecke JA, Burema J & Frijters JE (1982). A short questionnaire for the measurement of habitual physical activity in epidemiological studies. Am J Clin Nutr 36, 936–942. [DOI] [PubMed] [Google Scholar]
- Bellingrath S & Kudielka BM (2008). Effort‐reward‐imbalance and overcommitment are associated with hypothalamus‐pituitary‐adrenal (HPA) axis responses to acute psychosocial stress in healthy working schoolteachers. Psychoneuroendocrinology 33, 1335–1343. [DOI] [PubMed] [Google Scholar]
- Block JP, He Y, Zaslavsky AM, Ding L & Ayanian JZ (2009). Psychosocial stress and change in weight among US adults. Am J Epidemiol 170, 181–192. [DOI] [PMC free article] [PubMed] [Google Scholar]
- Borders TF, Rohrer JE & Cardarelli KM (2006). Gender‐specific disparities in obesity. J Community Health 31, 57–68. [DOI] [PubMed] [Google Scholar]
- Brunner EJ, Chandola T & Marmot MG (2007). Prospective effect of job strain on general and central obesity in the Whitehall II Study. Am J Epidemiol 165, 828–837. [DOI] [PubMed] [Google Scholar]
- Chida Y & Steptoe A (2010). Greater cardiovascular responses to laboratory mental stress are associated with poor subsequent cardiovascular risk status: a meta‐analysis of prospective evidence. Hypertension 55, 1026–1032. [DOI] [PubMed] [Google Scholar]
- Cohen S, Kamarck T & Mermelstein R (1983). A global measure of perceived stress. J Health Soc Behav 24, 385–396. [PubMed] [Google Scholar]
- Groesz LM, McCoy S, Carl J, Saslow L, Stewart J, Adler N, Laraia B & Epel E (2011). What is eating you? Stress and the drive to eat. Appetite 58, 717–721. [DOI] [PMC free article] [PubMed] [Google Scholar]
- Jacobs DR, Jr , Ainsworth BE, Hartman TJ & Leon AS (1993). A simultaneous evaluation of 10 commonly used physical activity questionnaires. Med Sci Sports Exerc 25, 81–91. [DOI] [PubMed] [Google Scholar]
- Jones A, McMillan MR, Jones RW, Kowalik GT, Steeden JA, Deanfield JE, Pruessner JC, Taylor AM & Muthurangu V (2012). Adiposity is associated with blunted cardiovascular, neuroendocrine and cognitive responses to acute mental stress. PLoS One 7, e39143. [DOI] [PMC free article] [PubMed] [Google Scholar]
- Jones A, Steeden JA, Pruessner JC, Deanfield JE, Taylor AM & Muthurangu V (2011). Detailed assessment of the hemodynamic response to psychosocial stress using real‐time MRI. J Magn Reson Imaging 33, 448–454. [DOI] [PubMed] [Google Scholar]
- Kajantie E & Phillips DIW (2006). The effects of sex and hormonal status on the physiological response to acute psychosocial stress. Psychoneuroendocrinology 31, 151–178. [DOI] [PubMed] [Google Scholar]
- Kim H, Taksali SE, Dufour S, Befroy D, Goodman TR, Petersen KF, Shulman GI, Caprio S & Constable RT (2008). Comparative MR study of hepatic fat quantification using single‐voxel proton spectroscopy, two‐point dixon and three‐point IDEAL. Magn Reson Med 59, 521–527. [DOI] [PMC free article] [PubMed] [Google Scholar]
- Kivimaki M, Head J, Ferrie JE, Shipley MJ, Brunner E, Vahtera J & Marmot MG (2006). Work stress, weight gain and weight loss: evidence for bidirectional effects of job strain on body mass index in the Whitehall II study. Int J Obes (Lond) 30, 982–987. [DOI] [PubMed] [Google Scholar]
- Kowalik G, Steeden JA, Atkinson D & Muthurangu V (2011). A networked GPU reconstructor within the clinical workflow for rapid fat quantification. In Proceedings of the 19th Annual Meeting of ISMRM (Abstract 2708; http://cds.ismrm.org/protected/11MProceedings/files/1_program.htm ).
- McEwen BS (2007). Physiology and neurobiology of stress and adaptation: central role of the brain. Physiol Rev 87, 873–904. [DOI] [PubMed] [Google Scholar]
- McEwen BS (2012). Brain on stress: how the social environment gets under the skin. Proc Natl Acad Sci USA 109, Suppl 2, 17180–17185. [DOI] [PMC free article] [PubMed] [Google Scholar]
- McNamara JM & Buchanan KL (2005). Stress, resource allocation, and mortality. Behav Ecol 16, 1008–1017. [Google Scholar]
- Overgaard D, Gyntelberg F & Heitmann BL (2004). Psychological workload and body weight: is there an association? A review of the literature. Occup Med (Lond) 54, 35–41. [DOI] [PubMed] [Google Scholar]
- Office for National Statistics (2012). The National Statistics Socio‐economic Classification. http://www.ons.gov.uk/ons/guide‐method/classifications/current‐standard‐classifications/soc2010/soc2010‐volume‐3‐ns‐sec–rebased‐on‐soc2010–user‐manual/index.html (accessed 12th February 2012).
- Steeden JA, Atkinson D, Hansen MS, Taylor AM & Muthurangu V (2011). Rapid flow assessment of congenital heart disease with high‐spatiotemporal‐resolution gated spiral phase‐contrast MR imaging. Radiology 260, 79–87. [DOI] [PMC free article] [PubMed] [Google Scholar]
- Taylor SE, Klein LC, Lewis BP, Gruenewald TL, Gurung RA & Updegraff JA (2000). Biobehavioral responses to stress in females: tend‐and‐befriend, not fight‐or‐flight. Psychol Rev 107, 411–429. [DOI] [PubMed] [Google Scholar]
- Teixeira RR, Diaz MM, Santos TV, Bernardes JT, Peixoto LG, Bocanegra OL, Neto MB & Espindola FS (2015). Chronic stress induces a hyporeactivity of the autonomic nervous system in response to acute mental stressor and impairs cognitive performance in business executives. PLoS One 10, e0119025. [DOI] [PMC free article] [PubMed] [Google Scholar]
- Trivers RL (1972). Parental investment and sexual selection In Sexual Selection and the Descent of Man 1871–1971, ed. Campbell B, pp. 136–179. Aldine, Chicago. [Google Scholar]
- Vague J (1956). The degree of masculine differentiation of obesities: a factor determining predisposition to diabetes, atherosclerosis, gout, and uric calculous disease. Am J Clin Nutr 4, 20–34. [DOI] [PubMed] [Google Scholar]
- Van Strien T, Rookus MA, Bergers GP, Frijters JE & Defares PB (1986). Life events, emotional eating and change in body mass index. Int J Obes 10, 29–35. [PubMed] [Google Scholar]
- Williams SG, Cooke GA, Wright DJ, Parsons WJ, Riley RL, Marshall P & Tan LB (2001). Peak exercise cardiac power output; a direct indicator of cardiac function strongly predictive of prognosis in chronic heart failure. Eur Heart J 22, 1496–1503. [DOI] [PubMed] [Google Scholar]
- Wirtz PH, Siegrist J, Rimmele U & Ehlert U (2008). Higher overcommitment to work is associated with lower norepinephrine secretion before and after acute psychosocial stress in men. Psychoneuroendocrinology 33, 92–99. [DOI] [PubMed] [Google Scholar]
- Wolfram M, Bellingrath S, Feuerhahn N & Kudielka BM (2013). Cortisol responses to naturalistic and laboratory stress in student teachers: comparison with a non‐stress control day. Stress Health 29, 143–149. [DOI] [PubMed] [Google Scholar]