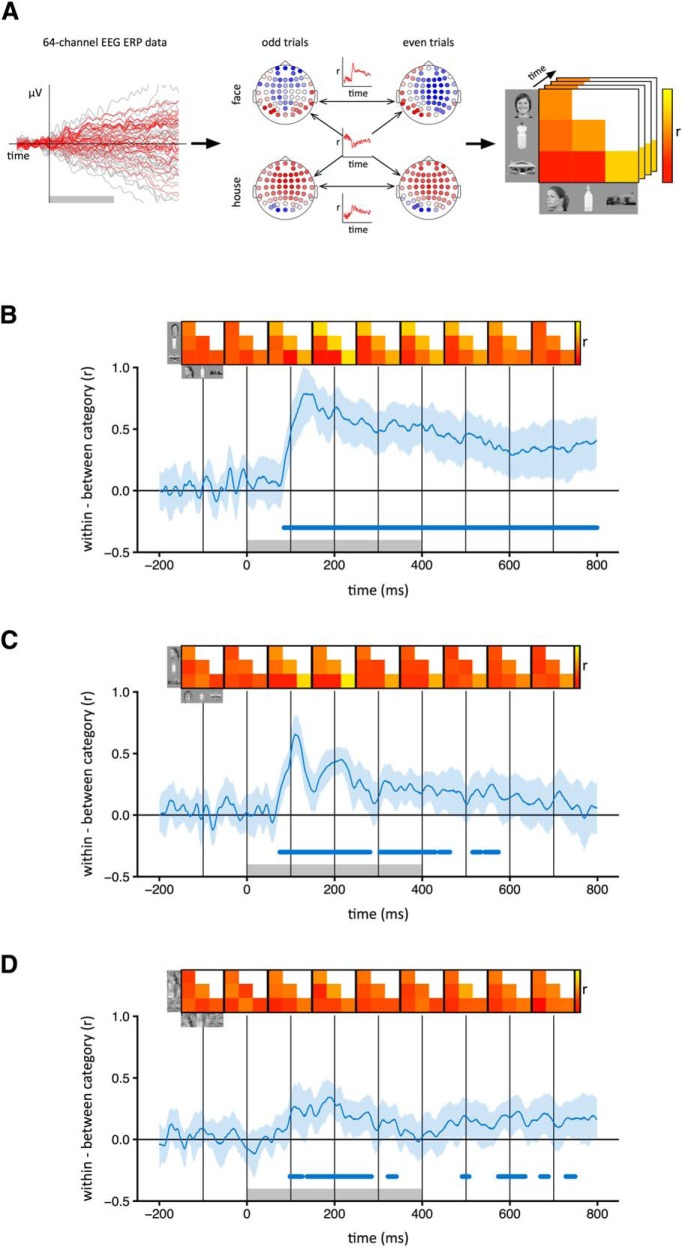
Figure 2.
Category-specific patterns of EEG response to intact and scrambled images. A, For each time point, normalized patterns of response to odd and even trials of each category were compared across 64 electrodes. The correlation coefficients were then represented in a similarity matrix for that time point. Distinct category-specific patterns of response were defined by higher within-category (e.g., face–face) compared to between-category (e.g., face–bottle) correlations. B–D, Correlation time-courses are shown for the intact (B), locally scrambled (C), and globally scrambled (D) image types. The shaded region represents 95% CIs obtained by bootstrapping across participants. Group mean correlation matrices at 100 ms intervals are shown above the plot. Gray box at the base of the plot represents the time points at which the stimulus was present. Blue bar at the base of the plot represents time points at which the lower bound of the CI is >0, indicating significantly higher within-category correlations than between-category correlations.

