



Abstract
Context
NO2 and O3 are ubiquitous air toxicants capable of inducing lung damage to the respiratory epithelium. Due to their oxidizing capabilities, these pollutants have been proposed to target specific biological pathways, but few publications have compared the pathways activated.
Objective
This work will test the premise that NO2 and O3 induce toxicity by activating similar cellular pathways.
Methods
Primary human bronchial epithelial cells (HBECs, n = 3 donors) were exposed for 2 hours at an air-liquid interface to 3 ppm NO2, 0.75 ppm O3, or filtered air and harvested 1 hr post-exposure. To give an overview of pathways that may be influenced by each exposure, gene expression was measured using PCR arrays for toxicity and oxidative stress. Based on the results, genes were selected to quantify whether expression changes were changed in a dose- and time-response manner using NO2 (1, 2, 3, or 5 ppm), O3 (0.25, 0.50, 0.75, or 1.00 ppm), or filtered air and harvesting 0, 1, 4 and 24 hrs post-exposure.
Results
Using the arrays, genes related to oxidative stress were highly induced with NO2 while expression of pro-inflammatory and vascular function genes were found subsequent to O3. NO2 elicited the greatest HMOX1 response, whereas O3 more greatly induced IL-6, IL-8, and PTGS2 expression. Additionally, O3 elicited a greater response 1 hr post-exposure and NO2 produced a maximal response after 4 hrs.
Conclusion
We have demonstrated that these two oxidant gases stimulate differing mechanistic responses in vitro and these responses occur at dissimilar times.
Keywords: Nitrogen dioxide, ozone, oxidant, inflammation, oxidative stress, in vitro
Introduction
Nitrogen dioxide (NO2) and ozone (O3) are ubiquitous, highly reactive gaseous air pollutants regulated by the United States Environmental Protection Agency (US EPA) and the World Health Organization (WHO). Both pollutants are components found in photochemical smog and their toxicity is generally attributed to their high oxidative potential.
NO2 is a brown/orange, pungent, free radical gas found in both indoor and outdoor environments. Common ambient sources of NO2 include mobile emissions, fuel combustion, industrial processes, and fires, and concentrations of NO2 in outdoor urban air range from 0.01–0.04 ppm with peak concentrations of 0.50 ppm NO2 (WHO, 2005). Indoor concentrations of NO2, largely attributed to unvented gas combustion sources, often exceed those measured outdoors, and concentrations of NO2 can reach as high as 1 ppm (WHO, 2005). Other environments where elevated NO2 concentrations (2–5 ppm) have been found include inside power plants (Carbone et al., 2014) and unvented ice hockey rinks (Pelham et al., 2002, Lee et al., 1994), in the workplaces of welders (Azari et al., 2011), in traffic (Persinger et al., 2002), and directly outside farming silos (Pavelchak et al., 1999). In controlled human exposure studies, acute exposures to NO2 have resulted in increased PMN production found in bronchial washings (Devlin et al., 1999, Blomberg et al., 1997), suggesting that NO2 can elicit changes to underlying inflammation-related events in the respiratory system. In vitro studies of NO2 have also corroborated this effect. In studies where normal human bronchial epithelial cells (HBECs) were exposed to NO2, increases in pro-inflammatory cytokines, including IL-8 and IL-1β, have been observed (Ayyagari et al., 2004, Devalia et al., 1993). This trend of increasing IL-8 was also observed in HBECs obtained from both normal as well as asthmatic subjects exposed to NO2 (Bayram et al., 2001). In addition to inflammation, additional work has also found increases in HMOX1 gene expression both in normal HBECs (Ayyagari et al., 2007) and in a mouse model (Johnston et al., 2000) following exposures to NO2, suggesting that NO2 elicits a pro-oxidative stress response as well. In combining the results from the human, animal, and cell models, it appears that NO2 is capable of inducing both an underlying pro-inflammatory and pro-oxidative stress response in the lung.
O3, a secondary air pollutant, is formed by the photochemical reaction of NO2, volatile organic compounds, and sunlight in the atmosphere, and O3 is the main component in photochemical smog. As a result of its dependence on sunlight for formation, O3 exhibits strong diurnal and seasonal patterns, where it is elevated in the afternoon hours and during the summer months. In the vicinity of high NO2 emission sources O3 is scavenged and found in low abundance, such as near busy urban centers and roadways. However, O3 concentrations are higher in suburban and rural locations, and subject to long-range transport. Unlike NO2, ambient concentrations of O3 are much higher than indoor sources, and have been extensively studied with respect to their associated health effects. Large-scale studies have associated O3 exposure with mortality (Jerrett et al., 2009), incidence of asthma and asthma-related symptoms (McDonnell et al., 1999, McConnell et al., 2002), and reduced lung function (Gauderman et al., 2002, Peters et al., 1999). Controlled human studies of O3 support the results obtained from epidemiological work, with decreases in lung function (Devlin et al., 2012, Horstman et al., 1990, McDonnell et al., 1991) and increases in airway reactivity (McDonnell et al., 1991) observed subsequent to inhaling O3. Additionally, pulmonary inflammation is consistently observed in human subjects following O3 exposures; this is evidenced by increases in IL-6 and IL-8 measured in bronchoalveolar fluid (Devlin et al., 1991, Koren et al., 1991, Krishna et al., 1998, Devlin et al., 1996, Devlin et al., 2012). Increases in pro-inflammatory-related endpoints have also been observed using cell (McCullough et al., 2014, Hatch et al., 2014, Rusznak et al., 1996) and mice models (Sunil et al., 2013, Sunil et al., 2012, Park et al., 2004) by measuring the induction of pro-inflammatory cytokines including IL-8, IL-6, PTGS2, and IL-1β. Thus, ozone is a potent oxidizing gas capable of disrupting pulmonary function and enacting short-term damage to the airways.
Many studies propose that NO2 and O3 elicit responses through similar mechanisms (Johnston et al., 2001, Johnston et al., 2000); however, there is a growing body of evidence suggesting that the toxic mode of action between NO2 and O3 is distinct (Kleeberger et al., 1997, Rietjens et al., 1986). These contradictory viewpoints suggests the need for more research to better understand how these gases lead to adverse human health effects. In this study we analyzed and compared the biological pathways altered by NO2 and O3 by looking at changes in the relative gene expression in HBECs exposed to these gases. The HBECs were collected via a brush biopsy of healthy human volunteers and exposed at the air-liquid interface (ALI), which we believe represents the best currently available in vitro system for assessing the effects of inhaled toxicants. The results obtained in this work suggest NO2 and O3 do not induce biological effects in a similar manner but rather have different modes of action.
Methods
Cell culture
Primary human bronchial epithelial cells (HBECs) were obtained via a brush biopsy of healthy, nonsmoking adult volunteers. Once collected, the HBECs from each brush were placed in a 15 mL sterile, plastic tube with bronchial epithelial growth medium (BEGM, Clonetics, Cambrex Corp, East Rutherford, NJ) and plated on plastic tissue culture plates (Corning, Inc. Wilkes-Barre, PA). The cells, submerged with media, were expanded until passage 3, seeded on 0.4 micron pore size uncoated 12-well Transwell filters (Corning, Inc.) at a density of 1 × 10⁵ cells/well, and were expanded and grown at the air-liquid interface (ALI) for 4–8 days as previously described (Ross et al., 2007). The Institutional Review Board protocol and consent forms for the acquisition of the HBECs were approved by the University of North Carolina at Chapel Hill as well as the United States Environmental Protection Agency.
Nitrogen dioxide and ozone exposures
Prior to each exposure the apical surface of each Transwell was washed with Dulbecco’s phosphate buffered saline (Life Technologies, Grand Island, NY) and fresh media was added into the basolateral compartment. The cells were then exposed to 4 different concentrations of nitrogen dioxide (1 ppm, 2 ppm, 3 ppm, or 5 ppm) or ozone (0.25 ppm, 0.50 ppm, 0.75 ppm, or 1.00 ppm) for 2 hours in exposure chambers held at 37.5 °C, 5% CO2, and 88% relative humidity (Devlin et al., 1994, McKinnon et al., 1993, Bauer et al., 2015). Simultaneous to each NO2 and O3 exposure, additional cells were exposed to filtered air at the same temperature, humidity, and air flow rate that was used for the pollutant exposures; this served as our negative control. Previous studies by us and others have shown that these O3 concentrations do not cause more than minimal (5% or less) decreases in cell viability as measured with lactate dehydrogenase (LDH) release assay (Hatch et al., 2014). In addition, LDH was measured in NO2-exposed cells for this study and minimal inductions were measured (1% or less) at the concentrations assessed. At 0, 1, 4, and 24 hrs after each exposure (pollutant or filtered air) the Transwells were washed with 200 µL PBS and the cells were lysed for mRNA collection and extraction using the RNeasy kit (Qiagen, Valencia, CA) according to the manufacturer’s protocols. Total cellular RNA was quantified using a Nanodrop Spectrometer (ND-1000) and reverse transcribed to cDNA using the iScript cDNA Synthesis Kit (Bio-Rad, Hercules, CA). For each donor, samples were run using biological duplicates for individual time points and concentrations.
Pathway-focused gene expression arrays
HBECs from 3 donors exposed for 2 hrs to 3 ppm NO2, 0.75 ppm O3, and a filtered air control were run on two pathway-focused gene expression PCR arrays. Only HBECs harvested 1 hr post-exposure were used. The concentration of O3 was selected based on past work conducted in our laboratory in which bronchial epithelial cells were exposed in a dose-response manner to O3 (0–1 ppm) and inductions of IL-8 and IL-6 were measured at each concentration (Devlin et al., 1994). Non-toxic increases in these genes were found following exposures to 0.75 ppm O3, which was the concentration chosen for this pollutant. The concentration of NO2 (3 ppm) was chosen based on a previous study comparing O3 and NO2 toxicity, using our 0.75 ppm O3 concentration as a reference in determining the concentration to be used for NO2. Specifically, Johnston (2000) conducted a study in which they exposed mice lungs to NO2 (15 or 30 ppm) and O3 (1 or 2.5 ppm), and similar inductions of MT3 and HMOX1 were found between the 2.5 ppm O3 and 15 ppm NO2 concentrations. This suggests that O3 is approximately six times more toxic than NO2 when looking at changes in gene expression for these selected genes. For our PCR array, we went with a slightly more conservative comparison and assessed a concentration of NO2 that was only 4 times greater than that of O3. A 1 hr time point post-exposure was selected based on a preliminary time-response curve of IL-8 gene expression changes following O3 exposures.
The relative gene expression of 84 genes relating to toxicity was quantified using a PrimePCR Pathway Plate for Human Stress and Toxicity with the SAB target list (Bio-Rad) on a 96-well format according to the protocol given by the manufacturer. The Stress and Toxicity Arrays were run on a StepOne Plus Real-Time PCR system (Applied Biosystems). The relative gene expression of 84 genes relating to oxidative stress was quantified using a RT2 Profiler PCR Array for Human Oxidative Stress and Antioxidant Response (SABiosciences Corp, Frederick, MD) on a 96-well format according to the protocol given by the manufacturer. The Human Oxidative Stress and Antioxidant Response Arrays were run on a 7500 Real-time PCR system (Applied Biosystems). Both PCR arrays offer reliable information on a multitude of genes across various exposure scenarios.
Real-time polymerase chain reaction
Relative expression of specific genes was quantified using real-time polymerase chain reaction (RT-PCR). RT-PCR was completed using iTaq Universal Probes Supermix (Bio-Rad) and primer/probe sets of interest, and the samples were run using a StepOne Plus Real-Time PCR system (Applied Biosystems). Primer/probe sets for IL-6, IL-8, PTGS2, HMOX1, and TLR4 were designed in-house. TaqMan Gene Expression Assay primer/probe sets for ADM, MMP9, MT3, TXNRD1, AOX1, FOXM1, SERPINE1, BBC3, and ATM were purchased from Life Technologies. For each biological duplicate, samples were run in technical triplicates.
Statistical analysis
Prism 4.0 (GraphPad, San Diego, CA) was used for all statistical analyses, and the results are reported as the mean ± standard error (SEM) unless otherwise noted. Fold changes for the PCR arrays were calculated relative to a filtered air negative control, using the ΔΔCt method by normalizing to the average of a subset of housekeeping genes included on each plate (Livak and Schmittgen, 2001). Fold changes for the RT-PCR data, relative to a filtered air negative control from each corresponding time point, were calculated using the ΔΔCt method by normalizing to β-actin (Life Technologies) and averaging the results from the biological duplicates and technical triplicates. All data were tested for normality using the Kolmogorov-Smirnov test and then analyzed using 1-factor analysis of variance (ANOVA). To test for comparisons between filtered air and the various concentrations of each gas, Tukey’s Multiple Comparison Test was used. Statistical significant was set for a p-value < 0.05.
Results
Pathway-focused gene expression arrays
PCR arrays offer a quick, reliable, and simple approach to compare the response of various pathway-associated genes that may be perturbed by exposures of NO2 and O3. The Stress and Toxicity PCR Array covered genes from multiple pathways, including DNA damage, hypoxia, inflammation, oxidative stress, and heat shock. This PCR array was selected to give a wide overview of various and unique pathways that may be influenced by O3 or NO2 exposures, which could ultimately be used to narrow down specific pathways and genes of interest. Based on the results obtained from the Stress and Toxicity PCR array, an additional PCR array specific to oxidative stress was also run using the same cDNA samples.
Stress and Toxicity PCR Array
Of the 84 genes encompassing the multiple pathways represented in the Stress and Toxicity PCR Array, thirty-three genes were identified in which the average fold changes were either greater than 1.5 or less than −1.5 following pollutant exposures to either one or both gases. When comparing the expression profiles between NO2 and O3 across the pathways represented on this array, those related to inflammation (IL-6, CCL2, IL-1β, IL-8) and vascular function (ADM, MMP9) were the most highly expressed following exposure to O3. This was contrary to NO2, in which genes related to oxidative stress (HMOX1, TXNRD1) were highly elevated, and those that showed reduced gene expression were involved in inflammation (IL-6, CCL2), DNA damage (ATM), and hypoxia (EPO). A heat map demonstrating these results can be seen in Figure 1.
Figure 1. Gene expression heat maps generated using a PrimePCR Pathway Plate of the Stress and Toxicity SAB Target List (Bio-Rad).

A total of 84 genes were assessed following exposures to 0.75 ppm O3 (n = 3) or 3 ppm NO2 (n = 3). Using a cut-off of a 1.5 fold increase or decrease, 33 genes were differentially upregulated or downregulated between the 2 exposure scenarios. Fold changes were calculated relative to a filtered air control.
Human Oxidative Stress and Antioxidant Defense PCR Array
As genes related to oxidative stress, in particular HMOX1, were more highly expressed following exposures of HBECs to NO2 using the Stress and Toxicity PCR Array, the same donor samples were run on a Human Oxidative Stress and Antioxidant Defense PCR Array to further define changes in oxidative stress/antioxidant defense pathways. After analysis, 27 genes were identified in which the average fold changes were either greater than 1.5 or less than −1.5 in one or both pollutants. A gene expression heat map for these genes can be seen in Figure 2. The majority of genes represented on the Human Oxidative Stress and Antioxidant Defense PCR Array were found to have elevated gene expression after NO2 exposures, compared to O3. Amongst these were genes related to the binding of heavy metals (MTL5, MT3), scavenging reactive oxygen species (GPX5), cell cycle progression (FOXM1), and inflammation (CCL5). However, the mRNA expression of some genes were more greatly elevated following O3 exposures compared to NO2, including PTGS2, which is also associated with an inflammatory response. Thus, it appears that over a wide range of oxidative stress-related genes NO2 induces a greater response compared to O3.
Figure 2. Gene expression heat maps generated using a Human Oxidative Stress and Antioxidant Defense RT2 Profiler PCR Array (SABiosciences).

A total of 84 genes were assessed following exposures to 0.75 ppm O3 (n = 3) or 3 ppm NO2 (n = 3). Using a cut-off of a 1.5 fold increase or decrease, 27 genes were differentially upregulated or downregulated between the 2 exposure scenarios. Fold changes were calculated relative to a filtered air control.
Real-time polymerase chain reaction
Based on the results from the pathway-focused gene expression PCR arrays, several genes were selected to quantify whether changes in gene expression could be observed at several concentrations and times after exposure. The genes selected for the time- and dose-response represented those: 1) where differences between NO2 and O3 were noted in the PCR arrays; and 2) from pathways that were consistently either up- and down-regulated by either pollutant. In general, only slight increases in gene expression were observed at the 0 hr time point, suggesting that gene expression changes are not immediate. Gene expression responses returned back to baseline levels by 24 hrs post-exposure. Thus, only the mRNA expression from the 1 and 4 hrs post-exposure harvest are shown in the subsequent Figures. Preliminary data from several genes that seemed to be elevated in the PCR array (ADM, MMP9, MT3, TXNRD1, AOX1, FOXM1, SERPINE1, BBC3, ATM, and TLR4) showed minimal inductions in gene expression (< 2 fold) for either pollutant when run using PCR (data not shown).
Expression of pro-inflammatory related genes (IL-8, PTGS2, IL-6)
The mRNA expression for IL-8 following NO2 and O3 exposures can be seen in Figure 3. In agreement with the PCR array (Figure 1), IL-8 mRNA expression 1 hr post-O3 exposure was statistically elevated relative to a filtered air control for 0.50, 0.75, and 1.00 ppm concentrations (Figure 3A). At 4 hrs post-exposure (Figure 3B) the response of the HBECs to O3 decreased to an approximate 2 fold induction; but were still significantly elevated compared to filtered air for 0.50, 0.75, and 1.00 ppm O3. NO2 appeared to have a minimal impact on the expression of IL-8 at 1 hr after exposure. However, not following a dose-response curve, only the highest NO2 concentration (5 ppm) caused a significant elevation in IL-8 mRNA expression at 4 hrs post-exposure (p < 0.01).
Figure 3. mRNA expression of IL-8 following 2 hr long exposures of HBECs to various concentrations of O3 and NO2 at A) 1 hr post exposure and b) 4 hrs post exposure.
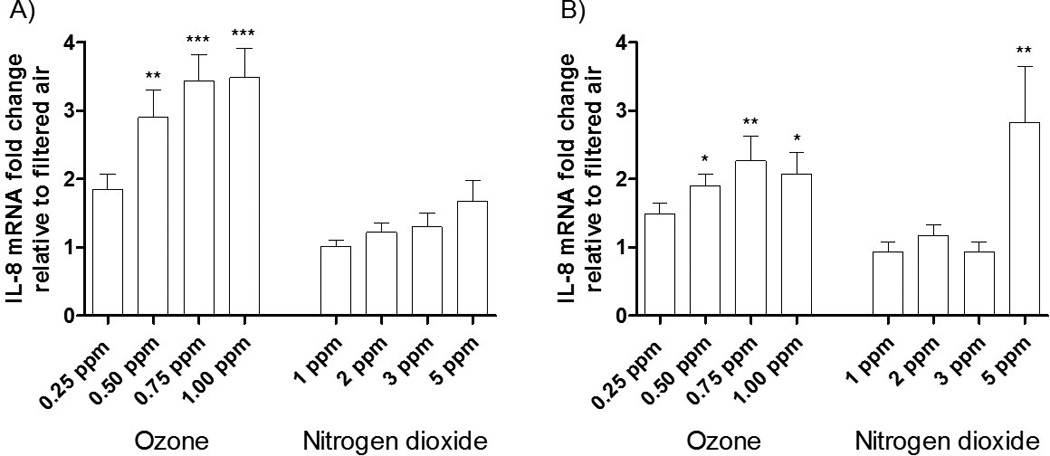
The data is expressed as the mRNA fold change relative to a filtered air control. Data were analyzed using 1-factor ANOVA for dose, followed by Tukey’s Multiple Comparison Post Test. p-values were calculated between treatments and the filtered air control. * p-value < 0.05, ** p-value < 0.01, *** p-value < 0.001. N = 5 donors.
Inductions of PTGS2 mRNA gene expression were comparable to those found with IL-8 for the O3- and NO2-exposed HBECs at their respective times and concentrations, including an increase in PTGS2 mRNA 4 hrs post-exposure to NO2. In contrast Figure 5 shows no statistically significant increases in the mRNA expression of IL-6 following exposures to either O3 or NO2. At 1 hr post-exposure IL-6 mRNA levels are substantially elevated, even higher than levels of IL-8 or PTGS2. However, the large SEM associated with this mRNA prevents these changes from being statistically significant. The large inductions in IL-6 mRNA following O3 exposures, compared to a filtered air control, are consistent with the results from the PCR array (Figure 1).
Figure 5. mRNA expression of IL-6 following 2 hr long exposures of HBECs to various concentrations of O3 and NO2 at A) 1 hr post exposure and b) 4 hrs post exposure.
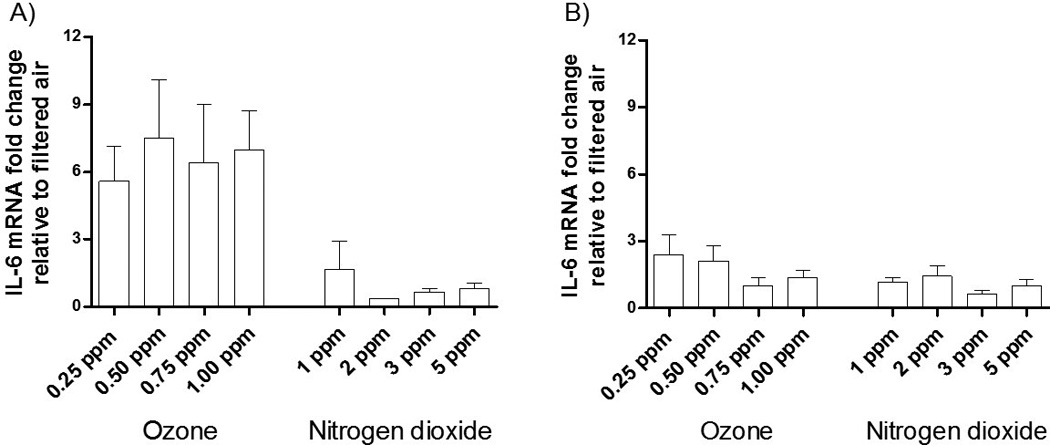
The data is expressed as the mRNA fold change relative to a filtered air control. Data were analyzed using 1-factor ANOVA for dose. N = 3 donors.
Expression of an oxidative-stress related gene (HMOX1)
Due to the large induction of HMOX1 mRNA expression after the exposure of HBECs to 3 ppm NO2 (Figure 1), HMOX1 was also selected for a detailed time- and dose-response with both NO2 and O3. At 1 hr post-exposure, O3-induced increases in mRNA expression of HMOX1 can be seen in a dose-response manner (Figure 6). Elevations in HMOX1 mRNA expression were significant for 0.50, 0.75, and 1.00 ppm O3 compared to a filtered air control. Additionally, elevations in mRNA HMOX1 expression were found following exposures of HBECs to NO2. However because of a large SEM, only the 5 ppm concentration caused a statistically significant increase.
Figure 6. mRNA expression of HMOX1 following 2 hr long exposures of HBECs to various concentrations of O3 and NO2 at A) 1 hr post exposure and b) 4 hrs post exposure.

The data is expressed as the mRNA fold change relative to a filtered air control. Data were analyzed using 1-factor ANOVA for dose, followed by Tukey’s Multiple Comparison Post Test. p-values were calculated between treatments and the filtered air control. * p-value < 0.05, ** p-value < 0.01, *** p-value < 0.001. N = 5 donors.
Differences in kinetics between NO2 and O3 responses
The purpose of the time-response was to determine whether there were differences in the time it takes to reach a maximum gene expression response between NO2 and O3. From the times selected for post-exposure measurements for this work (0, 1, 4, 24 hrs), minimal changes were observed at 0 hrs post-exposure, with most responses returning back to baseline levels after 24 hrs. A consistent induction in gene expression for O3-exposed cells was found after 1 hr post-exposure, whereas NO2 elicited the greatest inductions in gene expression 4 hrs post-exposure (Figures 3–6). Thus, it is possible that in addition to eliciting responses via differing mechanisms the kinetics of responses might differ between HBECs exposed to NO2 and O3 as well.
Discussion
In this study we compared and contrasted biological cellular pathways activated by NO2 and O3, two oxidant gases previously hypothesized to elicit adverse effects through similar mechanisms. We assessed changes in the relative gene expression of 168 genes associated with multiple toxicity pathways in primary human bronchial epithelial cells after acute exposures to either NO2 or O3. We determined that O3 was a greater inducer of pro-inflammatory genes compared to NO2. However, NO2 induced a greater response in genes associated with oxidative stress compared to O3. Thus our results suggest that NO2 and O3 do not elicit adverse effects in a similar manner and may have different toxic modes of action.
Several studies have done side-by-side comparisons of acute exposures to NO2 and O3 to address whether these two oxidant gases elicit responses in similar manners. The advantages of doing a parallel comparison of NO2 and O3 include similar models, exposure conditions, and experimental methods. Within these studies, some work suggests that the manner that each gas elicits an adverse effect is not analogous. This belief is based on research demonstrating discordance for susceptibility among inbred mice strains exposed to both pollutants (Kleeberger et al., 1997), suggesting that mechanisms of susceptibility are not the same for NO2 and O3. In contrast, Johnston et al. (2000) exposed mice to 15–30 ppm NO2, 1–2.5 ppm O3, or filtered air. Using a multicytokine ribonuclease protection assay, this group observed increases in metallothionein (Mt) and HMOX1 gene expression from RNA extracted in lung tissue following both exposures, suggesting that that NO2 and O3 elicit effects in a similar manner. In other published work by this group it was suggested that the recovery from NO2 and O3-induced oxidant injury occur similarly as well based on similar, but limited, gene expression responses (Johnston et al., 2001). The results from the current study support those of the former suggesting that NO2 and O3 do not elicit effects via a similar mechanism.
In a recently published review by Li et al. (2013), the authors describe various events in the airways that can lead to an inflammatory response in the lung. In our work we looked at one aspect of this inflammatory response – the production of cytokines – by measuring the relative expression of genes associated with inflammation. Similar to previous in vitro studies of O3, we found increased mRNA accumulation from IL-8, IL-6, PTGS2, and IL-1β (McCullough et al., 2014, Hatch et al., 2014, Rusznak et al., 1996, Devlin et al., 1994, McKinnon et al., 1993). Additionally, this in vitro pro-inflammatory response has been corroborated in animal (Sunil et al., 2013, Sunil et al., 2012, Park et al., 2004) and human research (Devlin et al., 1991, Koren et al., 1991, Krishna et al., 1998, Devlin et al., 1996). Thus, there is overwhelming evidence from in vitro, animal, and human exposure studies that O3 is capable of producing a pro-inflammatory response in the airways, consistent with results from the current study.
Compared to O3, there is a paucity of data on the inflammatory effects of NO2 in the respiratory system. In the current study, slight increases in the pro-inflammatory genes IL-8, PTGS2, and IL-1β were observed following exposures to NO2. Similarly, in a previous study where normal human bronchial epithelial cells were exposed to 45 ppm NO2, increases in IL-8 and IL-1β protein concentration were observed (Ayyagari et al., 2004). It should be noted, however, that a concentration of 45 ppm NO2 is at least an order of magnitude higher than people would normally be exposed to in typical environmental and occupational situations. Using more environmentally relevant concentrations, Devalia et al. (1993) exposed HBECs extracted from the airways of smoking donors to 0.4 and 0.8 ppm NO2 and observed a 2-fold induction of IL-8. Although this induction is greater than that reported in the current study, it is possible that differences in donors, cell culture, smoking status, and length of exposure could have contributed to this variance. In addition to using cellular models, researchers have also examined the inflammatory response in human subjects exposed under controlled conditions to NO2; small increases in pro-inflammatory markers were found (Blomberg et al., 1997). Further, no detectable inflammatory response was observed in nasal lavage or sputum of asthmatics or subjects presenting with COPD (Vagaggini et al., 1996) and exposed to NO2. Thus, only slight increases in inflammation have been found in human subjects exposed to NO2.
The induction of HMOX1 occurs as a general oxidative stress response in biological systems and is hypothesized to be mediated by a transient increase in intracellular reactive oxygen species (Ryter et al., 2006). In the current study we used HMOX1 gene expression as a marker of oxidative stress, and found greater increases in HMOX1 following exposures to NO2 compared to O3. Consistent with our results Ayyagari et al. (2007) observed increases in HMOX1 expression in normal human bronchial epithelial cells after NO2 exposure. Further, using an in vivo mice model increases in HMOX1 were observed in the lungs after exposures to NO2 (Johnston et al., 2000). Thus, it appears that using different models of toxicity HMOX1 was found to be induced by NO2 exposures. In our work we found minimal inductions of HMOX1 following our acute O3 exposure, and this result has also been corroborated in previously conducted studies (Takahashi et al., 1997, Wiegman et al., 2014). This evidence, in addition to our work, suggests that HMOX1 may not be involved in acute respiratory responses in the lungs following O3 exposures.
Although the work presented in this paper adds credence to the literature supporting differential toxic mechanisms for NO2 and O3, several limitations to this work exist. First, we did not measure protein content. While it is possible that changes in mRNA do not correlate to an increase in protein concentration, many studies have found similar inductions in both the RNA and protein for the genes measured in this work. Additionally, we acknowledge that NO2 and O3 deposit in different places in the airways, with NO2 depositing mainly in the terminal bronchioles and O3 depositing in the proximal airways (Sandstrom, 1995, Hatch et al., 2014). Therefore, it is possible that using bronchial epithelial cells might not be the best model of toxicity for where these gases are the most damaging. Additionally, it has been shown that NO2 and O3 can react with the surface lining layer of the airways (Postlethwait and Bidani, 1994, Ballinger et al., 2005, Connor et al., 2004) and interactions with components in this fluid may be a mechanisms for toxicity. It would be nearly impossible to recapitulate, in vitro, the complexity or depth of the lung lining fluid; however, all wells were treated in a similar manner and in biological duplicates to minimize differences. We also acknowledge that macrophages are capable of releasing markers of inflammation and oxidative stress (Rietjens et al., 1986, Sunil et al., 2012, Tighe et al., 2011) and were not studied in this current work. Lastly, using an in vitro model does not provide evidence that these differential responses occur in vivo. Despite these limitations, we still believe using HBECs represents the best cellular model to assess any adverse respiratory responses related to inhaled pollutants. Compared to transformed cell lines, using human primary cells have recently been shown to activate different pro-inflammatory pathways after O3 exposures and thus cell lines may be unreliable in assessing toxicity mechanisms (McCullough et al., 2014). It should be noted that a limitation of using primary cells is a restriction on the number of passages and the number of cells obtained from each donor. For this work, we were unable to use the same donor cells for the O3 exposures as we used for NO2 exposures. To overcome this limitation we used a modest sample size of 3–5 donors for each experiment; we saw relatively little variability between the standard errors observed for each experimental condition tested, suggesting that the variability between the donors was low for the outcomes tested. We also have a single concentration (1 ppm) that overlaps between both pollutants to allow for comparison between gene expression changes associated with NO2 and O3 exposures. However, including additional concentrations in common might have allowed for a more complete comparison, although cellular responses were observed at lower concentrations of O3 than NO2, potentially making overlapping concentration curves problematic.
Conclusions
In conclusion, the results from our work suggest that HBECs exposed to varying concentrations of NO2 and O3 do not appear to elicit adverse effects in a similar manner and may have different toxic modes of action. We found that O3 induced the expression of genes related to a pro-inflammatory response whereas NO2 induced a greater response in genes associated with oxidative stress. In addition, the results from this study support the literature of the pro-inflammatory effects of O3 and add to the literature on the pro-inflammatory and oxidative stress effects of NO2. We have also highlighted that gene expression changes may vary kinetically between O3 and NO2, which has not previously been investigated in studies comparing O3 and NO2 toxicity. With both O3 and NO2 being ubiquitous air pollutants, it is important to study how these toxicants elicit adverse health effects in humans. Now that differences in gene expression changes have been found between these pollutants, future work will compare and contrast the mechanisms responsible for these differences.
Figure 4. mRNA expression of PTGS2 following 2 hr long exposures of HBECs to various concentrations of O3 and NO2 at A) 1 hr post exposure and b) 4 hrs post exposure.
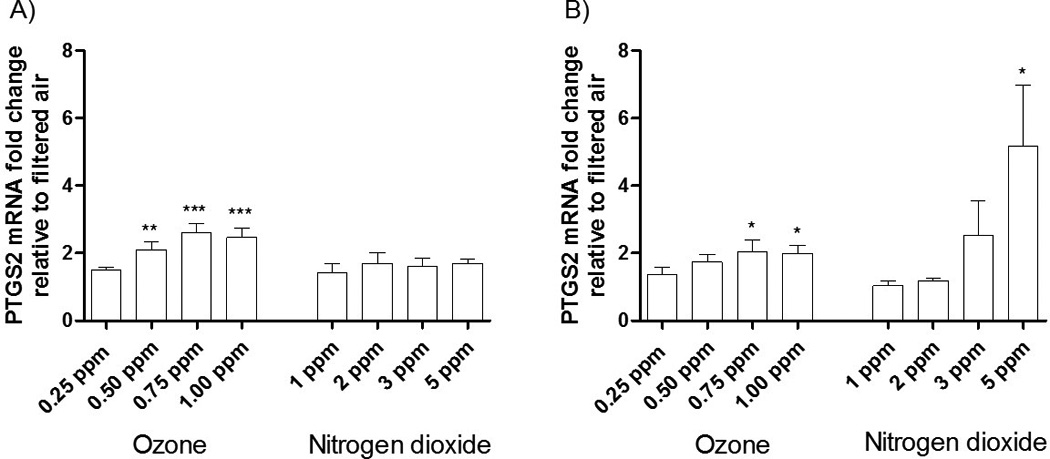
The data is expressed as the mRNA fold change relative to a filtered air control. Data were analyzed using 1-factor ANOVA for dose, followed by Tukey’s Multiple Comparison Post Test. p-values were calculated between treatments and the filtered air control. * p-value < 0.05, ** p-value < 0.01, *** p-value < 0.001. N = 5 donors.
Acknowledgments
The authors thank Dr. Shaun D. McCullough and Mr. David S. Morgan for technical assistance; TRC Environmental Corporation for engineering support; Dr. Andy Ghio, Dr. Martha Sue Carraway, Maryann Bassett, R.N., Tracey Montilla, R.N., and Julie Wood, R.N for clinical support.
This work was supported by United States Environmental Protection Agency intramural funding, the EPA Cooperative Agreement with the Center for Environmental Medicine, Asthma, and Lung Biology at the University of North Carolina [CR83346301], and a National Institutes of Environmental Health Sciences T32 grant [T32ES007126]. The research described in this article has been reviewed by the National Health and Environmental Effects Research Laboratory, U.S. Environmental Protection Agency, and approved for publication. Approval does not signify that the contents necessarily reflect the views and policies of the Agency, nor does the mention of trade names of commercial products constitute endorsement or recommendation for use.
Footnotes
Declaration of interest
The authors report no declaration of interest.
References
- Ayyagari VN, Januszkiewicz A, Nath J. Pro-inflammatory responses of human bronchial epithelial cells to acute nitrogen dioxide exposure. Toxicology. 2004;197:149–164. doi: 10.1016/j.tox.2003.12.017. [DOI] [PubMed] [Google Scholar]
- Ayyagari VN, Januszkiewicz A, Nath J. Effects of nitrogen dioxide on the expression of intercellular adhesion molecule-1, neutrophil adhesion, and cytotoxicity: studies in human bronchial epithelial cells. Inhal Toxicol. 2007;19:181–194. doi: 10.1080/08958370601052121. [DOI] [PubMed] [Google Scholar]
- Azari MR, Esmaeilzadeh M, Mehrabi Y, Salehpour S. Monitoring of occupational exposure of mild steel welders to ozone and nitrogen oxides. Tanaffos. 2011;10:54–59. [PMC free article] [PubMed] [Google Scholar]
- Ballinger CA, Cueto R, Squadrito G, Coffin JF, Velsor LW, Pryor WA, Postlethwait EM. Antioxidant-mediated augmentation of ozone-induced membrane oxidation. Free Radic Biol Med. 2005;38:515–526. doi: 10.1016/j.freeradbiomed.2004.11.009. [DOI] [PubMed] [Google Scholar]
- Bauer RN, Muller L, Brighton LE, Duncan KE, Jaspers I. Interaction with epithelial cells modifies airway macrophage response to ozone. Am J Respir Cell Mol Biol. 2015;52:285–294. doi: 10.1165/rcmb.2014-0035OC. [DOI] [PMC free article] [PubMed] [Google Scholar]
- Bayram H, Sapsford RJ, Abdelaziz MM, Khair OA. Effect of ozone and nitrogen dioxide on the release of proinflammatory mediators from bronchial epithelial cells of nonatopic nonasthmatic subjects and atopic asthmatic patients in vitro. J Allergy Clin Immunol. 2001;107:287–294. doi: 10.1067/mai.2001.111141. [DOI] [PubMed] [Google Scholar]
- Blomberg A, Krishna MT, Bocchino V, Biscione GL, Shute JK, Kelly FJ, Frew AJ, Holgate ST, Sandstrom T. The inflammatory effects of 2 ppm NO2 on the airways of healthy subjects. Am J Respir Crit Care Med. 1997;156:418–424. doi: 10.1164/ajrccm.156.2.9612042. [DOI] [PubMed] [Google Scholar]
- Carbone U, Montuori P, Novi C, Triassi M. Respiratory function in power plant workers exposed to nitrogen dioxide. Occup Med (Lond) 2014 doi: 10.1093/occmed/kqu129. [DOI] [PubMed] [Google Scholar]
- Connor LM, Ballinger CA, Albrecht TB, Postlethwait EM. Interfacial phospholipids inhibit ozone-reactive absorption-mediated cytotoxicity in vitro. Am J Physiol Lung Cell Mol Physiol. 2004;286:L1169–L1178. doi: 10.1152/ajplung.00397.2003. [DOI] [PubMed] [Google Scholar]
- Devalia JL, Campbell AM, Sapsford RJ, Rusznak C, Quint D, Godard P, Bousquet J, Davies RJ. Effect of nitrogen dioxide on synthesis of inflammatory cytokines expressed by human bronchial epithelial cells in vitro. Am J Respir Cell Mol Biol. 1993;9:271–278. doi: 10.1165/ajrcmb/9.3.271. [DOI] [PubMed] [Google Scholar]
- Devlin RB, Duncan KE, Jardim M, Schmitt MT, Rappold AG, Diaz-Sanchez D. Controlled exposure of healthy young volunteers to ozone causes cardiovascular effects. Circulation. 2012;126:104–111. doi: 10.1161/CIRCULATIONAHA.112.094359. [DOI] [PubMed] [Google Scholar]
- Devlin RB, Horstman DP, Gerrity TR, Becker S, Madden MC, Biscardi F, Hatch GE, Koren HS. Inflammatory response in humans exposed to 2.0 ppm nitrogen dioxide. Inhal Toxicol. 1999;11:89–109. doi: 10.1080/089583799197195. [DOI] [PubMed] [Google Scholar]
- Devlin RB, Mcdonnell WF, Becker S, Madden MC, Mcgee MP, Perez R, Hatch G, House DE, Koren HS. Time-dependent changes of inflammatory mediators in the lungs of humans exposed to 0.4 ppm ozone for 2 hr: a comparison of mediators found in bronchoalveolar lavage fluid 1 and 18 hr after exposure. Toxicol Appl Pharmacol. 1996;138:176–185. doi: 10.1006/taap.1996.0111. [DOI] [PubMed] [Google Scholar]
- Devlin RB, Mcdonnell WF, Mann R, Becker S, House DE, Schreinemachers D, Koren HS. Exposure of humans to ambient levels of ozone for 6.6 hours causes cellular and biochemical changes in the lung. Am J Respir Cell Mol Biol. 1991;4:72–81. doi: 10.1165/ajrcmb/4.1.72. [DOI] [PubMed] [Google Scholar]
- Devlin RB, Mckinnon KP, Noah T, Becker S, Koren HS. Ozone-induced release of cytokines and fibronectin by alveolar macrophages and airway epithelial cells. Am J Physiol. 1994;266:L612–L619. doi: 10.1152/ajplung.1994.266.6.L612. [DOI] [PubMed] [Google Scholar]
- Gauderman WJ, Gilliland GF, Vora H, Avol E, Stram D, Mcconnell R, Thomas D, Lurmann F, Margolis HG, Rappaport EB, Berhane K, Peters JM. Association between air pollution and lung function growth in southern California children: results from a second cohort. Am J Respir Crit Care Med. 2002;166:76–84. doi: 10.1164/rccm.2111021. [DOI] [PubMed] [Google Scholar]
- Hatch GE, Duncan KE, Diaz-Sanchez D, Schmitt MT, Ghio AJ, Carraway MS, Mckee J, Dailey LA, Berntsen J, Devlin RB. Progress in assessing air pollutant risks from in vitro exposures: matching ozone dose and effect in human airway cells. Toxicol Sci. 2014;141:198–205. doi: 10.1093/toxsci/kfu115. [DOI] [PMC free article] [PubMed] [Google Scholar]
- Horstman DH, Folinsbee LJ, Ives PJ, Abdul-Salaam S, Mcdonnell WF. Ozone concentration and pulmonary response relationships for 6.6-hour exposures with five hours of moderate exercise to 0.08, 0.10, and 0.12 ppm. Am Rev Respir Dis. 1990;142:1158–1163. doi: 10.1164/ajrccm/142.5.1158. [DOI] [PubMed] [Google Scholar]
- Jerrett M, Burnett RT, Pope CA, Ii, Ito K, Thurston G, Krewski D, Shi Y, Calle E, Thun M. Long-Term Ozone Exposure and Mortality. New England Journal of Medicine. 2009;360:1085–1095. doi: 10.1056/NEJMoa0803894. [DOI] [PMC free article] [PubMed] [Google Scholar]
- Johnston CJ, Oberdorster G, Finkelstein JN. Recovery from oxidant-mediated lung injury: response of metallothionein, MIP-2, and MCP-1 to nitrogen dioxide, oxygen, and ozone exposures. Inhal Toxicol. 2001;13:689–702. doi: 10.1080/08958370126867. [DOI] [PubMed] [Google Scholar]
- Johnston CJ, Reed CK, Avissar NE, Gelein R, Finkelstein JN. Antioxidant and inflammatory response after acute nitrogen dioxide and ozone exposures in C57Bl/6 mice. Inhal Toxicol. 2000;12:187–203. doi: 10.1080/089583700196239. [DOI] [PubMed] [Google Scholar]
- Kleeberger SR, Zhang LY, Jakab GJ. Differential susceptibility to oxidant exposure in inbred strains of mice: Nitrogen dioxide versus ozone. Inhalation Toxicology. 1997;9:601–621. [Google Scholar]
- Koren HS, Devlin RB, Becker S, Perez R, Mcdonnell WF. Time-dependent changes of markers associated with inflammation in the lungs of humans exposed to ambient levels of ozone. Toxicol Pathol. 1991;19:406–411. doi: 10.1177/0192623391019004-109. [DOI] [PubMed] [Google Scholar]
- Krishna MT, Madden J, Teran LM, Biscione GL, Lau LC, Withers NJ, Sandstrom T, Mudway I, Kelly FJ, Walls A, Frew AJ, Holgate ST. Effects of 0.2 ppm ozone on biomarkers of inflammation in bronchoalveolar lavage fluid and bronchial mucosa of healthy subjects. Eur Respir J. 1998;11:1294–1300. doi: 10.1183/09031936.98.11061294. [DOI] [PubMed] [Google Scholar]
- Lee K, Yanagisawa Y, Spengler JD, Nakai S. Carbon monoxide and nitrogen dioxide exposures in indoor ice skating rinks. J Sports Sci. 1994;12:279–283. doi: 10.1080/02640419408732173. [DOI] [PubMed] [Google Scholar]
- Li Z, Tighe RM, Feng F, Ledford JG, Hollingsworth JW. Genes of innate immunity and the biological response to inhaled ozone. J Biochem Mol Toxicol. 2013;27:3–16. doi: 10.1002/jbt.21453. [DOI] [PMC free article] [PubMed] [Google Scholar]
- Livak KJ, Schmittgen TD. Analysis of relative gene expression data using real-time quantitative PCR and the 2(−Delta Delta C(T)) Method. Methods. 2001;25:402–408. doi: 10.1006/meth.2001.1262. [DOI] [PubMed] [Google Scholar]
- Mcconnell R, Berhane K, Gilliland F, London SJ, Islam T, Gauderman WJ, Avol E, Margolis HG, Peters JM. Asthma in exercising children exposed to ozone: a cohort study. Lancet. 2002;359:386–391. doi: 10.1016/S0140-6736(02)07597-9. [DOI] [PubMed] [Google Scholar]
- Mccullough SD, Duncan KE, Swanton SM, Dailey LA, Diaz-Sanchez D, Devlin RB. Ozone induces a proinflammatory response in primary human bronchial epithelial cells through mitogen-activated protein kinase activation without nuclear factor-kappaB activation. Am J Respir Cell Mol Biol. 2014;51:426–435. doi: 10.1165/rcmb.2013-0515OC. [DOI] [PubMed] [Google Scholar]
- Mcdonnell WF, Abbey DE, Nishino N, Lebowitz MD. Long-term ambient ozone concentration and the incidence of asthma in nonsmoking adults: the AHSMOG Study. Environ Res. 1999;80:110–121. doi: 10.1006/enrs.1998.3894. [DOI] [PubMed] [Google Scholar]
- Mcdonnell WF, Kehrl HR, Abdul-Salaam S, Ives PJ, Folinsbee LJ, Devlin RB, O'neil JJ, Horstman DH. Respiratory response of humans exposed to low levels of ozone for 6.6 hours. Arch Environ Health. 1991;46:145–150. doi: 10.1080/00039896.1991.9937441. [DOI] [PubMed] [Google Scholar]
- Mckinnon KP, Madden MC, Noah TL, Devlin RB. In vitro ozone exposure increases release of arachidonic acid products from a human bronchial epithelial cell line. Toxicol Appl Pharmacol. 1993;118:215–223. doi: 10.1006/taap.1993.1027. [DOI] [PubMed] [Google Scholar]
- Park JW, Taube C, Swasey C, Kodama T, Joetham A, Balhorn A, Takeda K, Miyahara N, Allen CB, Dakhama A, Kim SH, Dinarello CA, Gelfand EW. Interleukin-1 receptor antagonist attenuates airway hyperresponsiveness following exposure to ozone. Am J Respir Cell Mol Biol. 2004;30:830–836. doi: 10.1165/rcmb.2003-0373OC. [DOI] [PubMed] [Google Scholar]
- Pavelchak N, Church L, Roerig S, London M, Welles W, Casey G. Silo gas exposure in New York state following the dry growing season of 1995. Appl Occup Environ Hyg. 1999;14:34–38. doi: 10.1080/104732299303395. [DOI] [PubMed] [Google Scholar]
- Pelham TW, Holt LE, Moss MA. Exposure to carbon monoxide and nitrogen dioxide in enclosed ice arenas. Occup Environ Med. 2002;59:224–233. doi: 10.1136/oem.59.4.224. [DOI] [PMC free article] [PubMed] [Google Scholar]
- Persinger RL, Poynter ME, Ckless K, Janssen-Heininger YM. Molecular mechanisms of nitrogen dioxide induced epithelial injury in the lung. Mol Cell Biochem. 2002;234–235:71–80. [PubMed] [Google Scholar]
- Peters JM, Avol E, Gauderman WJ, Linn WS, Navidi W, London SJ, Margolis H, Rappaport E, Vora H, Gong H, Jr, Thomas DC. A study of twelve Southern California communities with differing levels and types of air pollution. II. Effects on pulmonary function. Am J Respir Crit Care Med. 1999;159:768–775. doi: 10.1164/ajrccm.159.3.9804144. [DOI] [PubMed] [Google Scholar]
- Postlethwait EM, Bidani A. Mechanisms of pulmonary NO2 absorption. Toxicology. 1994;89:217–237. doi: 10.1016/0300-483x(94)90099-x. [DOI] [PubMed] [Google Scholar]
- Rietjens IM, Poelen MC, Hempenius RA, Gijbels MJ, Alink GM. Toxicity of ozone and nitrogen dioxide to alveolar macrophages: comparative study revealing differences in their mechanism of toxic action. J Toxicol Environ Health. 1986;19:555–568. doi: 10.1080/15287398609530952. [DOI] [PubMed] [Google Scholar]
- Ross AJ, Dailey LA, Brighton LE, Devlin RB. Transcriptional profiling of mucociliary differentiation in human airway epithelial cells. Am J Respir Cell Mol Biol. 2007;37:169–185. doi: 10.1165/rcmb.2006-0466OC. [DOI] [PubMed] [Google Scholar]
- Rusznak C, Devalia JL, Sapsford RJ, Davies RJ. Ozone-induced mediator release from human bronchial epithelial cells in vitro and the influence of nedocromil sodium. Eur Respir J. 1996;9:2298–2305. doi: 10.1183/09031936.96.09112298. [DOI] [PubMed] [Google Scholar]
- Ryter SW, Alam J, Choi AM. Heme oxygenase-1/carbon monoxide: from basic science to therapeutic applications. Physiol Rev. 2006;86:583–650. doi: 10.1152/physrev.00011.2005. [DOI] [PubMed] [Google Scholar]
- Sandstrom T. Respiratory effects of air pollutants: experimental studies in humans. Eur Respir J. 1995;8:976–995. [PubMed] [Google Scholar]
- Sunil VR, Patel-Vayas K, Shen J, Laskin JD, Laskin DL. Classical and alternative macrophage activation in the lung following ozone-induced oxidative stress. Toxicol Appl Pharmacol. 2012;263:195–202. doi: 10.1016/j.taap.2012.06.009. [DOI] [PMC free article] [PubMed] [Google Scholar]
- Sunil VR, Vayas KN, Massa CB, Gow AJ, Laskin JD, Laskin DL. Ozone-induced injury and oxidative stress in bronchiolar epithelium are associated with altered pulmonary mechanics. Toxicol Sci. 2013;133:309–319. doi: 10.1093/toxsci/kft071. [DOI] [PMC free article] [PubMed] [Google Scholar]
- Takahashi Y, Takahashi S, Yoshimi T, Miura T, Mochitate K, Kobayashi T. Increases in the mRNA levels of gamma-glutamyltransferase and heme oxygenase-1 in the rat lung after ozone exposure. Biochem Pharmacol. 1997;53:1061–1064. doi: 10.1016/s0006-2952(97)00104-4. [DOI] [PubMed] [Google Scholar]
- Tighe RM, Li Z, Potts EN, Frush S, Liu N, Gunn MD, Foster WM, Noble PW, Hollingsworth JW. Ozone inhalation promotes CX3CR1-dependent maturation of resident lung macrophages that limit oxidative stress and inflammation. J Immunol. 2011;187:4800–4808. doi: 10.4049/jimmunol.1101312. [DOI] [PMC free article] [PubMed] [Google Scholar] [Research Misconduct Found]
- Vagaggini B, Paggiaro PL, Giannini D, Franco AD, Cianchetti S, Carnevali S, Taccola M, Bacci E, Bancalari L, Dente FL, Giuntini C. Effect of short-term NO2 exposure on induced sputum in normal, asthmatic and COPD subjects. Eur Respir J. 1996;9:1852–1857. doi: 10.1183/09031936.96.09091852. [DOI] [PubMed] [Google Scholar]
- Who. Air quality guidelines: Global update [Online] [Accessed on Feb 10, 2015];2005 Available at: http://www.euro.who.int/__data/assets/pdf_file/0005/78638/E90038.pdf. [Google Scholar]
- Wiegman CH, Li F, Clarke CJ, Jazrawi E, Kirkham P, Barnes PJ, Adcock IM, Chung KF. A comprehensive analysis of oxidative stress in the ozone-induced lung inflammation mouse model. Clin Sci (Lond) 2014;126:425–440. doi: 10.1042/CS20130039. [DOI] [PubMed] [Google Scholar]