

Abstract
The c‐Myc proto‐oncogene is activated in more than half of all human cancers. However, the precise regulation of c‐Myc protein stability is unknown. Here, we show that the lncRNA‐MIF (c‐Myc inhibitory factor), a c‐Myc‐induced long non‐coding RNA, is a competing endogenous RNA for miR‐586 and attenuates the inhibitory effect of miR‐586 on Fbxw7, an E3 ligase for c‐Myc, leading to increased Fbxw7 expression and subsequent c‐Myc degradation. Our data reveal the existence of a feedback loop between c‐Myc and lncRNA‐MIF, through which c‐Myc protein stability is finely controlled. Additionally, we show that the lncRNA‐MIF inhibits aerobic glycolysis and tumorigenesis by suppressing c‐Myc and miR‐586.
Keywords: c‐Myc, Fbxw7, glycolysis, lncRNA, microRNA
Subject Categories: Cancer, RNA Biology
Introduction
The c‐Myc gene was originally discovered as the cellular homolog of the retroviral v‐Myc oncogene 1, 2. The c‐Myc proto‐oncogene was later revealed to be activated in over half of human cancers 3. Many mechanisms are involved in c‐Myc activation during tumorigenesis, including chromosomal rearrangement 4, 5, gene amplification 6, and point mutations in the coding sequence 7, 8. The potent transforming activity of c‐Myc to promote tumorigenesis has been well documented by extensive studies using both in vitro cell culture and in vivo mouse models 9.
As a master transcriptional factor, c‐Myc has been previously reported to bind to approximately 10–15% of genes in the genome. Recent studies also suggest that c‐Myc may function as a global amplifier of already active promoters 10, 11, 12. By modulating expression of a variety of protein‐coding genes, c‐Myc has been shown to regulate various cellular processes impacting on cell growth, differentiation, and metabolism 13, 14. However, protein‐coding genes only account for < 2% of the human genome, and the majority of transcripts are non‐coding RNAs 15, 16. Among them are long non‐coding RNAs (lncRNAs), which are defined as transcripts longer than 200 nucleotides lacking significant protein‐coding capacity. Thus far, more than 10,000 lncRNAs have been identified in the human genome 15. The lncRNAs are emerging as an important regulator of biological process and have diverse functions including their involvement in the regulation of gene expression at different levels, such as chromatin remodeling, transcription, and post‐transcriptional processing 17, 18. Of note, lncRNA has recently been shown to function as microRNA (miRNA) sponge or competing endogenous RNA (ceRNA) to regulate gene expression 19, 20. Dysregulation of lncRNAs has also been implicated in a variety of human diseases including cancer 21, 22. Despite these advances, most lncRNAs remain functionally uncharacterized. Particularly, it remains largely unknown how lncRNAs are involved in the regulation of c‐Myc function.
Considering c‐Myc has strong growth‐promoting ability, so a small change in c‐Myc levels may have a global impact on the cell. It is therefore not surprising that levels of c‐Myc are under extraordinarily tight regulation in normal cells. c‐Myc is an immediate‐early gene, and its transcription is controlled at the level of initiation in response to a range of growth stimuli 23, 24. In addition, c‐Myc mRNA is highly unstable, with a half‐life of ~30 min. The export and translation of c‐Myc mRNA are also highly controlled 25, 26. Furthermore, c‐Myc is a labile protein, and its protein stability is regulated by multiple E3 ubiquitin ligases 27, among which SCF (Skp–Cullin–F‐box)‐Fbxw7 (F‐box and WD repeat domain‐containing 7) is the best‐characterized E3 ubiquitin ligase for c‐Myc. The SCF‐Fbxw7‐mediated degradation of c‐Myc involves the recognition of phosphorylated c‐Myc on threonine 58 (T58) and serine 62 (S62) by Fbxw7 28, 29. It has been widely accepted that the c‐Myc oncogene becomes dysregulated when those control mechanisms are compromised.
The tightly controlled expression of c‐Myc is essential for many cellular processes. Deficiency in c‐Myc is embryonic lethal in animal models, whereas the increased expression of c‐Myc is oncogenic. It is interesting to note that c‐Myc haploinsufficient (Myc+/−) mice are metabolically healthier and surviving longer than wild‐type mice 30. It is unclear whether this also holds true for human beings. In normal human cells, c‐Myc is kept at a relatively low level, whereas c‐Myc exhibits high‐level expression in cancer cells. How this is achieved in their respective cells has not yet been fully addressed.
In this study, we demonstrate that lncRNA‐MIF (Myc inhibitory factor), which is transcribed by c‐Myc, is able to reduce c‐Myc expression. Mechanistically, lncRNA‐MIF competes with coding mRNA Fbxw7 for miR‐586 and relieves the inhibitory effect of miR‐586 on Fbxw7, thereby leading to increased Fbxw7 expression and decreased c‐Myc level. Our data indicate the existence of a feedback loop between c‐Myc and lncRNA‐MIF, through which c‐Myc protein stability is delicately controlled. Our study also suggests that lncRNA‐MIF exerts its tumor‐suppressive function by regulating c‐Myc‐mediated glycolysis and tumorigenesis.
Results
LncRNA‐MIF reduces c‐Myc protein stability
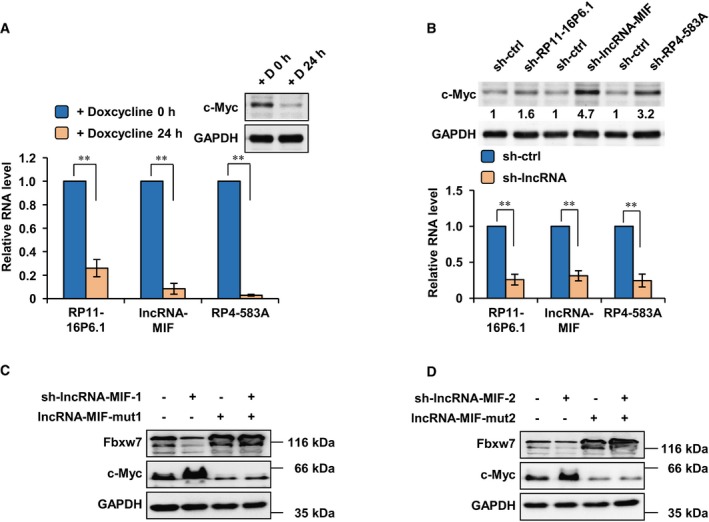
To identify novel long non‐coding RNAs involved in the regulation of c‐Myc function, we first analyzed lncRNA expression profile of P493‐6 cells carrying a c‐Myc tet‐off system. By performing long non‐coding RNA microarray analysis (Dataset EV1), we found that levels of three lncRNAs in P493‐6 cells were decreased when c‐Myc expression was suppressed by doxycycline addition (Fig EV1A). Among these c‐Myc responsive lncRNAs, RP11‐320M2.1 (ENST00000547349) particularly attracted our attention because knockdown of this lncRNA showed the most pronounced elevation of c‐Myc in HeLa, H1299 and A549 cells (Figs 1A and EV1B). We named this lncRNA as c‐Myc‐inhibitory factor (lncRNA‐MIF). To avoid off‐target effect, three different lncRNA‐MIF shRNA‐1, ‐2, and ‐3 were used to knock down lncRNA‐MIF, and each shRNA was shown to result in marked decrease in lncRNA‐MIF and elevated c‐Myc protein level (Fig 5D, lanes 2, 3, and 4, second panel from the top). Furthermore, knockdown effect on upregulation of c‐Myc by lncRNA‐MIF shRNA‐1 and ‐2 can be rescued by overexpressed shRNA‐1 and ‐2 resistant lncRNA‐MIF (Fig EV1C and D). These results demonstrated that lncRNA‐MIF shRNA‐1 and ‐2 will not be off‐targeting. LncRNA‐MIF shRNA‐1 showed the strongest suppression of lncRNA‐MIF and therefore was used throughout this study. LncRNA‐MIF was expressed from a locus between ODC1 and NOL10, and was predicted to have three exons by UCSC (University of California, Santa Cruz) Genome Browser (Fig 1B). LncRNA‐MIF was readily detectable by Northern blotting in HeLa and HCT116 cells, and was approximately 800 bp in length that was the same as predicted by UCSC (Fig 1C). When lncRNA‐MIF was introduced into HeLa cells, c‐Myc levels were greatly reduced (Fig 1D). However, overexpression of lncRNA‐MIF‐AS (antisense) in HeLa cells showed no effect on c‐Myc (Fig 5A, lanes 2 and 3, second panel from the top). These data indicate that lncRNA‐MIF is fully functional for its inhibitory effect on c‐Myc expression.
Figure EV1. Knockdown of lncRNA‐MIF by shRNA leads to increased expression of c‐Myc.
-
AP493‐6 cells were treated with doxycycline for 0 and 24 h. Total RNA was analyzed by real‐time RT–PCR to examine the levels of RP11‐16P6.1, lncRNA‐MIF, and RP4‐583A. Data shown are mean ± SD (n = 3; **P < 0.01, two‐tailed t‐test). Cell lysates were also analyzed by Western blotting using anti‐c‐Myc and anti‐GAPDH antibodies.
-
BHeLa cells were individually infected with lentiviruses expressing either control shRNA, RP11‐16P6.1 shRNA, lncRNA‐MIF shRNA, or RP4‐583A shRNA. Forty‐eight hours after infection, cell lysates were analyzed by Western blotting using anti‐c‐Myc and anti‐GAPDH antibodies. Total RNA was analyzed by real‐time RT–PCR. Data shown are mean ± SD (n = 3; **P < 0.01, two‐tailed t‐test).
-
C, DHeLa cells were infected with lentiviruses as indicated. Forty‐eight hours after infection, cell lysates were analyzed by Western blot analysis using anti‐Fbxw7, anti‐c‐Myc, and anti‐GAPDH antibodies.
Figure 1. LncRNA‐MIF inhibits c‐Myc expression.
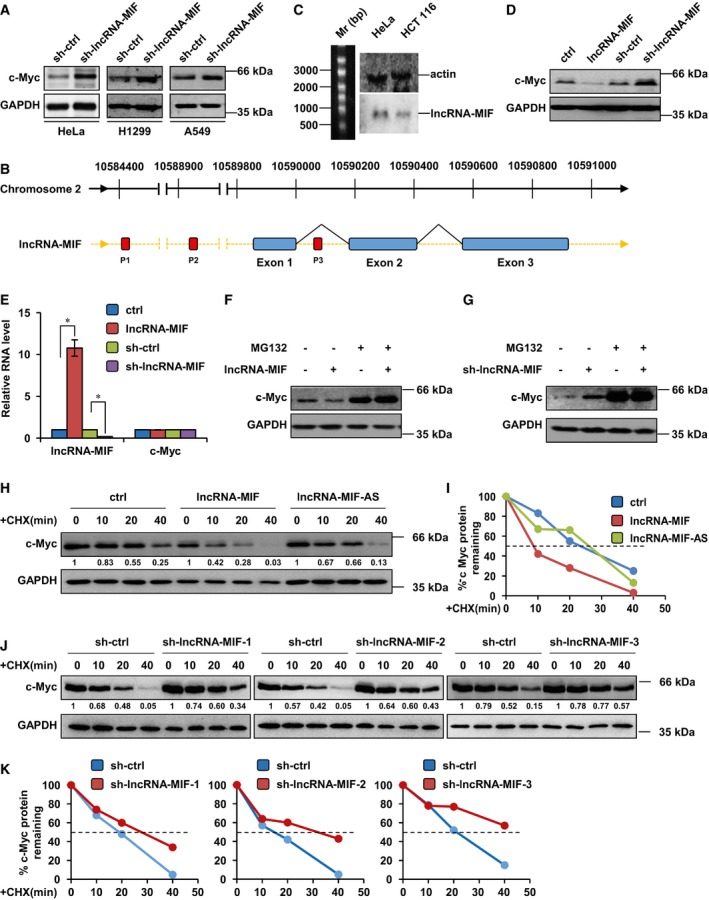
- HeLa, H1299, and A549 cells were infected with lentiviruses expressing control shRNA or lncRNA‐MIF shRNA. Forty‐eight hours after infection, cell lysates were subjected to Western blot analysis with anti‐c‐Myc antibody.
- Schematic illustration of lncRNA‐MIF genomic localization and three putative c‐Myc binding sites.
- Total RNA from the indicated cell lines was subjected to Northern blot analysis to determine the molecular size of lncRNA‐MIF. Actin was also included as a positive control.
- HeLa cells were infected with lentiviruses expressing control RNA, lncRNA‐MIF, control shRNA, or lncRNA‐MIF shRNA as indicated. Forty‐eight hours after infection, cell lysates were analyzed by Western blotting with anti‐c‐Myc and anti‐GAPDH antibodies.
- HeLa cells were infected with lentiviruses expressing control RNA, lncRNA‐MIF, control shRNA, or lncRNA‐MIF shRNA as indicated. Forty‐eight hours after infection, total RNA was extracted from these cells and subjected to real‐time RT–PCR analysis. Data shown are mean ± SD (n = 3; *P < 0.05, two‐tailed t‐test).
- HeLa cells expressing either control RNA or lncRNA‐MIF were treated with or without MG132 (20 μM) for 6 h. Cell lysates were analyzed by Western blot with the indicated antibodies.
- HeLa cells expressing either control shRNA or lncRNA‐MIF shRNA were treated with MG132 for 6 h. Cell lysates were analyzed by Western blotting with the indicated antibodies.
- HeLa cells were infected with lentiviruses expressing control RNA, lncRNA‐MIF, or lncRNA‐MIF‐AS as indicated. Forty‐eight hours after infection, cells were treated with cycloheximide (CHX, 50 μg/ml) for the indicated periods of time. Cell lysates were then analyzed by Western blotting to examine the c‐Myc protein half‐life. Protein band intensity was analyzed by ImageJ.
- Band intensity of c‐Myc in (H) was analyzed by ImageJ.
- HeLa cells were infected with lentiviruses expressing control shRNA, lncRNA‐MIF shRNA‐1, ‐2, or ‐3 as indicated. Forty‐eight hours after infection, cells were treated with CHX for the indicated periods of time. Cell lysates were then analyzed by Western blotting to examine the half‐life of c‐Myc protein.
- Band intensity of c‐Myc in (J) was analyzed by ImageJ.
Figure 5. LncRNA‐MIF decreases c‐Myc and c‐Jun levels by increased expression of Fbxw7.
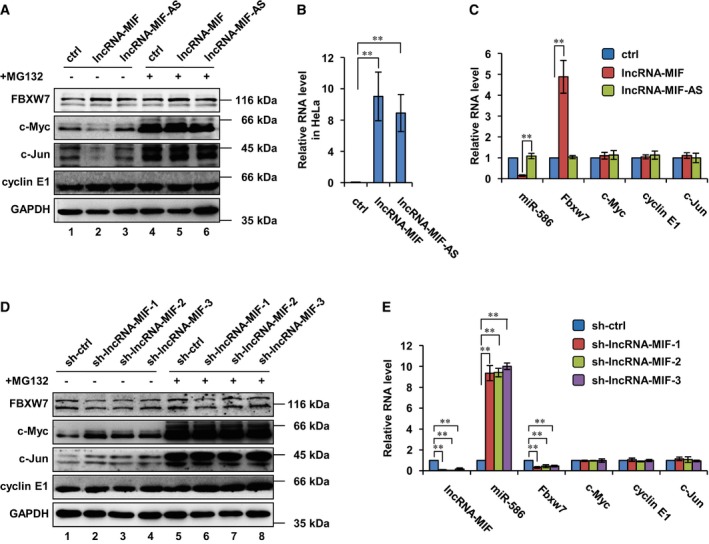
- HeLa cells were infected with lentiviruses expressing control RNA, lncRNA‐MIF, or lncRNA‐MIF‐AS. Forty‐eight hours after infection, cells were treated with MG132 or DMSO (vehicle) for 6 h. Cell lysates were then analyzed by Western blotting with the indicated antibodies.
- HeLa cells were infected with lentiviruses expressing control RNA, lncRNA‐MIF, or lncRNA‐MIF‐AS. Forty‐eight hours after infection, total RNA was subjected to analyzing the levels of lncRNA‐MIF and lncRNA‐MIF‐AS by real‐time RT–PCR. Data shown are mean ± SD (n = 3; **P < 0.01, two‐tailed t‐test).
- HeLa cells were infected with lentiviruses expressing control RNA, lncRNA‐MIF, or lncRNA‐MIF‐AS. Forty‐eight hours after infection, total RNA was subjected to real‐time RT–PCR analysis. Data shown are mean ± SD (n = 3; **P < 0.01, two‐tailed t‐test).
- HeLa cells were infected with lentiviruses expressing control shRNA, lncRNA‐MIF shRNA‐1, ‐2, or ‐3. Forty‐eight hours after infection, cells were treated with MG132 or DMSO for 6 h. Cell lysates were then analyzed by Western blot analysis with the indicated antibodies.
- HeLa cells were infected with lentiviruses expressing control shRNA, lncRNA‐MIF shRNA‐1, ‐2, or ‐3. Forty‐eight hours after infection, total RNA was subjected to real‐time RT–PCR analysis. Data shown are mean ± SD (n = 3; **P < 0.01, two‐tailed t‐test).
We next investigated how lncRNA‐MIF decreased c‐Myc protein levels. c‐Myc mRNA levels were not affected by either overexpression or knockdown of lncRNA‐MIF (Figs 1E and 5C and E), as determined by real‐time RT–PCR analysis. However, the proteasome inhibitor MG132 was able to reverse the inhibitory effect of lncRNA‐MIF on c‐Myc protein level (Fig 1F and G). c‐Myc half‐life was decreased by lncRNA‐MIF induction and increased by lncRNA‐MIF knockdown (Fig 1H–K). These data suggest that lncRNA‐MIF reduces c‐Myc protein stability by promoting its degradation through the proteasome pathway.
LncRNA‐MIF is a direct transcriptional target of c‐Myc
Since lncRNA‐MIF was identified as a c‐Myc upregulated gene by lncRNA microarray as mentioned above, we sought to further validate the effect of c‐Myc on lncRNA‐MIF expression. The real‐time RT–PCR analysis showed that levels of lncRNA‐MIF were greatly decreased when c‐Myc expression was suppressed in P493‐6 cells (Fig 2A). Knockdown of c‐Myc decreased, whereas induction of c‐Myc increased lncRNA‐MIF expression in HeLa, HCT116, and MCF10A cells (Fig 2B and C). Level of c‐Myc protein is subjected to change due to environmental stresses. To examine whether c‐Myc indeed regulates lncRNA‐MIF under physiological conditions, the level of lncRNA‐MIF was determined in glucose‐ or glutamine‐deprived HeLa cells which was known to reduce c‐Myc level 31. As shown in Fig EV2A and B, as the c‐Myc level decreased under glucose or glutamine deprivation, the level of lncRNA‐MIF was markedly decreased. These data suggest that lncRNA‐MIF expression is indeed positively regulated by c‐Myc.
Figure 2. LncRNA‐MIF is a direct transcriptional target of c‐Myc.
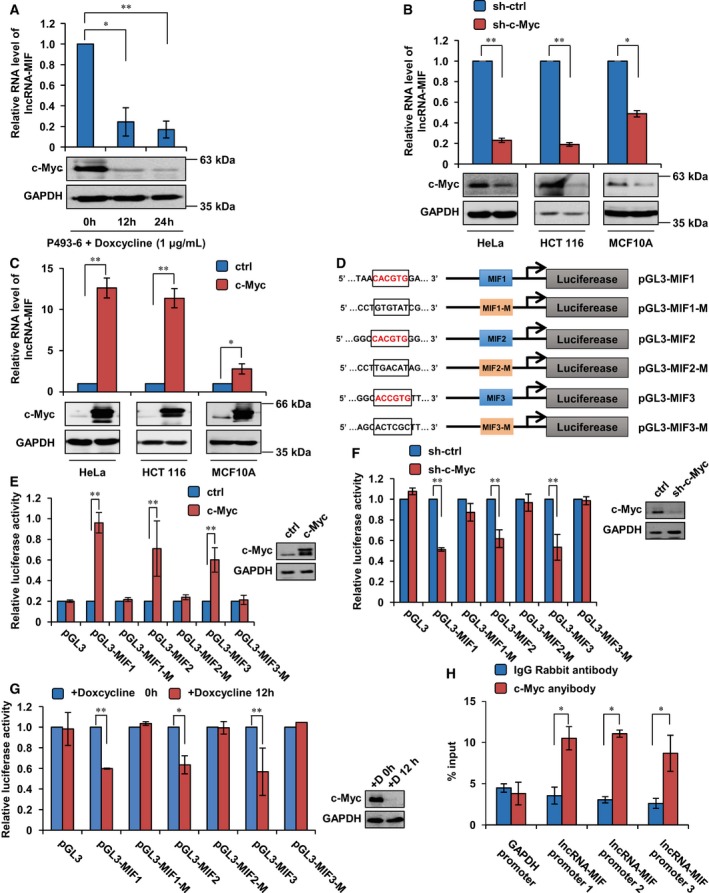
- P493‐6 cells (human B‐cell lymphoma cell line) carrying a c‐Myc tet‐off system were treated with doxycycline (1 μg/ml) for the indicated periods of time. Total RNA was subjected to real‐time RT–PCR analysis. Data shown are mean ± SD (n = 3; *P < 0.05, **P < 0.01, two‐tailed t‐test). Cell lysates were also analyzed by Western blotting with the indicated antibodies.
- HeLa, HCT116, and MCF10A cells were infected with lentiviruses expressing control shRNA or c‐Myc shRNA. Forty‐eight hours after infection, total RNA and cell lysates were analyzed by real‐time RT–PCR and Western blotting, respectively. Data shown are mean ± SD (n = 3; *P < 0.05, **P < 0.01, two‐tailed t‐test).
- HeLa, HCT116, and MCF10A cells were transfected with control vector or Flag‐c‐Myc. Twenty‐four hours after transfection, total RNA was extracted from these cells and subjected to real‐time RT–PCR analysis. Data shown are mean ± SD (n = 3; *P < 0.05, **P < 0.01, two‐tailed t‐test). Cell lysates were also analyzed by Western blotting.
- Schematic illustration of consensus c‐Myc binding sites in lncRNA‐MIF gene promoter. The indicated pGL3‐based luciferase reporter constructs were generated to examine transcriptional activities of three putative c‐Myc binding sites MIF1, MIF2, and MIF3 in response to c‐Myc induction. MIF1‐M, MIF2‐M, and MIF3‐M indicate their corresponding mutant binding sites which are shown in the open boxes.
- HeLa cells were co‐transfected with either Flag‐c‐Myc or control vector plus the indicated reporter constructs and Renilla luciferase plasmid. Twenty‐four hours after transfection, reporter activity was measured and plotted after normalizing with respect to Renilla luciferase activity. Data shown are mean ± SD (n = 3; **P < 0.01, two‐tailed t‐test).
- HeLa cells expressing control shRNA or c‐Myc shRNA were co‐transfected with the indicated reporter constructs and Renilla luciferase plasmid. Twenty‐four hours after transfection, reporter activity was measured and plotted after normalizing with respect to Renilla luciferase activity. Data shown are mean ± SD (n = 3; **P < 0.01, two‐tailed t‐test).
- P493‐6 cells were co‐transfected with the indicated reporter constructs and Renilla luciferase plasmid. Twenty‐four hours after transfection, cells were treated with doxycycline for 0 and 12 h, respectively. Then reporter activity was measured and plotted after normalizing with respect to Renilla luciferase activity. Data shown are mean ± SD (n = 3; *P < 0.05, **P < 0.01, two‐tailed t‐test).
- Lysates from HeLa cells were subjected to ChIP assay. ChIP products were amplified by qPCR with the indicated pairs of primers. Data shown are mean ± SD (n = 3; *P < 0.05, two‐tailed t‐test).
Figure EV2. c‐Myc down‐regulates lncRNA‐MIF under glucose or glutamine deprivation.
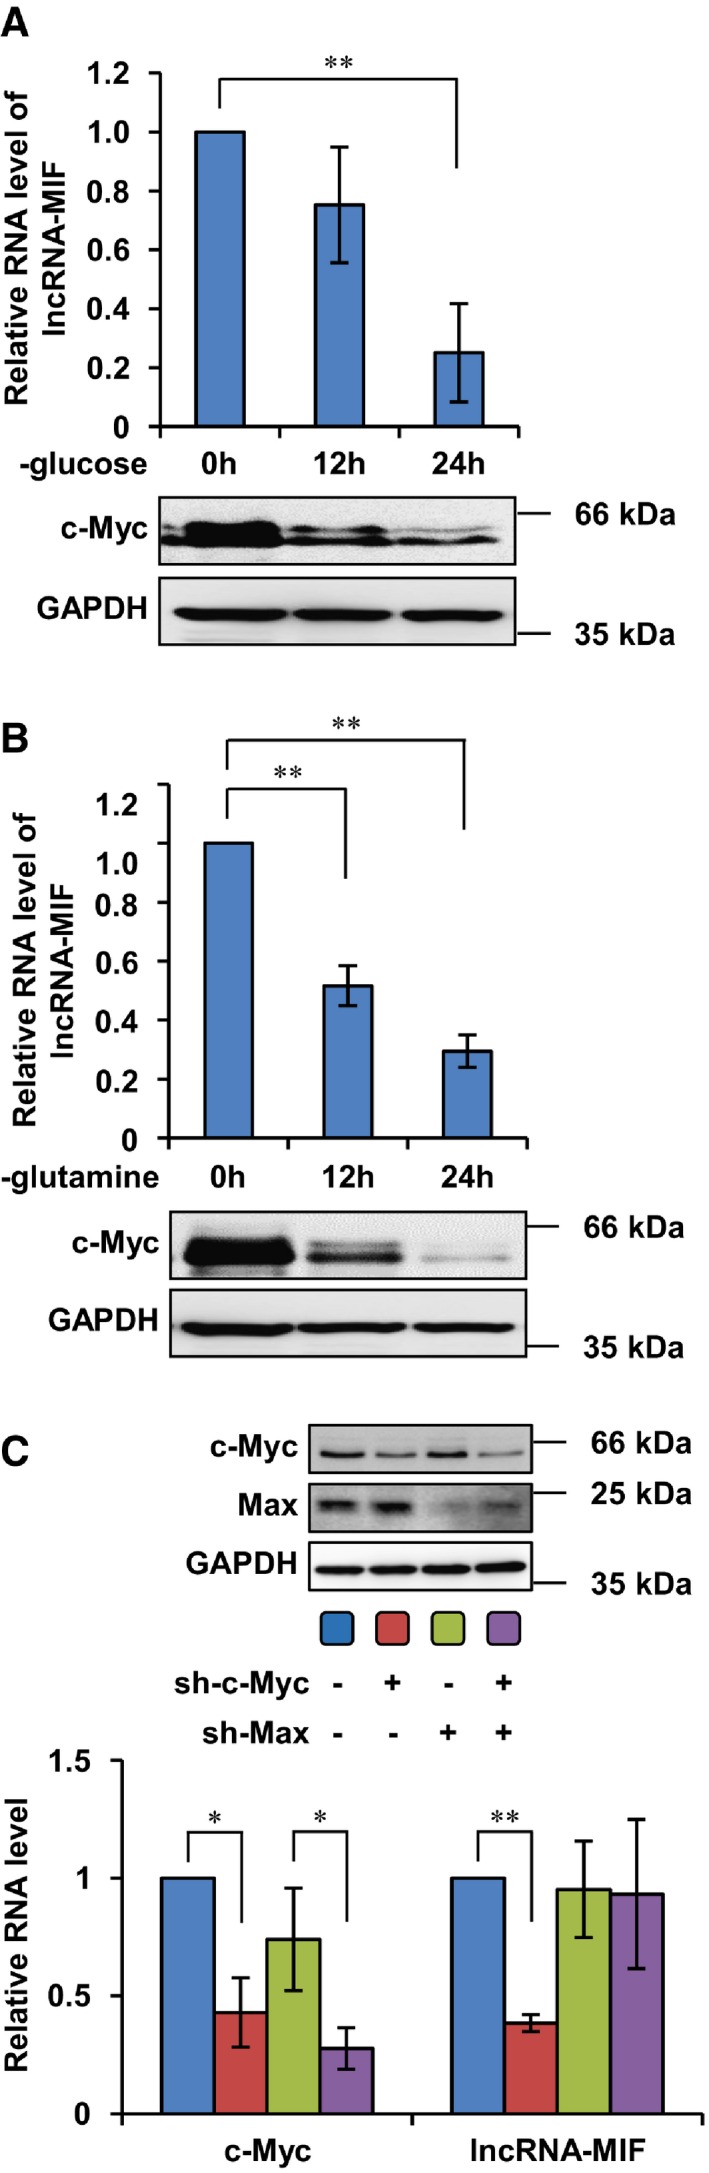
- HeLa cells were treated with glucose deprivation DMEM medium for 0, 12, or 24 h. Cell lysates were analyzed by Western blotting. Total RNA was analyzed by real‐time RT–PCR. Data shown are mean ± SD (n = 3; **P < 0.01, two‐tailed t‐test).
- HeLa cells were treated with glutamine deprivation DMEM medium for 0, 12, or 24 h. Cell lysates were analyzed by Western blotting. Total RNA was analyzed by real‐time RT–PCR. Data shown are mean ± SD (n = 3; **P < 0.01, two‐tailed t‐test).
- HeLa cells expressing control shRNA or c‐Myc shRNA were infected with lentiviruses expressing control shRNA or Max shRNA. Forty‐eight hours after infection, cell lysates were analyzed by Western blotting. Total RNA was analyzed by real‐time RT–PCR. Data shown are mean ± SD (n = 3; *P < 0.05, **P < 0.01, two‐tailed t‐test).
We next explored whether c‐Myc could regulate lncRNA‐MIF at the transcriptional level. We inspected the genomic sequence upstream and intronic regions of the gene coding for lncRNA‐MIF by using Target Scan web server. Three putative c‐Myc binding sites (MIF1, MIF2, and MIF3) were found within the promoter and intronic region of the lncRNA‐MIF gene (Figs 1B and 2D). We therefore evaluated whether these putative c‐Myc binding sites conferred c‐Myc‐dependent transcriptional activity. DNA fragments containing wild‐type or mutant binding sites were inserted into the promoter region of a firefly luciferase reporter plasmid. Luciferase expression from the reporter containing individual MIF1, MIF2, or MIF3 site was indeed induced by ectopic expression of c‐Myc (Fig 2E) and decreased by knockdown of c‐Myc (Fig 2F). Similarly, P493‐6 cells with Myc‐off also result in decreased luciferase expression from three reporter vectors containing MIF1, MIF2, or MIF3 site (Fig 2G). Yet, mutant sites showed no response to c‐Myc induction (Fig 2E–G). The subsequent chromatin immunoprecipitation (CHIP) assays also verified the association of c‐Myc and the chromatin fragments corresponding to the MIF1, MIF2, or MIF3 site (Fig 2H). As a transcription factor, c‐Myc heterodimerizes with its partner protein Max to bind to conserved E‐box to transactive target genes. We showed that depletion of Max diminished the effect of c‐Myc on lncRNA‐MIF transcription (Fig EV2C), implying that c‐Myc transactivates lncRNA‐MIF via conserved E‐box.
LncRNA‐MIF increases Fbxw7 expression by acting as a molecular sponge for miR‐586
It has been recognized that stability of c‐Myc is tightly controlled by Fbxw7‐dependent ubiquitination and subsequent proteasome‐dependent degradation. The above finding that lncRNA‐MIF reduced c‐Myc half‐life (Fig 1H–K) led us to test the possibility that whether lncRNA‐MIF could interact with c‐Myc and/or Fbxw7 and thus to accelerate Fbxw7‐mediated c‐Myc degradation. We performed two types of RNA‐pull‐down experiments. Firstly, we incubated in vitro‐synthesized full‐length biotinylated lncRNA‐MIF (antisense lncRNA‐MIF transcripts were used as negative control) with HeLa cell lysates and isolated coprecipitated proteins by using streptavidin beads. Secondly, we incubated biotinylated antisense DNA probes targeted to lncRNA‐MIF with HeLa cell lysates to pull down endogenous lncRNA‐MIF and its interacting protein (sense DNA probes were used as negative control). The results showed no obvious interaction of lncRNA‐MIF with either Fbxw7 or c‐Myc (Fig 3A; PTBP1 was used as positive control, since PTBP1 was also shown to associate with lncRNA‐MIF in our mass spectrometry analysis). However, we found that knockdown of lncRNA‐MIF decreased, whereas induction of lncRNA‐MIF increased both Fbxw7 mRNA and protein levels (Fig 3B and C). These data indicate that lncRNA‐MIF may decrease c‐Myc half‐life via elevating Fbxw7 expression. We next explored how lncRNA‐MIF regulated Fbxw7 expression. Since there is no direct association between lncRNA‐MIF and Fbxw7, we asked whether lncRNA‐MIF could act as a microRNA sponge to regulate Fbxw7 expression. To test this possibility, we first performed the bioinformatics analysis using TargetScanHuman web server and miR‐586 was predicted to target both lncRNA‐MIF and Fbxw7 (Fig 3D). The RNA target specificities of miRNAs in animals are primarily encoded within a 7‐nt “seed region” mapping to positions 2–8 at the molecule's 5′ end 32. LncRNA‐MIF has five putative 7‐mer complementary sequences for miR‐586, and two of five have 7‐nt perfect match, whereas the remaining three have 1 base variation. Concurrently, the 3′ untranslated region (3′ UTR) of the Fbxw7 gene contains one putative 8‐mer site (nucleotides 636–643) that matches to the miR‐586 seed region. We next determined whether lncRNA‐MIF interacted with miR‐586 and whether miR‐586 targeted Fbxw7 to inhibit its translation. We showed that both biotinylated antisense DNA probe‐enriched endogenous lncRNA‐MIF and in vitro‐synthesized biotinylated lncRNA‐MIF were able to successfully pull down miR‐586 (Fig 3E and F). As a negative control, lncRNA‐MIF failed to pull down miR‐34a (Fig 3F), since does not contain any putative miR‐34a complementary sequence. To further validate the association of lncRNA‐MIF with miR‐586, we constructed a luciferase reporter plasmid containing wild‐type lncRNA‐MIF and a mutant reporter construct in which two putative miR‐586 binding sites within lncRNA‐MIF were mutated (Fig 3G). These reporter constructs were transfected into HeLa cells together with miR‐586 mimics or inhibitors. As was expected, miR‐586 mimics reduced, whereas miR‐586 inhibitors increased the reporter activity of the construct containing wild‐type lncRNA‐MIF (Fig 3H and I). On the contrary, activity of the reporter containing mutant lncRNA‐MIF was not affected by either mimics or inhibitors of miR‐586 (Fig 3H and I). These results strongly suggest the specific interaction of lncRNA‐MIF with miR‐586. To investigate in which cellular compartment the lncRNA‐MIF–miR‐586 interaction occurs, we examined the cellular localization of lncRNA‐MIF and miR‐586. LncRNA‐MIF and miR‐586 reside in both cytoplasm and nucleus (Fig 3J). Antisense DNA probe‐enriched endogenous lncRNA‐MIF can only pull down miR‐586 from cytosolic but not nuclear fraction (Fig 3K). Taken together, these data indicate that lncRNA‐MIF specifically interacts with miR‐586 in cytoplasm.
Figure 3. LncRNA‐MIF is a molecular sponge for miR‐586.
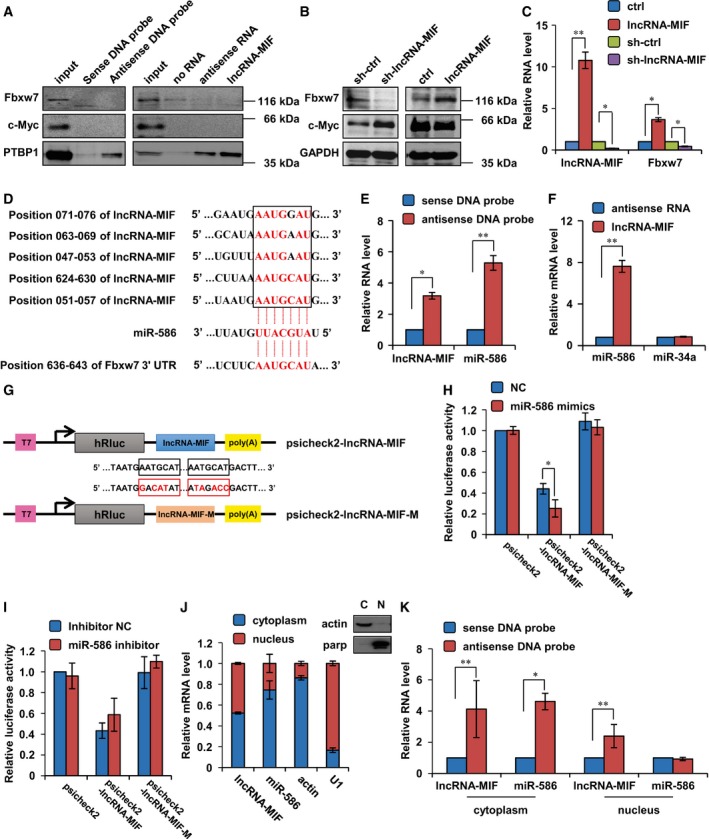
- Left panel: Lysates from HeLa cells were incubated with in vitro‐synthesized biotin‐labeled sense or antisense DNA probes against lncRNA‐MIF for biotin pull‐down assay, followed by Western blot analysis with the indicated antibodies. Right panel: Lysates from HeLa cells were incubated with in vitro‐synthesized biotin‐labeled lncRNA‐MIF or biotin‐labeled antisense RNA for biotin pull‐down assay, followed by Western blot analysis with the indicated antibodies.
- HeLa cells were infected with lentiviruses expressing control RNA, lncRNA‐MIF, control shRNA, or lncRNA‐MIF shRNA as indicated. Forty‐eight hours after infection, cell lysates were analyzed by Western blotting with the indicated antibodies.
- HeLa cells were infected with lentiviruses expressing control RNA, lncRNA‐MIF, control shRNA, or lncRNA‐MIF shRNA as indicated. Forty‐eight hours after infection, total RNA was subjected to real‐time RT–PCR analysis. Data shown are mean ± SD (n = 3; *P < 0.05, **P < 0.01, two‐tailed t‐test).
- Illustration of the base pairing between miR‐586 and lncRNA‐MIF. The base pairing between miR‐586 and Fbxw7 3′ UTR is also shown.
- Lysates from HeLa cells were incubated with in vitro‐synthesized biotin‐labeled sense or antisense DNA probes against lncRNA‐MIF for biotin pull‐down assay, followed by real‐time RT–PCR analysis to examine miR‐586 levels. Data shown are mean ± SD (n = 3; *P < 0.05, **P < 0.01, two‐tailed t‐test).
- Lysates from HeLa cells were incubated with in vitro‐synthesized biotin‐labeled lncRNA‐MIF and antisense RNA for biotin pull‐down assay, followed by real‐time RT–PCR analysis to examine miR‐586 and miR‐34a levels. Data shown are mean ± SD (n = 3; **P < 0.01, two‐tailed t‐test).
- Schematic representation of psicheck2‐based luciferase reporter plasmid containing wild‐type lncRNA‐MIF (psicheck2‐lncRNA‐MIF) and a mutant reporter construct in which two putative miR‐586 binding sites were mutated (psicheck2‐lncRNA‐MIF‐M), and mutated bases are indicated in red.
- miR‐586 or control mimics were transfected into HeLa cells together with the indicated psicheck2‐based luciferase reporter construct. Twenty‐four hours after transfection, reporter activity was measured and plotted after normalizing with respect to Renilla luciferase activity. Data shown are mean ± SD (n = 3; *P < 0.05, two‐tailed t‐test).
- miR‐586 or control inhibitors were transfected into HeLa cells together with the indicated psicheck2‐based luciferase reporter construct. Twenty‐four hours after transfection, reporter activity was measured and plotted after normalizing with respect to Renilla luciferase activity. Data shown are mean ± SD (n = 3).
- HeLa cells were subjected to fractionation into cytoplasmic (C) and nuclear (N) extracts. Total RNA extracted from each fraction was analyzed for the indicated RNA expression by real‐time RT–PCR. Data shown are mean ± SD (n = 3). Actin and PARP were used as markers for cytoplasmic and nuclear fractions, respectively.
- HeLa cells were subjected to cytoplasm or nucleus fractionation before each fraction was incubated with in vitro‐synthesized biotin‐labeled sense or antisense DNA probes of lncRNA‐MIF for biotin pull‐down assay, followed by real‐time RT–PCR analysis to examine miR‐586 levels. Data shown are mean ± SD (n = 3; *P < 0.05, **P < 0.01, two‐tailed t‐test).
To determine whether Fbxw7 is a bona fide target of miR‐586, we introduced miR‐586 mimics into HeLa cells together with luciferase reporter plasmids containing wild‐type or mutant 3′ UTR of Fbxw7 (Fig 4A). The reporter activity was noticeably suppressed by the presence of miR‐586 mimics, however, this activity remained largely unaffected when this 3′ UTR was mutated (Fig 4B). In addition, the Fbxw7 3′ UTR‐luciferase activity was increased by treatment with miR‐586 inhibitors (Fig 4C). These data indicate that 3′ UTR of Fbxw7 is inhibited by miR‐586. To reinforce this conclusion, we performed an endogenous experiment. Treatment by miR‐586 mimics led to a decrease in both protein and mRNA levels of endogenous Fbxw7, whereas miR‐586 inhibitors showed the opposite effect (Fig 4D and E). Taken together, these data suggest that Fbxw7 is post‐transcriptionally inhibited by miR‐586.
Figure 4. LncRNA‐MIF regulates Fbxw7 and c‐Myc expression via miR‐586.
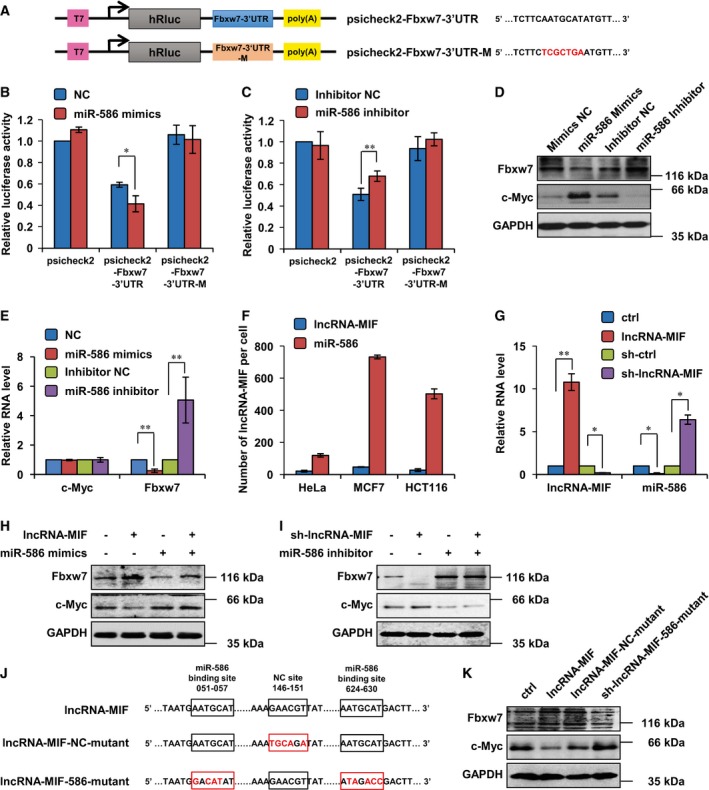
- Schematic illustration of psicheck2‐based luciferase reporter constructs used for examining the effect of miR‐586 on the 3′ UTR of Fbxw7. Mutated bases are in red color in open box.
- miR‐586 mimics or negative control mimics (NC mimics) were transfected into HeLa cells together with the indicated psicheck2‐based luciferase reporter construct. Twenty‐four hours after transfection, reporter activity was measured and plotted after normalizing with respect to Renilla luciferase activity. Data shown are mean ± SD (n = 3; *P < 0.05, two‐tailed t‐test).
- miR‐586 inhibitor or negative control inhibitor (NC inhibitor) was transfected into HeLa cells together with the indicated psicheck2‐based luciferase reporter construct. Twenty‐four hours after transfection, reporter activity was measured and plotted after normalizing with respect to Renilla luciferase activity. Data shown are mean ± SD (n = 3; **P < 0.01, two‐tailed t‐test).
- HeLa cells were transfected with miR‐586 mimics or inhibitors as indicated. Forty‐eight hours after transfection, cell lysates were analyzed by Western blotting.
- HeLa cells were transfected with miR‐586 mimics or inhibitors as indicated. Forty‐eight hours after transfection, total RNA was extracted and subjected to real‐time RT–PCR analysis. Data shown are mean ± SD (n = 3; **P < 0.01, two‐tailed t‐test).
- The copy numbers of miR‐586 and lncRNA‐MIF transcript per cell in the indicated cells were quantified using a quantitative real‐time RT–PCR assay. Data shown are mean ± SD (n = 3).
- HeLa cells were infected with lentiviruses expressing control shRNA or lncRNA‐MIF shRNA. Forty‐eight hours after infection, total RNA was subjected to real‐time RT–PCR analysis. HeLa cells were infected with lentiviruses expressing lncRNA‐MIF or control RNA. Forty‐eight hours after infection, total RNA was analyzed by real‐time RT–PCR. Data shown are mean ± SD (n = 3; *P < 0.05, **P < 0.01, two‐tailed t‐test).
- HeLa cells expressing lncRNA‐MIF or control RNA were transfected with miR‐586 mimics or NC mimics. Twenty‐four hours after transfection, cell lysates were analyzed by Western blotting.
- HeLa cells expressing lncRNA‐MIF or control shRNA were transfected with miR‐586 inhibitor or NC inhibitor. Twenty‐four hours after transfection, cell lysates were analyzed by Western blotting.
- Mutant bases (in red color) in nonsense mutant lncRNA‐MIF (negative control, NC) and in miR‐586 binding‐defective lncRNA‐MIF are shown in boxes.
- HeLa cells were infected with lentiviruses expressing control RNA, lncRNA‐MIF, lncRNA‐MIF harboring nonsense mutation, or miR586 binding‐defective lncRNA‐MIF. Forty‐eight hours after transfection, cell lysates were analyzed by Western blotting.
Given that miR‐586 was able to target both lncRNA‐MIF and Fbxw7, we asked whether lncRNA‐MIF competed with Fbxw7 mRNA for miR‐586 binding. If there indeed exists a competition between lncRNA‐MIF and Fbxw7 mRNA for shared miR‐586, the copy number ratio of lncRNA‐MIF to miR‐586 is then expected to be within a rational range, too high or too low will make the competition become unworkable. We used quantitative real‐time PCR to quantify the copy numbers of lncRNA‐MIF and miR‐586 per cell in HeLa, MCF7, and HCT116 cells. The ratio of miR‐586 copy number to lncRNA‐MIF copy number ranged from 5 to 20 in different types of cells (Fig 4F). Considering lncRNA‐MIF has 5 putative miR‐586 complementary sites, it is reasonable to speculate that lncRNA‐MIF is able to efficiently inhibit miR‐586 function. We also found that overexpression of lncRNA‐MIF reduced, whereas knockdown of lncRNA‐MIF increased levels of miR‐586 (Fig 4G). To further determine whether lncRNA‐MIF regulates Fbxw7 and c‐Myc expression via miR‐586, miR‐586 mimics and inhibitor were utilized. We showed that induction of miR‐586 by its mimics greatly reversed lncRNA‐MIF‐mediated up‐regulation of Fbxw7 and down‐regulation of c‐Myc (Fig 4H). In addition, lncRNA‐MIF knockdown‐caused Fbxw7 down‐regulation and c‐Myc up‐regulation were strongly minimized by miR‐586 inhibitor (Fig 4I). Furthermore, ectopic expression of lncRNA‐MIF or lncRNA‐MIF harboring nonsense mutations was shown to up‐regulate Fbxw7 and down‐regulate c‐Myc, whereas overexpression of miR‐586 binding‐defective lncRNA‐MIF which had lost the ability to bind miR‐586 showed no effect on either Fbxw7 or c‐Myc (Fig 4J and K). All together, our data suggest that lncRNA‐MIF functions as miR‐586 sponge and attenuates the inhibitory effect of miR‐586 on Fbxw7, thereby leading to elevated Fbxw7 and reduced c‐Myc.
Actually, there are two major isoforms of lncRNA RP11‐320M2.1. LncRNA‐MIF is isoform 001, which is largely overlapped with a longer isoform 002 named as lncRNA‐MIF‐L (long). We found that c‐Myc did not affect lncRNA‐MIF‐L (Fig EV3A and B). Moreover, the copy number of lncRNA‐MIF‐L was only 2% of that in MCF7, HeLa, or H1299 cells (Fig EV3C). These results indicate that lncRNA‐MIF‐L will have little, if any, sponge effect on miR‐586. We also knocked down lncRNA‐MIF‐L in HeLa cells and showed it did not affect the level of miR‐586, FBXW7, or c‐Myc (Fig EV3D and E). Based on these results, lncRNA‐MIF‐L is unlikely to serve as a ceRNA for miR‐586.
Figure EV3. LncRNA‐MIF‐L is not a ceRNA for miR‐586 to regulate Fbxw7 expression.
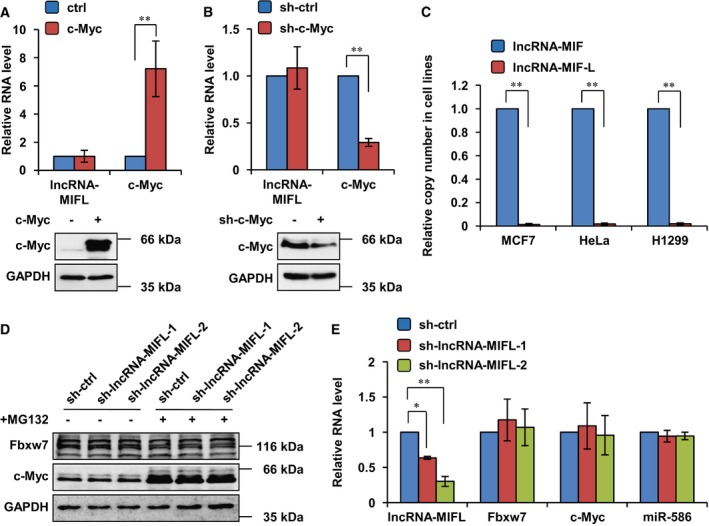
- HeLa cells were transfected with control vector or Flag‐c‐Myc. Twenty‐four hours after transfection, cell lysates were analyzed by Western blotting, and total RNA was analyzed by real‐time RT–PCR. Data shown are mean ± SD (n = 3; **P < 0.01, two‐tailed t‐test).
- HeLa, HCT116, and MCF10A cells were separately infected with lentiviruses expressing either control shRNA or c‐Myc shRNA. Twenty‐four hours after infection, total RNA was analyzed by real‐time RT–PCR. Data shown are mean ± SD (n = 3; **P < 0.01, two‐tailed t‐test).
- The copy numbers of lncRNA‐MIF and lncRNA‐MIF‐L transcript per million cells in the indicated cells were quantified using a quantitative real‐time RT–PCR assay. Data shown are mean ± SD, and lncRNA‐MIF as control (n = 3; **P < 0.01, two‐tailed t‐test).
- HeLa cells were infected with lentiviruses expressing control shRNA, lncRNA‐MIF‐L shRNA‐1 or ‐2. Forty‐eight hours after infection, cells were treated with MG132 or DMSO for 6 h. Cell lysates were then analyzed by Western blotting with the indicated antibodies.
- HeLa cells were infected with lentiviruses expressing control RNA, lncRNA‐MIF, or lncRNA‐MIF‐AS. Forty‐eight hours after infection, total RNA was subjected to real‐time RT–PCR analysis. Data shown are mean ± SD (n = 3; *P < 0.05, **P < 0.01, two‐tailed t‐test).
LncRNA‐MIF decreases c‐Myc and c‐Jun levels by increased Fbxw7 expression
The substrates of Fbxw7 include several widely studied proteins such as cyclin E1, c‐Myc, and c‐Jun 33. In addition to c‐Myc, we demonstrated that lncRNA‐MIF also affected c‐Jun, which was required for progression through the G1 phase of the cell cycle. When lncRNA‐MIF was introduced into HeLa cells, c‐Myc and c‐Jun protein but not mRNA levels were greatly reduced (Fig 5A and C). However, lncRNA‐MIF‐AS had no effect on either c‐Myc or c‐Jun (Fig 5A and C). Consistently, depletion of lncRNA‐MIF by lncRNA‐MIF shRNA‐1, ‐2, and ‐3 led to an increase in c‐Myc and c‐Jun protein but not mRNA levels (Fig 5D and E). Interestingly, lncRNA‐MIF showed no effect on cyclin E1 (Fig 5A, C, D and E).
LncRNA‐MIF inhibits the glycolysis via miR‐586
c‐Myc has been well known for its ability to promote the glycolysis under normoxia through transcriptionally regulating its target genes involved in the glycolysis pathway. Given that lncRNA‐MIF was able to decrease c‐Myc protein level, we sought to determine whether lncRNA‐MIF could inhibit the glycolysis. Knockdown of lncRNA‐MIF led to the acidification of the culture medium, whereas overexpression of lncRNA‐MIF showed the opposite phenotype (Fig 6A). Consistent with these, knockdown of lncRNA‐MIF reduced, whereas overexpression of lncRNA‐MIF increased c‐Myc target genes involved in the glycolysis pathway such as GLUT1, LDHA, PKM2, and HK2 (Fig 6B). To further confirm the effect of lncRNA‐MIF on the glycolysis, we examined the glucose uptake and lactate production in HeLa cells with overexpression or knockdown of lncRNA‐MIF. We found that lncRNA‐MIF induction led to a strong decrease in glucose uptake and lactate production (Fig 6C and D). In contrast, lncRNA‐MIF knockdown increased glucose uptake and lactate production (Fig 6E and F). These data strongly indicate that lncRNA‐MIF inhibits the glycolysis. We next investigated whether miR‐586 mediated the inhibitory effect of lncRNA‐MIF on the glycolysis. Induction of miR‐586 by its mimics markedly recovered lncRNA‐MIF‐decreased glucose uptake and lactate production (Fig 6C and D). Also, knockdown of miR‐586 by its inhibitors greatly reversed lncRNA‐MIF knockdown‐increased glucose uptake and lactate production (Fig 6E and F). These results indicate that lncRNA‐MIF inhibits the glycolysis via miR‐586.
Figure 6. LncRNA‐MIF inhibits the glycolysis via miR‐586.
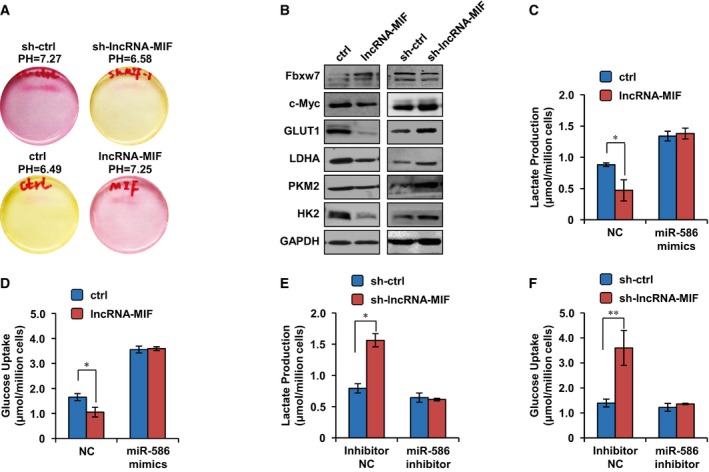
- HeLa cells were infected with lentiviruses expressing control RNA, lncRNA‐MIF, control shRNA, or lncRNA‐MIF shRNA as indicated. Forty‐eight hours after infection, acidification of the culture medium was evaluated by visually inspecting the color of the medium. Yellow medium indicates the presence of more lactate.
- HeLa cells were infected with lentiviruses expressing control RNA, lncRNA‐MIF, control shRNA, or lncRNA‐MIF shRNA as indicated. Forty‐eight hours after infection, cell lysates were analyzed by Western blotting with the indicated antibodies.
- HeLa cells expressing either lncRNA‐MIF or control RNA were transfected with miR‐586 mimics or negative control mimics (NC mimics) as indicated. Twenty‐four hours after transfection, levels of lactate in the culture medium were measured and normalized to cell number. Data shown are mean ± SD (n = 3; *P < 0.05, two‐tailed t‐test).
- HeLa cells expressing either lncRNA‐MIF or control RNA were transfected with miR‐586 mimics or negative control mimics (NC mimics) as indicated. Twenty‐four hours after transfection, intracellular glucose levels were measured and normalized based on protein concentration. Data shown are mean ± SD (n = 3; *P < 0.05, two‐tailed t‐test).
- HeLa cells expressing either lncRNA‐MIF or control shRNA were transfected with miR‐586 inhibitor or NC inhibitor as indicated. Twenty‐four hours after transfection, levels of lactate in the culture medium were measured and normalized to cell number. Data shown are mean ± SD (n = 3; *P < 0.05, two‐tailed t‐test).
- HeLa cells expressing either lncRNA‐MIF or control shRNA were transfected with miR‐586 inhibitor or NC inhibitor as indicated. Twenty‐four hours after transfection, intracellular glucose levels were measured and normalized based on protein concentration. Data shown are mean ± SD (n = 3; **P < 0.01, two‐tailed t‐test).
LncRNA‐MIF functions as a tumor suppressor to inhibit cell proliferation and cell cycle progression
We measured the growth rate of HeLa cells expressing control RNA, lncRNA‐MIF, and lncRNA‐MIF‐AS, respectively. A marked inhibition of cell proliferation was observed in HeLa cells expressing lncRNA‐MIF, but not expressing lncRNA‐MIF‐AS or control RNA (Fig 7A). Growth rates of HeLa cells expressing control shRNA, lncRNA‐MIF shRNA‐1, ‐2, and ‐3 were also measured. HeLa cells expressing lncRNA‐MIF shRNA‐1, ‐2, or ‐3 exhibited higher growth rate than HeLa cells expressing control shRNA (Fig 7B), indicating that lncRNA‐MIF inhibits cell proliferation. Moreover, knockdown of c‐Myc nullified the effect of MIF depletion on cell growth rate (Fig EV4), indicating that the effect of lncRNA‐MIF on cell proliferation is dependent on c‐Myc.
Figure 7. LncRNA‐MIF inhibits cell proliferation and cell cycle progression.
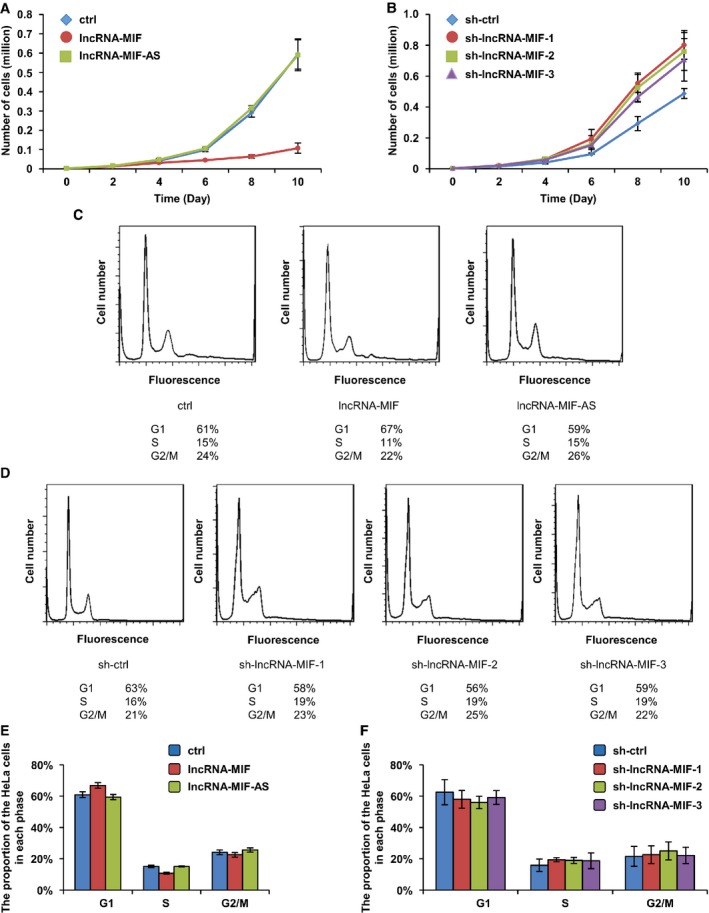
- HeLa cells were infected with lentiviruses expressing control RNA, lncRNA‐MIF or lncRNA‐MIF‐AS as indicated. Forty‐eight hours after infection, growth curves were measured for the indicated periods of time. Data shown are mean ± SD (n = 3).
- HeLa cells were infected with lentiviruses expressing control shRNA, lncRNA‐MIF shRNA‐1, ‐2, or ‐3. Forty‐eight hours after infection, growth curves were measured for the indicated periods of time. Data shown are mean ± SD (n = 3).
- HeLa cells were infected with lentiviruses expressing control RNA, lncRNA‐MIF, or lncRNA‐MIF‐AS as indicated. Forty‐eight hours after infection, cells were stained with PI and analyzed by flow cytometry to identify phases of cell cycle.
- HeLa cells were infected with lentiviruses expressing control shRNA, lncRNA‐MIF shRNA‐1, ‐2, or ‐3. Forty‐eight hours after infection, cells were stained with PI and analyzed by flow cytometry to identify phases of cell cycle.
- The percentage numbers of cells from (C) in G1, S or G2/M phase were analyzed by FlowJo 7.6 software. Data shown are mean ± SD (n = 3).
- The percentage numbers of cells from (D) in G1, S or G2/M phase were analyzed by FlowJo 7.6 software. Data shown are mean ± SD (n = 3).
Figure EV4. The effect of lncRNA‐MIF on cell proliferation is dependent on c‐Myc.
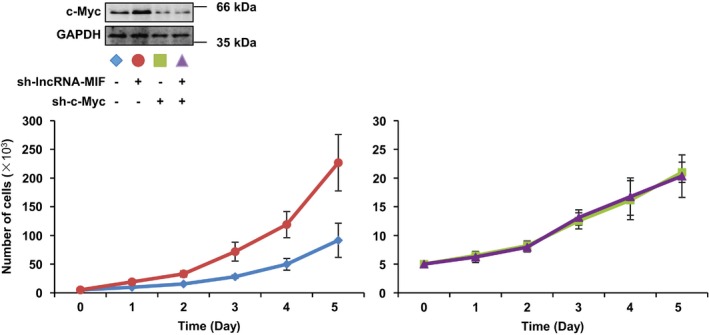
HeLa cells expressing control shRNA or lncRNA‐MIF shRNA were infected with lentiviruses expressing control shRNA or c‐Myc shRNA. Forty‐eight hours after infection, growth curves were measured for the indicated periods of time. Data shown are mean ± SD (n = 3). Cell lysates were analyzed by Western blotting with the indicated antibodies.
We further performed a flow cytometric analysis for cell cycle and higher percentage of HeLa cells expressing lncRNA‐MIF were in the G1 phase compared with the cells expressing control RNA or lncRNA‐AS (Fig 7C and E). Consistently, a higher percentage of HeLa cells expressing lncRNA‐MIF shRNA‐1, ‐2, or ‐3 were in the S and G2/M phases compared with the cells expressing control shRNA (Fig 7D and F). These data suggest the inhibitory effect of lncRNA‐MIF on cell cycle regulation.
Considering the inhibitory effect of the lncRNA‐MIF–miR‐586–Fbxw7–cMyc axis on the glycolysis, we speculated that lncRNA‐MIF may also inhibit cell proliferation via miR‐586. To test this possibility, we performed the colony formation assay. As was expected, ectopic expression of lncRNA‐MIF decreased the number of colonies from control HeLa cells, but not that from miR‐586‐overexpressing HeLa cells (Fig 8A). In addition, knockdown of lncRNA‐MIF increased the number of colonies from control HeLa cells, but not from miR‐586 knockdown HeLa cells (Fig 8B). Together, these results suggest that lncRNA‐MIF inhibits cell proliferation via miR‐586.
Figure 8. LncRNA‐MIF functions as a tumor suppressor to inhibit colony formation and cell proliferation.
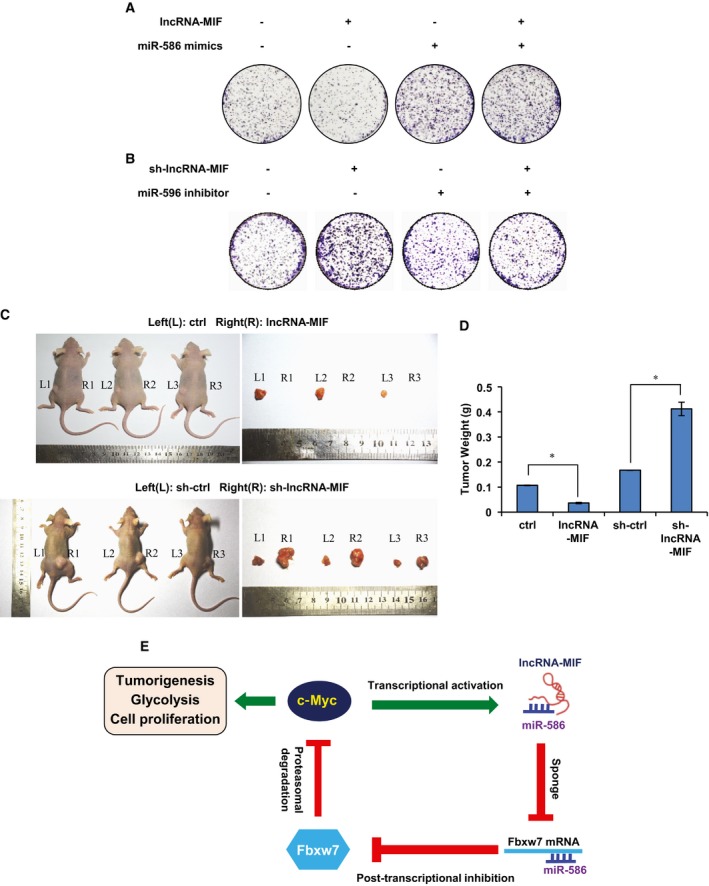
- HeLa cells expressing either lncRNA‐MIF or control RNA were transfected with miR‐586 mimics or NC mimics as indicated. Colonies were stained with crystal violet and counted after 14 days incubation.
- HeLa cells expressing either MIF shRNA or control shRNA were transfected with miR‐586 inhibitors or NC inhibitors as indicated. Colonies were stained with crystal violet and counted after 14 days incubation.
- 2 × 10⁶ HeLa cells expressing either lncRNA‐MIF, MIF control RNA, MIF shRNA, or MIF control shRNA were individually injected subcutaneously into flanks of nude mice (n = 7 for each group). Representative photographs of xenograft tumors in situ were taken 3 weeks after injection.
- Three weeks post‐graft, mice were euthanized, tumors were excised and weighed, and the mean tumor weight was plotted on the graph. Data shown are mean ± SD (n = 7; *P < 0.05, two‐tailed t‐test).
- A schematic illustration of the proposed model depicting a role of c‐Myc‐induced lncRNA‐MIF in regulating glycolysis via suppression of c‐Myc.
To further determine whether lncRNA‐MIF regulates tumorigenesis, we used a xenograft mouse model. HeLa cells stably expressing exogenous lncRNA‐MIF or lncRNA‐MIF shRNA were injected subcutaneously into the dorsal flanks of the nude mice (n = 7 for each group). Three weeks after injection, mice were sacrificed and tumors were excised. Knockdown of lncRNA‐MIF indeed increased tumorigenicity of HeLa cells (Fig 8C and D). In contrast, induction of lncRNA‐MIF suppressed HeLa cell tumorigenicity (Fig 8C and D). We further examined the expression levels of lncRNA‐MIF and miR‐586 in patients' colorectal carcinoma and their para‐carcinoma tissues. Both lncRNA‐MIF and miR‐586 in carcinoma tissues exhibited higher expression compared with that in para‐carcinoma tissues (Fig EV5A). Based on the TCGA dataset, we found that lncRNA‐MIF expression level was higher in head and neck carcinoma than normal tissues (Fig EV5B).
Figure EV5. lncRNA‐MIF and miR‐586 show higher expression in carcinoma than in para‐carcinoma or normal cells.
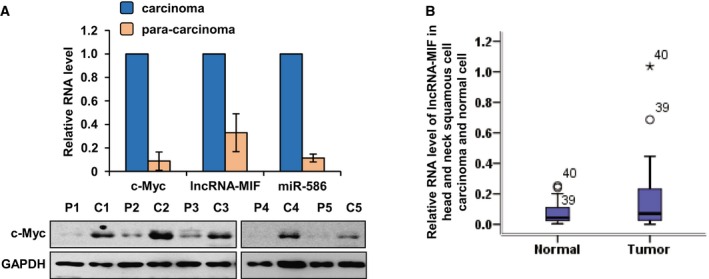
- Proteins and total RNA were extracted from five pairs of colorectal carcinoma and para‐carcinoma tissues. Protein samples were analyzed by Western blotting and total RNA was subjected to real‐time RT–PCR analysis. Data shown are mean ± SD (n = 3).
- Data of lncRNA‐MIF expression level in HNSC (head and neck squamous cells) carcinoma and normal tissues were downloaded from TCGA dataset. Box plots showing the differential expression (mean ± SD) of lncRNA‐MIF between normal and tumor samples (n = 40).
Discussion
Cellular levels of c‐Myc are nevertheless prone to fluctuation with the ever‐changing environment, which may yield global effects on cells. How c‐Myc level is regulated under physiological and/or cancerous conditions remains an unaddressed question. LncRNAs have recently attracted a lot of attention due to their abundance in the genome and biological significance in gene regulation. In this study, we show that as a target gene of c‐Myc, lncRNA‐MIF acts as a non‐coding ceRNA (competing endogenous RNA) to compete with Fbxw7 mRNA for miR‐586 and relieves the inhibitory effect of miR‐586 on Fbxw7. This in turn increases Fbxw7 and accelerates Fbxw7‐dependent degradation of c‐Myc (Fig 8D). These data suggest that lncRNA‐MIF suppresses c‐Myc expression via absorbing more miR‐586 to up‐regulate Fbxw7, an E3 ligase for c‐Myc. As a transcriptional factor, c‐Myc is able to modulate expression of a large number of target genes and regulate multiple cellular processes including metabolism 34. Recent studies have shown that many newly identified lncRNAs and microRNAs are c‐Myc target genes 35, 36, 37, 38. The c‐Myc‐responsive lncRNAs are able to regulate cancer cell proliferation and invasion 39, 40, 41, 42, 43. We here also show that as a novel transcript by c‐Myc, lncRNA‐MIF strongly inhibits the glycolysis as well as tumor formation in nude mice. Taken together, these findings imply lncRNAs can serve as a novel class of tumor suppressive non‐coding RNAs controlling c‐Myc‐driven tumorigenesis.
Despite that lncRNAs expression can be regulated by c‐Myc, several lncRNAs have recently been shown to regulate c‐Myc expression at multiple levels. For example, lncRNA‐CCAT1‐L (colon cancer‐associated transcript 1, the long isoform) is able to promote Myc transcription via establishing an intra‐chromosome looping between Myc and its upstream enhancer element 44. LncRNA‐GHET1 (gastric carcinoma high expressed transcript 1) promotes gastric carcinoma cell proliferation by increasing c‐Myc mRNA stability 45. LncRNA‐GAS5 (growth arrest‐specific transcript 5) binds to c‐Myc mRNA and suppresses c‐Myc translation via cooperating with the eukaryotic translation initiation factor 4E (eIF4E) 46. LncRNA‐PCAT1 (prostate cancer‐associated transcript 1) post‐transcriptionally regulates c‐Myc expression by abrogating the down‐regulation of c‐Myc by miR‐34a 47. In addition, lncRNA‐PVT1 (plasmacytoma variant translocation 1) increases protein expression of c‐Myc via reducing its phosphorylation at threonine 58 (Thr58) and protecting it from proteasome‐dependent degradation 48. In our study, we show that lncRNA‐MIF is able to negatively regulate c‐Myc expression by acting as miR‐586 sponge to increase Fbxw7 expression. Our findings therefore uncover a novel mechanism that depends on both long and small non‐coding RNAs to control c‐Myc stability, and add another layer of complexity to the c‐Myc regulation.
c‐Myc is also known to be dysregulated in a variety of human cancers, and many of them are addicted to c‐Myc oncogenic signaling 49. c‐Myc is believed to be a promising target for treatment of cancer 50. A casual link between lncRNAs and human cancer has been clearly established as many lncRNAs are dysregulated in various human cancers 21, 51. By suppressing c‐Myc expression, lncRNA‐MIF plays an important role in inhibiting aerobic glycolysis and tumorigenesis. As shown above, lncRNA‐MIF overexpression decreases, whereas lncRNA‐MIF knockdown increases tumorigenicity of HeLa cells. In addition, lncRNA‐MIF down‐regulates c‐Jun, which has important function in progression through the G1 phase of the cell cycle, demonstrating that lncRNA‐MIF is able to inhibit cancer cell proliferation via cell cycle arrest. These data suggest that lncRNA‐MIF may represent a potential candidate for cancer therapy.
In summary, our findings in this study have uncovered a long non‐coding RNA lncRNA‐MIF, which links c‐Myc transcription and its degradation. When c‐Myc is overexpressed, it drives transcription of lncRNA‐MIF, which functions as molecular sponge to absorb more cytosolic miR‐586, thus leading to reduction in miR‐586‐mediated translational repression of Fbxw7. Conversely, in the case where c‐Myc is reduced, lncRNA‐MIF transcription is attenuated, which leads to increased free miR‐586 in the cytosol that in turn triggers down‐regulation of Fbxw7. Whether the c‐Myc–MIF–miR586–Fbxw7 may represent a novel mechanism to regulate c‐Myc protein homeostasis still awaits further investigation. We realize that there are many other uncharacterized factors which are involved in the regulation of c‐Myc stability besides lncRNA‐MIF, Fbxw7, or miR‐586.
Materials and Methods
Antibodies and reagents
The following antibodies were used for Western blot assays in this study: anti‐Fbxw7 (R&D Systems); anti‐c‐Myc, anti‐GAPDH, anti‐GLUT1, anti‐LDHA, and anti‐PDK1 (Cell Signaling Technology); anti‐PKM2 and anti‐HK2 (Immunoway); anti‐PTBP1 (Proteintech). Anti‐c‐Myc for ChIP assay was from Santa Cruz. Cycloheximide, doxycycline, cholera toxin, and hydrocortisone were from Sigma‐Aldrich.
Cell culture
HeLa, A549, H1299, HCT116, and MCF7 cell lines were cultured in DMEM (Dulbecco's modified Eagle's medium) medium containing 10% fetal bovine serum. P493‐6 cell lines were cultured in RPMI medium 1640 containing 10% fetal bovine serum. MCF10A cell line was cultured in DMEM/F12 medium containing 5% horse serum, 20 μg/ml EGF, 0.5 μg/ml hydrocortisone, 100 ng/ml cholera toxin, and 10 μg/ml insulin. All cells were tested for mycoplasma contamination and had no mycoplasma contamination.
ChIP assay
HeLa cells were cross‐linked with 1% formaldehyde for 10 min. The ChIP assay was performed by using anti‐c‐Myc antibody and the Pierce Agarose ChIP kit (ThermoScientific, USA) according to the manufacturer's instructions. Anti‐rabbit immunoglobulin G was also used as a negative control. The bound DNA fragments were subjected to real‐time PCR using the specific primers (Table EV1).
Luciferase reporter assay
To determine the effect of c‐Myc on lncRNA‐MIF promoter, either p3xflag‐Myc‐CMV‐24 or p3xflag‐Myc‐CMV‐24‐c‐Myc was co‐transfected into HeLa cells together with individual PGL3‐MIF1/2/3/1‐M/2‐M/3‐M construct plus Renilla luciferase reporter plasmid. Twenty‐four hours after transfection, firefly and Renilla luciferase activity were measured by a Dual‐Luciferase Reporter Assay System (Promega, Madison, WI, USA). The data are represented as mean ± SD of three independent experiments. To evaluate the effect of miR‐586 on Fbxw7 3′ UTR, HeLa cells were co‐transfected with the psicheck2‐based constructs containing Fbxw7 3′ UTR or Fbxw7 3′ UTR‐M plus miR‐586 mimics or inhibitors. Twenty‐four hours after transfection, firefly and Renilla luciferase activity were measured by a Dual‐Luciferase Reporter Assay System (Promega, Madison, WI, USA). The data are represented as mean ± SD of three independent experiments.
Colony formation assay
HeLa cells expressing control RNA, lncRNA‐MIF, control shRNA, or lncRNA‐MIF shRNA were transfected with miR‐586 mimics or inhibitors as indicated. Twenty‐four hours after transfection, HeLa cells (5 × 10³) in each condition were cultured in a six‐well plate. Fourteen days later, cells were fixed, stained with crystal violet, and photographed.
Northern blot analysis
Northern blot analysis was performed as described previously 18 with minor modifications. Briefly, 20 μg of RNA was resolved by 1% denaturing agarose gel electrophoresis and transferred to Hybond‐N membrane (GE Healthcare) by capillary transfer, followed by UV cross‐linking. For Northern blots using digoxin‐labeled oligonucleotide probes, the prehybridization/hybridization buffer (Ambion) was used according to the manufacturer's instructions. After hybridization, blots were incubated with HRP‐conjugated anti‐digoxin antibody. Immunolabelling was developed with ECL Western Blotting Detection Reagent (GE Amersham). Visualized images were obtained using Image Quant LAS‐4000 mini (GE Fujifilm).
Real‐time RT–PCR
Total RNA was isolated by TRIzol reagent (Invitrogen). One μg of RNA was used to synthesize cDNA using the First‐strand cDNA Synthesis System (Marligen Biosciences). Real‐time PCR was performed using SYBR Green real‐time PCR analysis (Takara) with the specific primers (Table EV1). PCR results, recorded as cycle threshold (C t), were normalized against an internal control (β‐actin).
Quantitation of lncRNA‐MIF, lncRNA‐MIF‐L, and miR‐586 expression levels
The exact copy numbers of lncRNA‐MIF, lncRNA‐MIF‐L, and miR‐586 transcripts per HeLa cell were quantified by using quantitative real‐time RT–PCR assay. In this assay, serially diluted RT–PCR products of lncRNA‐MIF, lncRNA‐MIF‐L, and miR‐586 were used as templates to formulate standard curves, and then, the exact copies of lncRNA‐MIF, lncRNA‐MIF‐L, and miR‐586 per cell were calculated accordingly.
Cytosolic/nuclear fractionation
HeLa cells (1 × 10⁷) were incubated with hypotonic buffer (25 mM Tris–HCl, PH 7.4, 1 mM MgCl2, 5 mM KCl) on ice for 5 min. An equal volume of hypotonic buffer containing 1% NP‐40 was then added, and each sample was left on ice for another 5 min. After centrifugation at 5,000 g for 5 min, the supernatant was collected as the cytosolic fraction. The pellets were re‐suspended in nucleus resuspension buffer (20 mM HEPES, pH 7.9, 400 mM NaCl, 1 mM EDTA, 1 mM EGTA, 1 mM DTT, 1 mM PMSF) and incubated at 4°C for 30 min. Nuclear fraction was collected after removing insoluble membrane debris by centrifugation at 12,000 g for 10 min.
Biotin pull‐down assay
All processes were performed in the RNase‐free conditions. For antisense oligomer affinity pull‐down assay, sense or antisense biotin‐labeled DNA oligomers corresponding to human lncRNA‐MIF (1 μg) were incubated with lysates from HeLa cells (2 × 10⁷) or the cytosolic/nuclear extracts. One hour after incubation, streptavidin‐coupled agarose beads (Invitrogen) were added to isolate the RNA–protein complex or RNA–RNA complex. For in vitro RNA pull‐down assay, 3 μg in vitro‐synthesized biotin‐labeled lncRNA‐MIF was incubated with lysates from HeLa cells (2 × 10⁷) for 3 h. Streptavidin‐coupled agarose beads (Invitrogen) were then added to the reaction mix to isolate the RNA–protein complex or RNA–RNA complex.
Glucose uptake assay
Glucose uptake assay was performed as previously described 52.
Lactate production assay
Lactate production assay was performed as previously described 52.
Cell cycle analysis
HeLa cells were infected with lentiviruses and screened by puromycin. HeLa cells (1 × 10⁶) were plated into 6‐mm plates. During the proliferative exponential phase (50% confluency), cells were fixed in 70% ethanol overnight. Cells were then stained with propidium iodide and analyzed by flow cytometry.
Xenograft mouse model
HeLa cells expressing control RNA, lncRNA‐MIF, control shRNA, or lncRNA‐MIF shRNA (2 × 10⁶) were subcutaneously injected into the dorsal flank of 4‐week‐old male athymic nude mice (Shanghai SLAC Laboratory Animal Co. Ltd.) (n = 7 mice per group). After 3 weeks, mice were sacrificed, and tumors were excised and weighed. Mice were used in the experiment at random. During testing the tumors' weight, the experimentalists were blinded to the information and shape of tumor tissue masses. Studies on animals were conducted with approval from the Animal Research Ethics Committee of the University of Science and Technology of China.
Author contributions
PFZ, LMC, and MW designed research; PFZ and LMC performed experiments and analyzed data; PSF provided material support; PFZ, YDM, and MW wrote and revised the manuscript.
Conflict of interest
The authors declare that they have no conflict of interest.
Supporting information
Expanded View Figures PDF
Table EV1
Dataset EV1
Review Process File
Acknowledgements
The results shown in figure EV5B are in whole based upon data generated by the TCGA Research Network: http://cancergenome.nih.gov/. We thank Professor Han Liang for his website (http://ibl.mdanderson.org/tanric/_design/basic/index.html), which helps us to analyze the data. We would like to thank Professor Ping Gao for providing P493‐6 cells carrying a c‐Myc tet‐off system. This work was supported by grants from National Natural Science Foundation of China (81430065 and 31371388).
EMBO Reports (2016) 17: 1204–1220
References
- 1. Bishop JM (1982) Retroviruses and cancer genes. Adv Cancer Res 37: 1–32 [DOI] [PubMed] [Google Scholar]
- 2. Bister K, Jansen HW (1986) Oncogenes in retroviruses and cells: biochemistry and molecular genetics. Adv Cancer Res 47: 99–188 [DOI] [PubMed] [Google Scholar]
- 3. Vita M, Henriksson M (2006) The Myc oncoprotein as a therapeutic target for human cancer. Semin Cancer Biol 16: 318–330 [DOI] [PubMed] [Google Scholar]
- 4. Cole MD (1986) The myc oncogene: its role in transformation and differentiation. Annu Rev Genet 20: 361–384 [DOI] [PubMed] [Google Scholar]
- 5. Popescu NC, Zimonjic DB (2002) Chromosome‐mediated alterations of the MYC gene in human cancer. J Cell Mol Med 6: 151–159 [DOI] [PMC free article] [PubMed] [Google Scholar]
- 6. Meyer N, Penn LZ (2008) MYC – TIMELINE reflecting on 25 years with MYC. Nat Rev Cancer 8: 976–990 [DOI] [PubMed] [Google Scholar]
- 7. Bhatia K, Huppi K, Spangler G, Siwarski D, Iyer R, Magrath I (1993) Point mutations in the c‐Myc transactivation domain are common in Burkitt's lymphoma and mouse plasmacytomas. Nat Genet 5: 56–61 [DOI] [PubMed] [Google Scholar]
- 8. Clark HM, Yano T, Otsuki T, Jaffe ES, Shibata D, Raffeld M (1994) Mutations in the coding region of C‐Myc in aids‐associated and other aggressive lymphomas. Cancer Res 54: 3383–3386 [PubMed] [Google Scholar]
- 9. Dang CV (2012) MYC on the path to cancer. Cell 149: 22–35 [DOI] [PMC free article] [PubMed] [Google Scholar]
- 10. Lin CY, Loven J, Rahl PB, Paranal RM, Burge CB, Bradner JE, Lee TI, Young RA (2012) Transcriptional amplification in tumor cells with elevated c‐Myc. Cell 151: 56–67 [DOI] [PMC free article] [PubMed] [Google Scholar]
- 11. Nie ZQ, Hu GQ, Wei G, Cui KR, Yamane A, Resch W, Wang RN, Green DR, Tessarollo L, Casellas R et al (2012) c‐Myc is a universal amplifier of expressed genes in lymphocytes and embryonic stem cells. Cell 151: 68–79 [DOI] [PMC free article] [PubMed] [Google Scholar]
- 12. Fernandez PC, Frank SR, Wang LQ, Schroeder M, Liu SX, Greene J, Cocito A, Amati B (2003) Genomic targets of the human c‐Myc protein. Gene Dev 17: 1115–1129 [DOI] [PMC free article] [PubMed] [Google Scholar]
- 13. Dang CV (2013) MYC, metabolism, cell growth, and tumorigenesis. Csh Perspect Med 3: a014217 [DOI] [PMC free article] [PubMed] [Google Scholar]
- 14. Dang CV, O'Donnell KA, Zeller KI, Nguyen T, Osthus RC, Li F (2006) The c‐Myc target gene network. Semin Cancer Biol 16: 253–264 [DOI] [PubMed] [Google Scholar]
- 15. Derrien T, Johnson R, Bussotti G, Tanzer A, Djebali S, Tilgner H, Guernec G, Martin D, Merkel A, Knowles DG et al (2012) The GENCODE v7 catalog of human long noncoding RNAs: analysis of their gene structure, evolution, and expression. Genome Res 22: 1775–1789 [DOI] [PMC free article] [PubMed] [Google Scholar]
- 16. Iorio MV, Croce CM (2012) MicroRNA dysregulation in cancer: diagnostics, monitoring and therapeutics. A comprehensive review. EMBO Mol Med 4: 143–159 [DOI] [PMC free article] [PubMed] [Google Scholar]
- 17. Bonasio R, Shiekhattar R (2014) Regulation of transcription by long noncoding RNAs. Annu Rev Genet 48: 433–455 [DOI] [PMC free article] [PubMed] [Google Scholar]
- 18. Wilusz JE, Freier SM, Spector DL (2008) 3′ end processing of a long nuclear‐retained noncoding RNA yields a tRNA‐like cytoplasmic RNA. Cell 135: 919–932 [DOI] [PMC free article] [PubMed] [Google Scholar]
- 19. Kartha RV, Subramanian S (2014) Competing endogenous RNAs (ceRNAs): new entrants to the intricacies of gene regulation. Front Genet 5: 8 [DOI] [PMC free article] [PubMed] [Google Scholar]
- 20. Tay Y, Rinn J, Pandolfi PP (2014) The multilayered complexity of ceRNA crosstalk and competition. Nature 505: 344–352 [DOI] [PMC free article] [PubMed] [Google Scholar]
- 21. Gutschner T, Diederichs S (2012) The hallmarks of cancer: a long non‐coding RNA point of view. RNA Biol 9: 703–719 [DOI] [PMC free article] [PubMed] [Google Scholar]
- 22. Qiu MT, Hu JW, Yin R, Xu L (2013) Long noncoding RNA: an emerging paradigm of cancer research. Tumour Biol 34: 613–620 [DOI] [PubMed] [Google Scholar]
- 23. Liu J, Levens D (2006) Making myc. Curr Top Microbiol Immunol 302: 1–32 [DOI] [PubMed] [Google Scholar]
- 24. Wierstra I, Alves J (2008) The c‐myc promoter: still MysterY and challenge. Adv Cancer Res 99: 113–333 [DOI] [PubMed] [Google Scholar]
- 25. Hann SR (2006) Role of post‐translational modifications in regulating c‐Myc proteolysis, transcriptional activity and biological function. Semin Cancer Biol 16: 288–302 [DOI] [PubMed] [Google Scholar]
- 26. Wall M, Poortinga G, Hannan KM, Pearson RB, Hannan RD, McArthur GA (2008) Translational control of c‐MYC by rapamycin promotes terminal myeloid differentiation. Blood 112: 2305–2317 [DOI] [PubMed] [Google Scholar]
- 27. Farrell AS, Sears RC (2014) MYC degradation. Cold Spring Harb Perspect Med 4: a014365 [DOI] [PMC free article] [PubMed] [Google Scholar]
- 28. Welcker M, Orian A, Jin J, Grim JE, Harper JW, Eisenman RN, Clurman BE (2004) The Fbw7 tumor suppressor regulates glycogen synthase kinase 3 phosphorylation‐dependent c‐Myc protein degradation. Proc Natl Acad Sci USA 101: 9085–9090 [DOI] [PMC free article] [PubMed] [Google Scholar]
- 29. Yada M, Hatakeyama S, Kamura T, Nishiyama M, Tsunematsu R, Imaki H, Ishida N, Okumura F, Nakayama K, Nakayama KI (2004) Phosphorylation‐dependent degradation of c‐Myc is mediated by the F‐box protein Fbw7. EMBO J 23: 2116–2125 [DOI] [PMC free article] [PubMed] [Google Scholar]
- 30. Hofmann JW, Zhao XA, De Cecco M, Peterson AL, Pagliaroli L, Manivannan J, Hubbard GB, Ikeno Y, Zhang YQ, Feng B et al (2015) Reduced expression of MYC increases longevity and enhances healthspan. Cell 160: 477–488 [DOI] [PMC free article] [PubMed] [Google Scholar]
- 31. Wu S, Yin X, Fang X, Zheng J, Li L, Liu X, Chu L (2015) c‐MYC responds to glucose deprivation in a cell‐type‐dependent manner. Cell Death Discov 1: 15057 [DOI] [PMC free article] [PubMed] [Google Scholar]
- 32. Hill CG, Jabbari N, Matyunina LV, McDonald JF (2014) Functional and evolutionary significance of human microRNA seed region mutations. PLoS ONE 9: e115241 [DOI] [PMC free article] [PubMed] [Google Scholar]
- 33. Welcker M, Clurman BE (2008) FBW7 ubiquitin ligase: a tumour suppressor at the crossroads of cell division, growth and differentiation. Nat Rev Cancer 8: 83–93 [DOI] [PubMed] [Google Scholar]
- 34. Hsieh AL, Walton ZE, Altman BJ, Stine ZE, Dang CV (2015) MYC and metabolism on the path to cancer. Semin Cell Dev Biol 43: 11–21 [DOI] [PMC free article] [PubMed] [Google Scholar]
- 35. Hart JR, Roberts TC, Weinberg MS, Morris KV, Vogt PK (2014) MYC regulates the non‐coding transcriptome. Oncotarget 5: 12543–12554 [DOI] [PMC free article] [PubMed] [Google Scholar]
- 36. Song L, Dai T, Xie Y, Wang C, Lin C, Wu Z, Ying Z, Wu J, Li M, Li J (2012) Up‐regulation of miR‐1245 by c‐myc targets BRCA2 and impairs DNA repair. J Mol Cell Biol 4: 108–117 [DOI] [PubMed] [Google Scholar]
- 37. Winkle M, van den Berg A, Tayari M, Sietzema J, Terpstra M, Kortman G, de Jong D, Visser L, Diepstra A, Kok K et al (2015) Long noncoding RNAs as a novel component of the Myc transcriptional network. FASEB J 29: 2338–2346 [DOI] [PubMed] [Google Scholar]
- 38. Zheng GX, Do BT, Webster DE, Khavari PA, Chang HY (2014) Dicer‐microRNA‐Myc circuit promotes transcription of hundreds of long noncoding RNAs. Nat Struct Mol Biol 21: 585–590 [DOI] [PMC free article] [PubMed] [Google Scholar]
- 39. Barsyte‐Lovejoy D, Lau SK, Boutros PC, Khosravi F, Jurisica I, Andrulis IL, Tsao MS, Penn LZ (2006) The c‐Myc oncogene directly induces the H19 noncoding RNA by allele‐specific binding to potentiate tumorigenesis. Cancer Res 66: 5330–5337 [DOI] [PubMed] [Google Scholar]
- 40. Grossi E, Sanchez Y, Huarte M (2015) Expanding the p53 regulatory network: LncRNAs take up the challenge. Biochim Biophys Acta 1859: 200–208 [DOI] [PubMed] [Google Scholar]
- 41. He X, Tan X, Wang X, Jin H, Liu L, Ma L, Yu H, Fan Z (2014) C‐Myc‐activated long noncoding RNA CCAT1 promotes colon cancer cell proliferation and invasion. Tumour Biol 35: 12181–12188 [DOI] [PubMed] [Google Scholar]
- 42. Kim T, Cui R, Jeon YJ, Fadda P, Alder H, Croce CM (2015) MYC‐repressed long noncoding RNAs antagonize MYC‐induced cell proliferation and cell cycle progression. Oncotarget 6: 18780–18789 [DOI] [PMC free article] [PubMed] [Google Scholar]
- 43. Kim T, Jeon YJ, Cui R, Lee JH, Peng Y, Kim SH, Tili E, Alder H, Croce CM (2015) Role of MYC‐regulated long noncoding RNAs in cell cycle regulation and tumorigenesis. J Natl Cancer Inst 107: dju505 [DOI] [PMC free article] [PubMed] [Google Scholar]
- 44. Xiang JF, Yin QF, Chen T, Zhang Y, Zhang XO, Wu Z, Zhang S, Wang HB, Ge J, Lu X et al (2014) Human colorectal cancer‐specific CCAT1‐L lncRNA regulates long‐range chromatin interactions at the MYC locus. Cell Res 24: 513–531 [DOI] [PMC free article] [PubMed] [Google Scholar]
- 45. Yang F, Xue X, Zheng L, Bi J, Zhou Y, Zhi K, Gu Y, Fang G (2014) Long non‐coding RNA GHET1 promotes gastric carcinoma cell proliferation by increasing c‐Myc mRNA stability. FEBS J 281: 802–813 [DOI] [PubMed] [Google Scholar]
- 46. Hu G, Lou Z, Gupta M (2014) The long non‐coding RNA GAS5 cooperates with the eukaryotic translation initiation factor 4E to regulate c‐Myc translation. PLoS ONE 9: e107016 [DOI] [PMC free article] [PubMed] [Google Scholar]
- 47. Prensner JR, Chen W, Han S, Iyer MK, Cao Q, Kothari V, Evans JR, Knudsen KE, Paulsen MT, Ljungman M et al (2014) The long non‐coding RNA PCAT‐1 promotes prostate cancer cell proliferation through cMyc. Neoplasia 16: 900–908 [DOI] [PMC free article] [PubMed] [Google Scholar]
- 48. Tseng YY, Moriarity BS, Gong W, Akiyama R, Tiwari A, Kawakami H, Ronning P, Reuland B, Guenther K, Beadnell TC et al (2014) PVT1 dependence in cancer with MYC copy‐number increase. Nature 512: 82–86 [DOI] [PMC free article] [PubMed] [Google Scholar]
- 49. Weinstein IB (2002) Cancer: addiction to oncogenes – the Achilles heal of cancer. Science 297: 63–64 [DOI] [PubMed] [Google Scholar]
- 50. Chen BJ, Wu YL, Tanaka Y, Zhang W (2014) Small molecules targeting c‐Myc oncogene: promising anti‐cancer therapeutics. Int J Biol Sci 10: 1084–1096 [DOI] [PMC free article] [PubMed] [Google Scholar]
- 51. Mitra SA, Mitra AP, Triche TJ (2012) A central role for long non‐coding RNA in cancer. Front Genet 3: 17 [DOI] [PMC free article] [PubMed] [Google Scholar]
- 52. Yang F, Zhang H, Mei Y, Wu M (2014) Reciprocal regulation of HIF‐1alpha and lincRNA‐p21 modulates the Warburg effect. Mol Cell 53: 88–100 [DOI] [PubMed] [Google Scholar]
Associated Data
This section collects any data citations, data availability statements, or supplementary materials included in this article.
Supplementary Materials
Expanded View Figures PDF
Table EV1
Dataset EV1
Review Process File