

Abstract
Background
Detailed information regarding plasma use in the United States is needed to identify opportunities for practice improvement and design of clinical trials of plasma therapy.
Study Design and Methods
Ten US hospitals collected detailed medical information from the electronic health records for 1 year (2010-2011) for all adult patients transfused with plasma.
Results
A total of 72,167 units of plasma were transfused in 19,596 doses to 9269 patients. The median dose of plasma was 2 units (interquartile range, 2-4; range 1-72); 15% of doses were 1 unit, and 45% were 2 units. When adjusted by patient body weight (kg), the median dose was 7.3 mL/kg (interquartile range, 5.5-12.0). The median pretransfusion international normalized ratio (INR) was 1.9 (25%-75% interquartile range, 1.6-2.6). A total of 22.5% of plasma transfusions were given to patients with an INR of less than 1.6 and 48.5% for an INR of 2.0 or more. The median posttransfusion INR was 1.6 (interquartile range, 1.4-2.0). Only 42% of plasma transfusions resulted in a posttransfusion INR of less than 1.6. Correction of INR increased as the plasma dose increased from 1 to 4 units (p < 0.001). There was no difference in the INR response to different types of plasma. The most common issue locations were general ward (38%) and intensive care unit (ICU; 42%).
Conclusion
This large database describing plasma utilization in the United States provides evidence for both inadequate dosing and unnecessary transfusion. Measures to improve plasma transfusion practice and clinical trials should be directed at patients on medical and surgical wards and in the ICU where plasma is most commonly used.
Plasma transfusion remains one of the most common patient therapies. The most recent survey of plasma use in the United States reported that 3.9 million units were transfused in 2011.1 The most common indications for plasma are reversal of coagulopathy in patients who are bleeding (therapeutic use) or those undergoing an invasive procedure (prophylactic use). Laboratory coagulopathy is most often defined by a prolongation of the prothrombin time, international normalized ratio (INR), or activated partial thromboplastin time. Increasingly intraoperative monitoring of whole blood hemostasis by thromboelastometry is being used as an indicator for plasma.2 Although the use of plasma is widespread, there are few data defining its appropriate use. Several reviews of published data3,4 have suggested a lack of demonstrable benefit of prophylactic or therapeutic plasma therapy in patients with mild to moderate coagulopathy. A recent AABB practice guideline5 developed using GRADE methodology reaffirmed that there is a lack of well-designed studies underpinning current plasma transfusion practice. Recent surveys of use in Canada6 and the United Kingdom7 indicate high rates of inappropriate use. Clinicians are generally familiar with fresh-frozen plasma (FFP), which is plasma frozen within 8 hours of phlebotomy. However, thawed plasma (TP) and plasma frozen within 24 hours of phlebotomy (PF24) now account for more than half of all plasma transfused.1 Once FFP or PF24 is thawed, it has a 24-hour outdate. Alternatively, after thawing, this plasma can be relabeled as TP and stored for up to 5 days at refrigerator temperatures. During storage of TP there is a moderate (30%-40%) decline in Factor (F)VIII and FV levels but all other coagulation factors remain at normal levels.8 This study was intended to define current plasma transfusion practices in 10 US hospitals to identify opportunities for practice improvement and inform the design of properly controlled clinical trials of plasma therapy.
Materials and Methods
The 10 US hospitals participating in this study were supported by the NHLBI Recipient Epidemiology and Donor Evaluation Study III (REDS-III) domestic program. REDS-III is a consortium of four hubs, each consisting of a blood center and two to four affiliated hospitals, a single central laboratory (Blood Systems Research Institute, San Francisco, CA), and a data coordinating center (RTI International, Raleigh, NC).9 Data were collected retrospectively and were restricted to the inpatient electronic data at each hospital. The data set consisted of detailed blood component information, patient demographics, and clinical and laboratory data from the blood bank and electronic health records (EHRs) from October 1, 2010, to September 30, 2011, for all adult patients transfused with plasma. Data included all CPT and ICD-9 procedure codes and all diagnostic codes associated with a hospitalization. Procedure codes included the date of the procedure but not the time. A plasma dose was defined as the total number of units given within 4 hours of a prior unit. An evaluable INR was defined as a pretransfusion INR result available within 8 hours of the start of a plasma transfusion episode and a posttransfusion INR results available within 8 hours after the last unit of that plasma transfusion episode was issued. Plasma given for therapeutic apheresis procedures was excluded from coagulation laboratory analyses. All data were deidentified and sent to the data coordinating center where they were compiled for analysis. Institutional review board approval was obtained at each institution and the coordinating center.
Statistical analysis
Descriptive statistics for continuous variables, such as INR, were presented as the mean with a standard deviation (SD). For skewed distributions we also presented the median with the interquartile range. We assessed differences in a continuous outcome among classes of a categorical predictor, such as INR versus number of units transfused, using a Kruskal-Wallis test where the distributions were skewed and a one-way analysis of variance where skew was minimal. If the Kruskal-Wallis test was significant, we used Dwass, Steel, Critchlow-Fligner pairwise comparison procedure to identify the differences that contributed to the overall effect. We considered p values of less than 0.05 to be significant. The analysis was conducted using computer software (SAS/STAT, Version 9.3, SAS Institute, Cary, NC).
Results
Patient characteristics
During the 1-year period 72,167 units of plasma were transfused in 19,596 doses to 9269 patients (58% men, 42% women). The mean age of the patients was 63.2 ± 16.6 years (Table 1). Overall, 7122 patients (77.3%) received at least one other type of blood component during the admission, most commonly red blood cells (RBCs; 71.3%; Table 1). The most common diagnoses observed in plasma recipients were hypertension, atrial fibrillation, acute hemorrhage, acute kidney failure, and coronary artery disease. Patients with multiple diagnostic codes could berepresented more than once inTable 1.The most common issue locations were general ward (38%) and intensive care unit (ICU; 42%). The operating room (OR) and emergency department accounted for only 11 and 4% of issue locations, respectively (Table 1). There were 22,783 invasive procedures performed on the same day that plasma was transfused. Placement of a vascular catheter was the most common non-OR procedure associated with plasma therapy. Other common non-OR procedures included upper gastrointestinal endoscopy with biopsy, paracentesis, thoracentesis, and bronchoscopy with biopsy. By far the most common operative procedure associated with plasma transfusion was cardiac surgery. Other intraoperative procedures included organ transplantation, spinal fusion, and colorectal resection. Patients who had multiple procedures could be represented more than once in Table 2.
Table 1. Patient characteristics and plasma issue locations.
| Patient characteristics (n = 9269) | |
|---|---|
| Sex (%), males/females | 58/42 |
| Age (years), mean ± SD | 63.2 ± 16.6 |
| Race (%), white/black/Asian | 82/13/2 |
| Ethnicity (%), Hispanic/non-Hispanic | 7/93 |
| Other blood components | % patients |
| RBCs | 71.3 [56,146 units] |
| Platelets | 42.4 [16,845 doses] |
| Cryoprecipitate | 12.4 [4,013 doses] |
| Any blood component other than plasma | 77.3 |
| Patient diagnosis | % patients |
| Essential hypertension | 33.0 |
| Atrial fibrillation | 25.6 |
| Acute posthemorrhagic anemia | 24.9 |
| Acute kidney failure | 20.8 |
| Hyperlipidemia | 19.7 |
| Coronary atherosclerosis | 18.5 |
| Acute respiratory failure | 16.9 |
| Esophageal reflux | 16.9 |
| Anemia, unspecified | 16.0 |
| Location where plasma was issued | % plasma doses |
| ICU | 42.3 |
| General ward | 37.6 |
| OR | 10.7 |
| Emergency department | 3.7 |
| Outpatient | 4.0 |
| Procedure suite | 0.8 |
Table 2. Most common patient procedures associated with plasma therapy.
| Non-OR procedures | Count | % of all procedures | OR procedures | Count | % of all procedures |
|---|---|---|---|---|---|
| Vascular catheter placement | 1402 | 8.0 | Cardiac surgery | 2415 | 13.8 |
| Upper gastrointestinal endoscopy | 434 | 2.5 | Organ transplantation | 340 | 1.9 |
| Paracentesis | 402 | 2.3 | Spine fusion | 335 | 1.9 |
| Thoracentesis | 358 | 2.1 | Partial bone excision | 224 | 1.3 |
| Bronchoscopy with biopsy | 330 | 1.9 | Colorectal resection | 188 | 1.0 |
Types of plasma transfused
The type of plasma transfused was captured by the ISBT or Codabar product code. A transfusable plasma product code was identified on 61,953 units (86% of all plasma units). TP derived from FFP (59%) or PF24 (7%) accounted for 66% of the plasma transfused, while FFP represented only 28% of the transfused plasma. Cryoprecipitate-poor plasma used for plasma exchange for thrombotic throm-bocytopenic purpura (TTP) accounted for the remaining 7% of plasma. Plasma derived from whole blood represented 83% of plasma, whereas 17% of plasma units were from apheresis collection. The effect of plasma types on INR response is described below.
Plasma dosing
Plasma dose calculations were limited to patients who received plasma for the treatment of a coagulopathy. Patients receiving plasma for therapeutic apheresis for TTP or atypical hemolytic uremic syndrome (aHUS) identified by having a CPT procedure code for therapeutic apheresis and/or having a diagnosis code of TTP or aHUS were excluded (n = 60). There were 18,818 (96%) plasma doses administered for treatment of a coagulopathy. The median dose of plasma was 2.0 units (interquartile range, 2.0-4.0; range, 1.0-72.0); the mean ± SD dose was 3.1 ± 3.0 units; and 15.2% of doses were 1.0 unit, 46.4% were 2.0 units, and 6.6% were 8.0 units or more (Fig. 1). Plasma doses were more commonly ordered as even numbers of 2 or 4 units. When adjusted by patient body weight (kg), 16,883 plasma doses were available for evaluation. The median weight-adjusted plasma dose was 7.3 mL/kg (interquartile range, 5.5-12.0), and the mean ± SD dose was 10.2 ± 10.0 mL/kg. Only 29% of doses were at least 10 mL/kg and only 15.5% were at least only 15 mL/kg (Fig. 2).
Fig. 1.
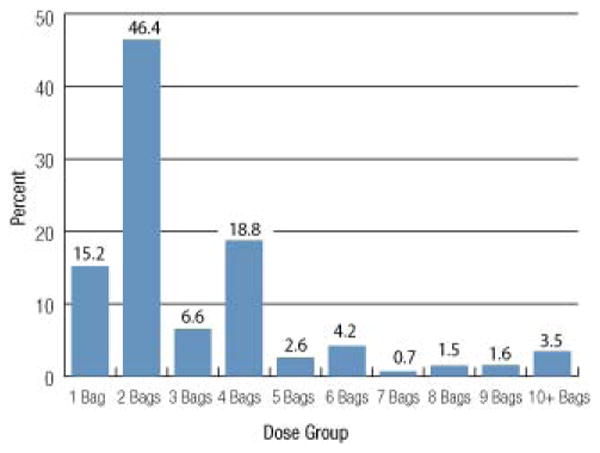
The distribution of plasma dose by number of units for 18,818 plasma doses is shown. A dose is defined as the total number of units given within 4 hours of a prior unit.The most commonly observed doses were even numbers of 2 or 4 units suggesting that physicians were not using a weight-based dosing strategy.
Fig. 2.
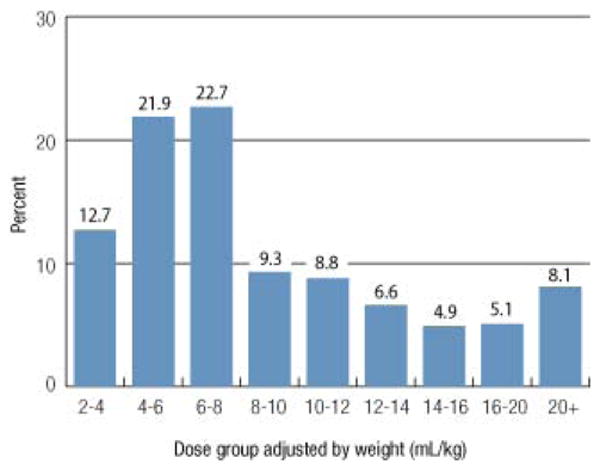
Plasma dosing adjusted by patient body weight (mL/kg) is shown for 16,883 plasma doses. Plasma volume was calculated by multiplying the number of units in the dose by the median plasma unit volume for that site. A total of 75% of the doses were less than the 10 to 20 mL/kg generally recommended therapeutic dose range for plasma.
Coagulation laboratory values
The pretransfusion INR was available on 13,318 plasma doses (71%) given for treatment of a coagulopathy. The median pretransfusion INR was 1.9 (interquartile range, 1.6-2.6), and the mean ± SD INR was 2.5 ± 1.7 (range, 0.7-21.1). Nearly one-quarter (22.5%) of plasma doses were given for an INR of less than 1.6 and 33% were given for an INR of 1.6 to 2.0. Thus more than half of all plasma transfusions were for an INR of less than or equal to 2.0 (Fig. 3). The mean ± SD INR sample drawn time was 3.0 ± 2.0 hours before issuing the first unit of the plasma transfusion episode.
Fig. 3.
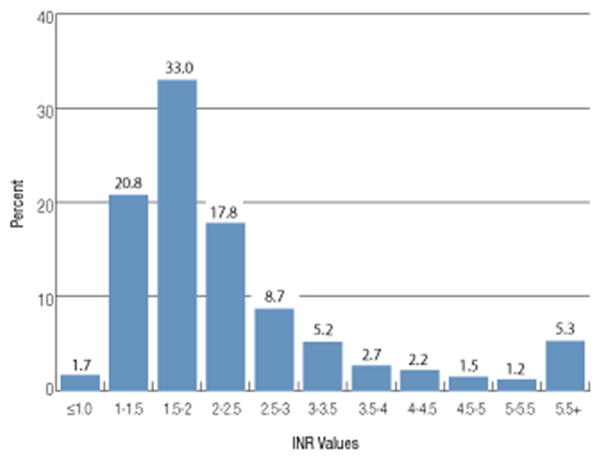
The distribution of pretransfusion INR values for 13,318 doses of plasma is shown. Plasma doses given for TTP or aHUS were excluded. The median pretransfusion INR was 1.9 (interquartile range, 1.6-2.6). Nearly one-quarter (22.5%) of plasma doses were given for an INR of not more than 1.5 and 33% were given for an INR of 1.6 to 2.0.
We assessed whether there was a relationship between the number of plasma units ordered and the degree of pretransfusion INR elevation using a case-control approach. Among the 1- (n = 2118), 2- (n = 6275), 3- (n = 837), and 4- (n = 2485) unit plasma doses the pretransfusion median INR value increased progressively 1.7, 1.9, 2.0, and 2.2, respectively (p < 0.001, Kruskal-Wallis test). All pairwise comparisons between plasma doses were significant (p < 0.001).
The posttransfusion INR was available on 13,253 plasma doses given for treatment of a coagulopathy. The median posttransfusion INR was 1.6 (interquartile range, 1.4-2.0), and the mean ± SD posttransfusion INR was 1.8 ± 0.7 (range, 0.7-19.3). The mean ± SD posttransfusion INR sample drawn time was 3.2 ± 1.9 hours after issuing the last unit of the plasma transfusion episode. Only 42% of plasma transfusions resulted in a posttransfusion INR of less than 1.6. Among the 1- (n = 1824), 2- (n = 5972), 3- (n = 911), and 4- (n = 2681) unit plasma doses, the posttransfusion median INR values were similar: 1.6, 1.6, 1.6, and 1.7, respectively (p = 0.088).
The change in the INR associated with plasma transfusion for treatment of coagulopathy is shown in Fig. 4. There were 9739 plasma doses with an evaluable pre- and posttransfusion INR value. The change in INR was calculated as the difference between pre- and posttransfusion values. Thus, a positive value indicates that the INR decreased after transfusion. The median change in INR value was 0.2 (interquartile range, 0.03-0.70; mean ± SD, 0.7 ± 1.5). Twenty-five percent of plasma transfusions resulted in no change or an increase in the INR value. Given the known intrasubject biologic variability of the INR assay, small decreases (and possibly also small increases) in the INR (on the order of ±0.1) may not be indicative of changes in coagulation but instead may reflect expected fluctuation around the patient's true INR value.10,11
Fig. 4.
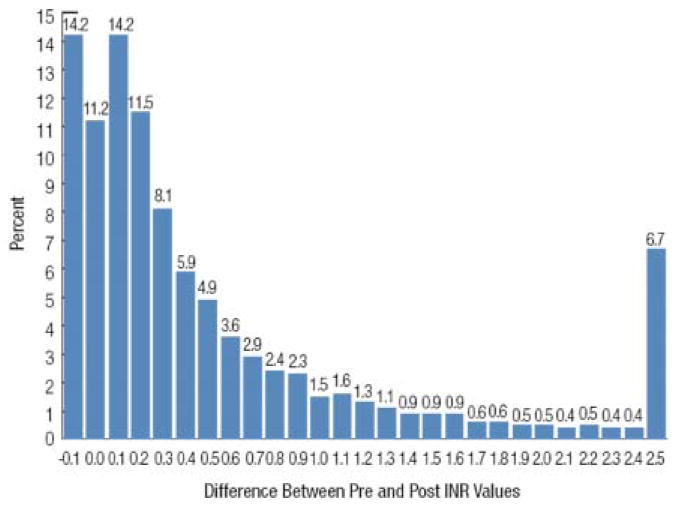
A histogram of changes in INR from before to after plasma transfusion is shown for 9739 evaluable plasma doses. An evaluable INR was defined as those available within 8 hours of the start of a plasma transfusion episode and within 8 hours after the last unit of plasma was issued. Thus, a positive value indicates that the INR decreased after transfusion. The median change in INR value was 0.20 (interquartile range, 0.03-0.70; mean ± SD 0.70 ± 1.50). Twenty-five percent of plasma transfusions resulted in no change or an increase in the INR value.
Among the 1408 (14.5%) transfusion episodes associated with an increase in INR, it was more likely that the pretransfusion INR was not more than 1.5 (35.6% experienced an increase in INR) versus 12.9% of those with a pretransfusion INR of 1.6 to 1.9 and 5.9% with an INR of 2.0 or more (p < 0.001). We assessed whether the plasma dose affected the magnitude of the INR change (Fig. 5). As expected, the magnitude of the correction of INR increased as the plasma dose increased from 1 to 4 units (p < 0.001). Because there were relatively fewer doses of plasma of 5, 6, or more units at a time, these were combined into a single category; the change in INR in this category was similar to that observed with a 4-unit dose.
Fig. 5.
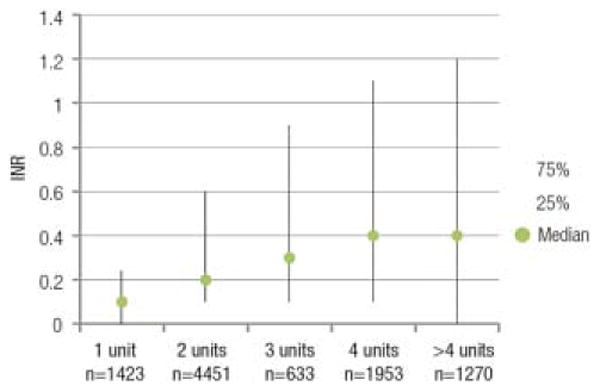
The effect of plasma dose on the magnitude of the INR change is shown. A dose effect was observed with greater correction of INR as the plasma dose increased from 1 to 4 units (p < 0.0001). There were relatively fewer doses of plasma of 5, 6, or more units at a time so these were combined into a single category.The change in INR in this category was similar to that observed with a 4-unit dose.
The effect of plasma dose on change in INR also depended on pretransfusion INR when pretransfusion INR was categorized into three groups as previously described. Change in INR varied with plasma dose when pretransfusion INR was 2.0 or more (p < 0.001) but not when pretransfusion INR was not more than 1.5 (p = 0.71) or in the range of 1.6 to 2.0 (p = 0.73).
We analyzed the INR response to plasma by type of plasma transfused including only plasma transfusion episodes that were exclusively one type of plasma and had an evaluable pre- and posttransfusion INR (Table 3). When adjusting for the pretransfusion INR and dose of plasma given, there was no difference in the INR response to FFP versus TP versus PF24 (p = 0.66).
Table 3. Effect of different plasma types on INR response.
| Transfusion episodes | FFP (n = 3806) |
PF24 (n = 405) |
TP (n = 2756) |
|---|---|---|---|
| Dose (units) | |||
| Mean | 2.7 | 2.2 | 2.6 |
| Median | 2.0 | 2.0 | 2.0 |
| Pretransfusion INR | |||
| Mean | 2.4 | 2.5 | 2.4 |
| Median | 1.9 | 1.9 | 1.9 |
| Change in INR (decrease) | |||
| Mean* | 0.6 | 0.6 | 0.6 |
| Median | 0.2 | 0.2 | 0.2 |
p = 0.66 for change in INR by plasma type adjusted for pretransfusion INR and dose of plasma.
Discussion
This epidemiologic study included more than 72,000 units of plasma transfused in 10 US hospitals over a 1-year period, representing approximately 1.9% of annual US plasma transfusions. These hospitals served patient populations with a breadth of medical and surgical conditions that utilize plasma and all utilized sophisticated EHRs, which provided a rich source of demographic, clinical, and laboratory data. The study database was used to develop a picture of current plasma transfusion practice in adults. We found that a high proportion (77%) of plasma recipients also receive other blood components, most commonly RBCs, suggesting that coagulopathy requiring plasma is often accompanied by bleeding requiring RBCs. The reported ICD-9 diagnostic codes in these patients support this observation with posthemorrhagic anemia representing the third most common diagnosis. Atrial fibrillation (the second most common diagnosis) is commonly associated with warfarin anticoagulation. Plasma is given for prompt reversal in such patients who have major bleeding or require an urgent invasive procedure. Documentation of receipt of warfarin was found in 34.8% of plasma transfusion episodes in this study. The absence of liver disease as a commonly associated diagnosis (ranked 23rd most common) is likely due to the capture of patient diagnostic codes as opposed to the indication for the plasma transfusion, which was not readily available in the EHR. One aim of the study was to define the locations where plasma is used so as to identify where resources to optimize practice should be directed as well as to identify where to find patients for enrollment in clinical studies. Surprisingly, critical care units and general medical and surgical wards represented the locations where 80% of the plasma was issued. The non-OR procedures performed in these locations accounted for the most common procedures we found associated with plasma including vascular catheter placement, thoracentesis, and paracentesis. Procedure suites were another common location for plasma use for these procedures. These data show that practice improvement and clinical studies should focus on non-OR locations where 80% of plasma is used.
Clinicians who order plasma do not appear to differentiate between types of plasma. The most recent NBCUS survey in 2011 noted that TP and PF24 accounted for the majority of plasma use.1 We found the same practice among the hospitals in our database with more than half of plasma transfused in the form of TP. The increasing popularity of TP is related to the inventory management advantages of rapid availability, which is achieved by being able to thaw the plasma in advance of orders and knowing that units can be stored for up to 5 days at refrigerator temperature.12 Prolonged TP storage also reduces plasma wastage. These data demonstrate the widespread adoption of TP as an alternative to FFP or PF24. Our data show that there was no difference in the laboratory response, based on INR, to the different types of plasma. This is reassuring; however, differences in clinical outcomes were not studied.
Important clinical questions regarding plasma therapy include the optimal dose of plasma and the appropriate indications for plasma. One goal of this study was to define current dosing practices and the laboratory (INR) response to plasma. Previous studies have reported that the typical adult dose of plasma in clinical practice is 1 to 2 units (<10 mL/kg) and such doses usually do not correct the INR to less than 1.5.13,14 Chowdhury and colleagues15 showed that doses of 10 to 15 mL/kg resulted in only small (i.e., 10%-15%) increments in coagulation factor levels compared to patients who received 30 mL/kg who experienced complete correction of factor levels. Dara and coworkers16 studied 115 consecutive ICU patients and found that those who corrected their INR to less than 1.5 received 17 mL/kg plasma versus 10 mL/kg for those who did not correct their INRs. Although these studies, now more than 5 years old, clearly showed that less than 10 mL/kg plasma results in inadequate INR correction, our data continue to demonstrate suboptimal plasma dosing. Among nearly 20,000 plasma doses transfused in 2010 to 2011, the median plasma dose was 2 units with 15% of plasma doses of 1 unit. When viewed on a weight-adjusted basis, the practice of inadequate dosing is even more striking in that the median weight-adjusted dose was only 7.3 mL/kg and only 15.5% of doses were at least 15 mL/kg.We also found that clinicians order plasma most commonly in multiples of 2, further demonstrating that rational weight-based dosing strategies are not routinely employed. Not surprisingly, we confirmed prior studies showing that 1 and 2 units of plasma result in minimal changes in INR and that a dose effect is observed with greater correction when transfusing 3 and 4 units of plasma (Figs. 4 and 5).
The use of plasma to correct an abnormal INR is predicated on the assumption that a prolonged INR is associated with an increased risk of bleeding and that plasma therapy will correct the INR. We and others have previously demonstrated that the doses of plasma most commonly used are inadequate to effect INR correction. A review by Segal and colleagues3 shows that modest prolongations of the INR are not associated with an increased risk of bleeding, at least in minor invasive procedures. Despite these data we found that clinicians continue to order plasma for minor prolongations in INR with 22.5% of plasma orders given for an INR of less than 1.6 and for minor procedures that is, vascular catheter placement.
Another 33% of plasma doses were given for INR of 1.6 to 2.0. Data supporting the need for plasma to correct an INR of 1.6 to 2.0 are lacking. Yang and coworkers4 performed a review of 80 randomized controlled trials of plasma transfusion conducted between 2002 and 2011 and found a lack of consistent evidence for clinical benefit of prophylactic or therapeutic use of plasma; they also identified significant methodologic problems with many of these studies. A recent AABB guideline similarly found that there were inadequate clinical data to recommend plasma transfusion with the exception of plasma use in the setting of massive transfusion.5
There are limitations to this observational study. The REDS-III hospitals were selected because of the strength of their EHR. Although they are composed of a mixture of academic medical centers, large community hospitals, and small to medium community hospitals they are not necessarily representative of all US hospitals. Thus the practices reported here may differ from those in other institutions. Second, a retrospective review of even a sophisticated EHR results in some missing data. For example CPT and ICD-9 procedure codes include the date but not the time of the procedure. This creates uncertainty with regard to the timing relationship between transfusion, laboratory studies, and the procedure.We found that the start and stop time of the transfusion is electronically captured in a minority of hospitals. Although the start time is not always available, the product issue time is consistently recorded and can be used as a surrogate. There are also some pertinent laboratory studies such as thromboelastometry tracings (TEG, ROTEM), which are not available in an electronic format. We used an 8-hour window to define relevant pre- and posttransfusion INR values. The half-life of FVII is 6 hours so it is possible that in some cases the INR correction would have been greater if it had been measured closer to the plasma transfusion. We believe that this is a minor issue because the median pre- and posttransfusion INR measurement interval was approximately 3 hours. Finally, it is diffcult to glean a reliable indication for the plasma from the EHR. We explored changes in hemoglobin levels as a surrogate for bleeding but found that variablity was too large to be informative. Capturing the indication for plasma and other blood components as part of the electronic ordering process would greatly facilitate future study. Despite these limitations, the large number of plasma units and patients transfused, and the voluminous data that were available from the EHR provided valuable information on current transfusion practice.
Our goal in this study was not to define the appropriate indications for plasma, but to show the prevalence of non–evidence-based clinical practices and define the opportunity for practice improvement in terms of optimzing plasma dosing (i.e., both underdosing and unnecessary transfusion). We showed that the opportunities for practice improvement are clear and substantial. In particular, practice changes should be initiated promptly to eliminate plasma transfusions for INR of less than 1.6 and to discourage doses of 1 to 2 units of plasma since existing clinical data provide sufficient evidence to eliminate such practices. Our findings are not unique to the United States as recent reviews of plasma transfusion practice in Canada6 and the United Kingdom7 reported similar rates of inappropriate use. The results of this study also underscore the need for properly designed clinical trials to address plasma transfusions for INR of 1.6 to 2.0 or higher and provide data to inform the design for such trials.
Abbreviations
- aHUS
atypical hemolytic uremic syndrome
- HER(s)
electronic health record(s)
- ICU
intensive care unit
- INR
international normalized ratio
- OR
operating room
- PF24
plasma frozen within 24 hours
- TP
thawed plasma
- TTP
thrombotic thrombocytopenic purpura
Footnotes
Conflict of Interest: DK discloses that he serves as a paid consultant to NIH for the REDS-III program. The rest of the authors have disclosed no conflicts of interest.
References
- 1.US Department of Health and Human Services. The 2011 national blood collection and utilization survey. [cited 2014 Dec 15];2011 Available from: http://www.hhs.gov/ash/bloodsafety/2011-nbcus.pdf.
- 2.Bollinger D, Seeberger MD, Tanaka KA. Principles and practice of thromboelastography in clinical coagulation management and transfusion practice. Transfus Med Rev. 2012;26:1–13. doi: 10.1016/j.tmrv.2011.07.005. [DOI] [PubMed] [Google Scholar]
- 3.Segal JB, Dzik WH ransfusion Medicine/Hemostasis Clinical Trials Network. Paucity of studies to support that abnormal coagulation test results predict bleeding in the setting of invasive procedures: an evidence-based review. Transfusion. 2005;45:1413–25. doi: 10.1111/j.1537-2995.2005.00546.x. [DOI] [PubMed] [Google Scholar]
- 4.Yang L, Stanworth S, Hopewell S, et al. Is fresh-frozen plasma clinically effective? An update of a systematic review of randomized controlled trials Transfusion. 2012;52:1673–86. doi: 10.1111/j.1537-2995.2011.03515.x. [DOI] [PubMed] [Google Scholar]
- 5.Roback JD, Caldwell S, Carson J, et al. Evidence-based practice guidelines for plasma transfusions. Transfusion. 2010;50:1227–39. doi: 10.1111/j.1537-2995.2010.02632.x. [DOI] [PubMed] [Google Scholar]
- 6.Tinmouth A, Thompson T, Arnold DM, et al. Utilization of frozen plasma in Ontario: a provincewide audit reveals a high rate of inappropriate transfusions. Transfusion. 2013;53:2222–9. doi: 10.1111/trf.12231. [DOI] [PubMed] [Google Scholar]
- 7.Stanworth SJ, Grant-Casey J, Lowe D, et al. The use of fresh-frozen plasma in England: high levels of inappropriate use in adults and children. Transfusion. 2011;51:62–70. doi: 10.1111/j.1537-2995.2010.02798.x. [DOI] [PubMed] [Google Scholar]
- 8.Tholpady A, Monson J, Radovancevic R, et al. Analysis of prolonged storage on coagulation Factor (F)V, VII, and FVIII in thawed plasma: is it time to extend the expiration date beyond 5 days? Transfusion. 2013;53:645–50. doi: 10.1111/j.1537-2995.2012.03786.x. [DOI] [PubMed] [Google Scholar]
- 9.Kleinman S, King MR, Busch MP, et al. National Heart Lung Blood Institute Recipient Epidemiology and Donor Evaluation Study (REDS-III): a research program striving to improve blood donor and transfusion recipient outcomes. Transfusion. 2014;54(3 Pt 2):942–55. doi: 10.1111/trf.12468. [DOI] [PMC free article] [PubMed] [Google Scholar]
- 10.van Geest-Daalderop JH, Kraaijenhagen RJ, van der Meer FJ, et al. Intraindividual variation of the international normalized ratio in patients monitored with a recombinant human thromboplastin. JThromb Haemost. 2010;8:1641–2. doi: 10.1111/j.1538-7836.2010.03881.x. [DOI] [PubMed] [Google Scholar]
- 11.Kjeldsen J, Lassen JF, Petersen PH, et al. Biological variation of international normalized ratio for prothrombin times, and consequences in monitoring oral anticoagulant therapy: computer simulation of serial measurements with goal-setting for analytical quality. Clin Chem. 1997;43:2175–82. [PubMed] [Google Scholar]
- 12.Mehr CR, Gupta R, von Recklinghausen FM, et al. Blanacing risk and benfit: maintenance of a thawed Group A plasma inventory for trauma patients requiring massive transfusion. J Trauma Acute Care Surg. 2013;74:1425–31. doi: 10.1097/TA.0b013e31828b813e. [DOI] [PubMed] [Google Scholar]
- 13.Adbel-Wahab OI, Healy B, Dzik WH. Effect of fresh-frozen plasma transfusion on prothrombin time and bleeding in patients with mild coagulation abnormalities. Transfusion. 2006;46:1279–85. doi: 10.1111/j.1537-2995.2006.00891.x. [DOI] [PubMed] [Google Scholar]
- 14.Sadek I. Fresh-frozen plasma transfusions in patients with mild coagulation abnormalities at a large Canadian transfusion center. Transfusion. 2007;47:748. doi: 10.1111/j.1537-2995.2007.01180.x. [DOI] [PubMed] [Google Scholar]
- 15.Chowdhury P, Saayman AG, Paulus U, et al. Efficacy of standard dose and 30 ml/kg fresh frozen plasma in correcting laboratory parameters of haemostasis in critically ill patients. Br J Haematol. 2004;125:69–73. doi: 10.1111/j.1365-2141.2004.04868.x. [DOI] [PubMed] [Google Scholar]
- 16.Dara SI, Rana R, Afessa B, et al. Fresh frozen plasma transfusion in critically ill medical patients with coagulopathy. Crit Care Med. 2005;33:2667–71. doi: 10.1097/01.ccm.0000186745.53059.f0. [DOI] [PubMed] [Google Scholar]