Abstract
Fitness landscapes1,2, depictions of how genotypes manifest at the phenotypic level, form the basis for our understanding of many areas of biology2–7 yet their properties remain elusive. Studies addressing this issue often consider specific genes and their function as proxy for fitness2,4, experimentally assessing the impact on function of single mutations and their combinations in a specific sequence2,5,8–15 or in different sequences2,3,5,16–18. However, systematic high-throughput studies of the local fitness landscape of an entire protein have not yet been reported. Here, we chart an extensive region of the local fitness landscape of the green fluorescent protein from Aequorea victoria (avGFP) by measuring the native function, fluorescence, of tens of thousands of derivative genotypes of avGFP. We find that its fitness landscape is narrow, with half of genotypes with two mutations showing reduced fluorescence and half of genotypes with five mutations being completely non-fluorescent. The narrowness is enhanced by epistasis, which was detected in up to 30% of genotypes with multiple mutations arising mostly through the cumulative impact of slightly deleterious mutations causing a threshold-like decrease of protein stability and concomitant loss of fluorescence. A model of orthologous sequence divergence spanning hundreds of millions of years predicted the extent of epistasis in our data, indicating congruence between the fitness landscape properties at the local and global scales. The characterization of the local fitness landscape of avGFP has important implications for a number of fields including molecular evolution, population genetics and protein design.
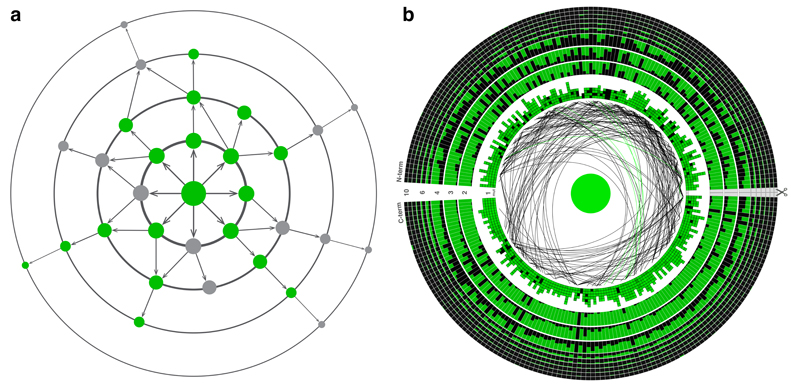
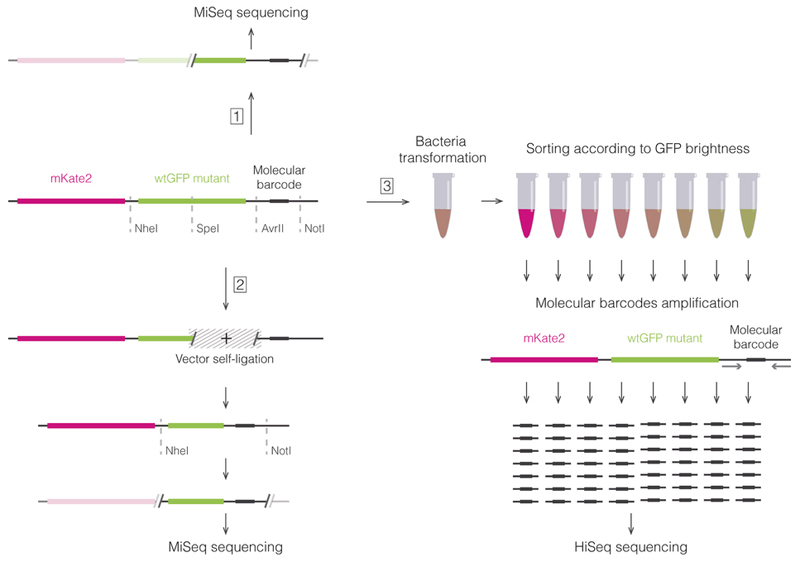
We assayed the local fitness landscape of avGFP by estimating fluorescence levels of genotypes obtained by random mutagenesis of the avGFP sequence (Figure 1). We used fluorescence-activated cell sorting and sequenced the entire GFP coding region to assay the fluorescence of many thousands of genotypes created by random mutagenesis of the wildtype sequence (Supplementary Information S2 and Extended Data Fig. 1). We applied several strategies to minimize the error of our estimate of fluorescence (Supplementary Information S3.4 and S4.4), which was estimated from thousands of independent measurements of the wildtype sequence (false negative error rate 0.08%) and genotypes incorporating mutations known to eliminate fluorescence (false positive error rate 0.24%). Our final dataset included 56,086 unique nucleotide sequences coding for 51,715 different protein sequences. Our procedure introduced an average of 3.7 mutations per gene sequence, and the majority of assayed genotypes contained several, up to 15, missense mutations. Still, since the total number of possible sequences grows exponentially with the number of mutations, the fraction of sampled sequences was tiny for sequences containing more than two mutations (Extended Data Table 1). We used these data to survey the local fitness landscape of GFP analyzing the impact of single, double, and multiple mutations.
Figure 1. Exploring the local fitness landscape.
a, Wildtype avGFP (centre) and most single mutants (innermost circle) fluoresce in green. Genotypes with multiple mutations may exhibit negative epistasis, with combinations of neutral mutations creating non-fluorescent phenotypes (grey), or positive epistasis, whereby a mutation in a non-fluorescent genotype restores fluorescence. b, The GFP sequence arranged in a circle, each column representing one amino acid site. In the first circle, the colour intensity of the squares indicates the brightness of a single mutation at the corresponding site relative to the wildtype, shown in the centre. Sites with positive and negative epistatic interactions between pairs of mutations are connected by green and black lines, respectively. In circles further away from the centre, representing genotypes with multiple mutations, the fraction of the column coloured green (black) representing the fraction of genotypes corresponding to high (low) fluorescence from among all assayed genotypes with a mutation at that site. Scissors indicate the restriction site.
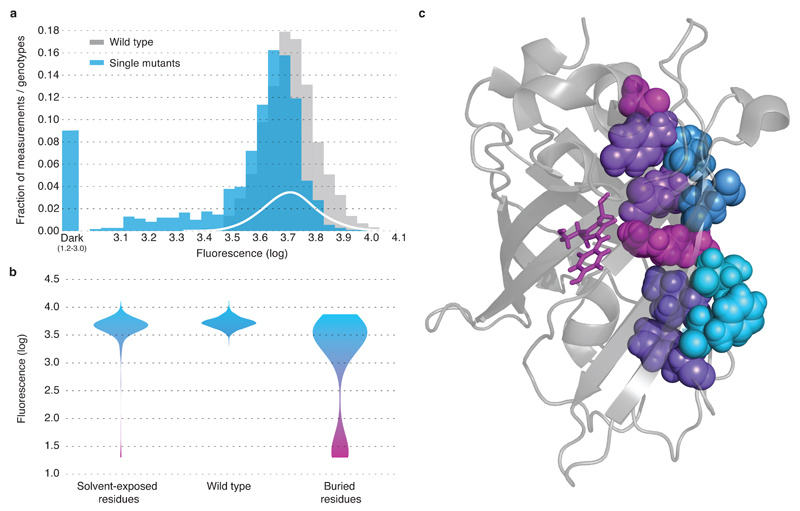
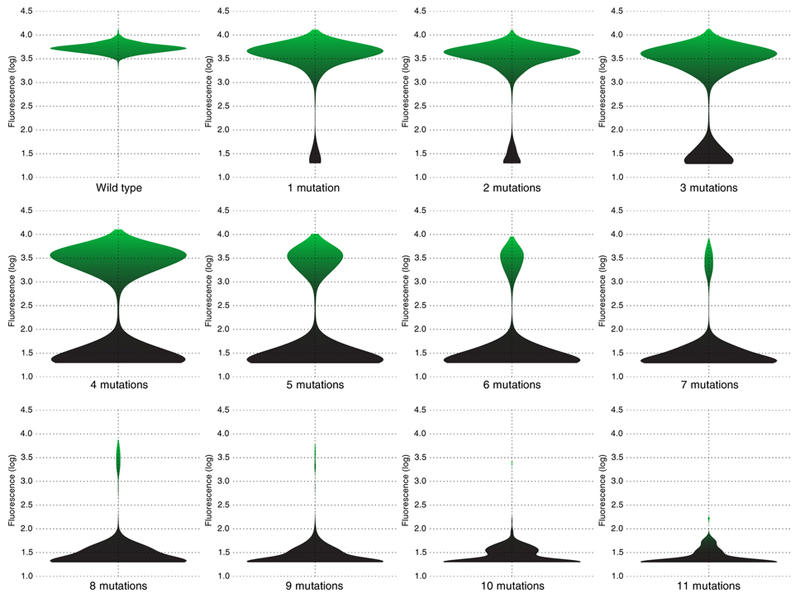
The distribution of fitness effects of individual missense mutations was assayed by comparing the distribution of fluorescence of wildtype avGFP amino acid sequences, tagged by different molecular barcodes, and the distribution of fluorescence of sequences carrying a single mutation (Supplementary Information S4.1). We found that at least 75% of mutations had a deleterious effect on fluorescence, including 9.4% of single mutations conferring a >5-fold decrease of fluorescence, but for many mutations the effect was small (Figure 2a). Accordingly, genotypes with multiple missense mutations were more likely to have low fluorescence and the majority of genotypes carrying five or more missense mutations were non-fluorescent (Extended Data Fig. 2). Mutations with a strong effect on fluorescence preferably resided at sites that coded for amino acid residues oriented internally towards the chromophore (Figure 2b,c), which is consistent with data on other proteins on the preference of deleterious mutations to target buried residues9,11–13. Impact of mutations on fluorescence were positively correlated with site conservation (Extended Data Fig. 3a, Spearman’s rank correlation coefficient 0.40±1.44 × 10⁻¹⁰) and less likely to be found in orthologous sequences (Extended Data Fig. 3b). Still, ~10% of mutant states conferring a non-fluorescent phenotype were nevertheless fixed in long-term evolution (Extended Data Fig. 3b), indicating that epistasis affects the avGFP fitness landscape16.
Figure 2. The effect of single mutations on avGFP.
a, The distributions of fluorescence for independently measured 2442 wildtype sequences (grey), for 1114 single mutations (blue) and the estimated fraction of neutral mutations (white). b, Single missense mutations strongly influencing fluorescence (violet) tended to occur at sites with an internally-oriented residues, c, shown on a selected beta-strand of the GFP structure.
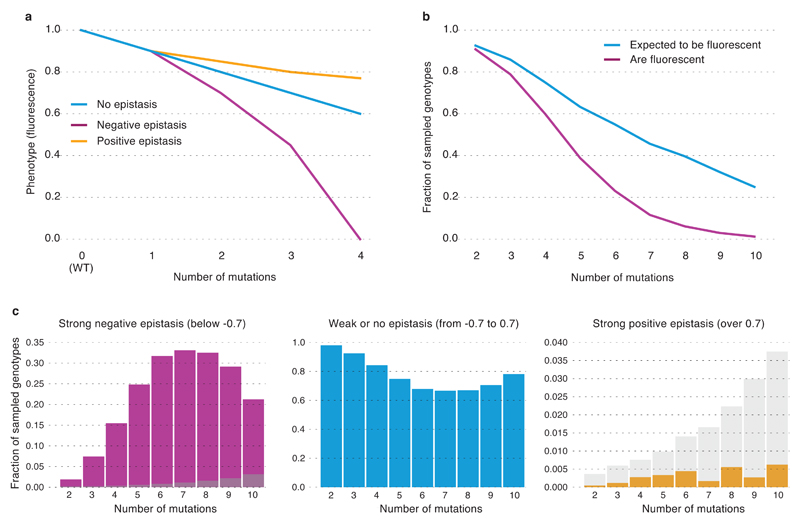
Figure 3. Prevalence of epistasis in the local fitness landscape of avGFP.
a, A hypothetical representation of negative and positive epistasis as a function of the number of single mutations from avGFP. b,The fraction of observed non-fluorescent genotypes (red) and the expected fraction of non-fluorescent genotypes calculated as the sum of the log-impact on fluorescence of individual mutations (blue). c, The distributions of epistasis for negative and positive epistasis of different strength, with expected false discovery rate shown in grey.
Interaction of deleterious mutations can manifest in positive epistasis, when the joint effect of mutations is weaker than their independent contribution, or negative epistasis when the joint effect is stronger (Figure 3a). Light intensity is perceived in the logarithmic scale by living beings, including jellyfish19. Thus, we defined epistasis e as the deviation from additivity of effects of single mutations on the logarithmic scale. We compared the decrement of the log-fluorescence of a multiple mutant Fmult to the sum of decrements of individual mutants, such that e = (Fmult − Fwt) − Σi(Fi − Fwt), where Fwt and Fi are the fluorescence log-values conferred by avGFP and avGFP with the i-th single missense mutation, respectively. We restricted the expected fluorescence of the multiple mutant Σi(Fi − Fwt) to the observed maximum or minimum levels (Supplementary Information S4.2). This eliminated spurious detection of epistasis, which could otherwise occur, for example, when a non-fluorescent double mutant consists of two mutations, both of which individually confer a non-fluorescent genotype. We defined strong epistasis as |e| > 0.7, or as cases where the observed fluorescence differed from the expected by at least fivefold, with a false discovery rate of < 1% (Supplementary Figure 1).
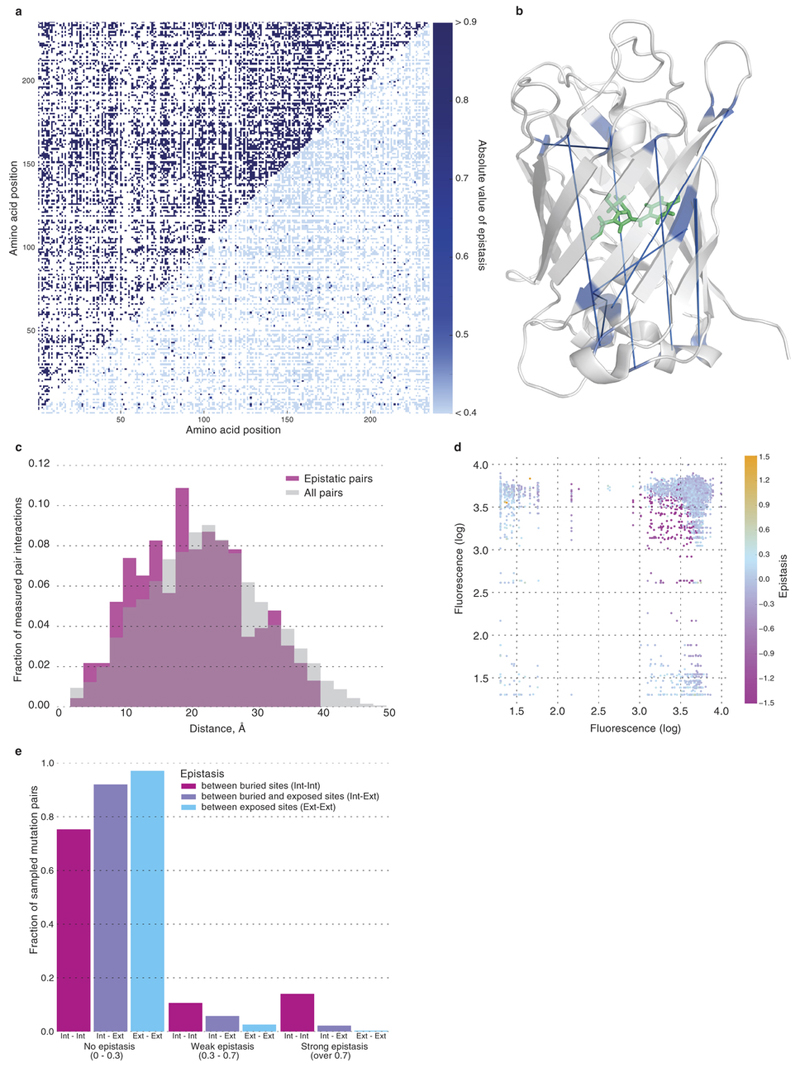
Negative epistasis affected up to 30% of all genotypes, depending on the number of mutations (Figure 3b,c), which resulted in a larger than expected fraction of non-fluorescent genotypes (Figure 3c). Genotypes carrying more than seven mutations showed a decrease in the prevalence of negative epistasis because many genotypes carrying multiple mutations were expected to lose fluorescence even without epistasis (Figure 3b). Positive epistasis was rare in avGFP, on the order of accuracy of our method. We sampled ~2% of all pairs of mutations (Extended Data Table 1) assaying 30% pairs of amino acid sites (16,898 out of 55,696, Extended Data Fig. 4a). Epistatic pairs of sites were located across the avGFP sequence (Extended Data Fig. 4a), mostly beyond the range of direct physical interaction of amino acid residues (Extended Data Fig. 4b) but marginally closer together than random (Extended Data Fig. 4c, p < 0.0004, Mann-Whitney U-test). Epistasis was found among 96% of mutations with weak effect (Extended Data Fig. 4d), suggesting that their joint effect brings the protein over some stability margin8,20. Finally, epistasis was more common between pairs of sites where both residues are internally oriented (Extended Data Fig. 4e). Taken together, these data indicate that epistasis was more common at functionally important sites.
In a unidimensional landscape fitness is a monotonic function of an intermediate variable, called fitness potential21,22, which is the sum of impacts of individual mutations. We used multiple regression considering a non-epistatic fitness function whereby log-fluorescence, F, is equal to the linear predictor, the fitness potential, p, such that F=f(p)=p. This simplest, non-epistatic model explained only 70% of the initial sample variance (σ2=1.12 and σ2=0.34 before and after the application of the model, respectively). Using the variance of the 2442 wildtype fluorescence measurements we estimated that ~1% of the initial sample variance can be attributed to noise (σ2=0.0097), indicating that the remaining 29% of sample variance cannot be explained without epistasis.
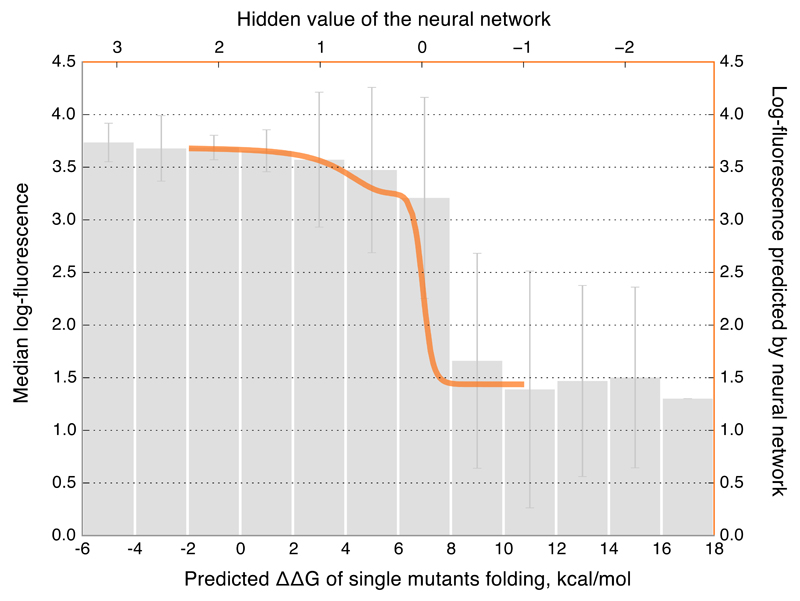
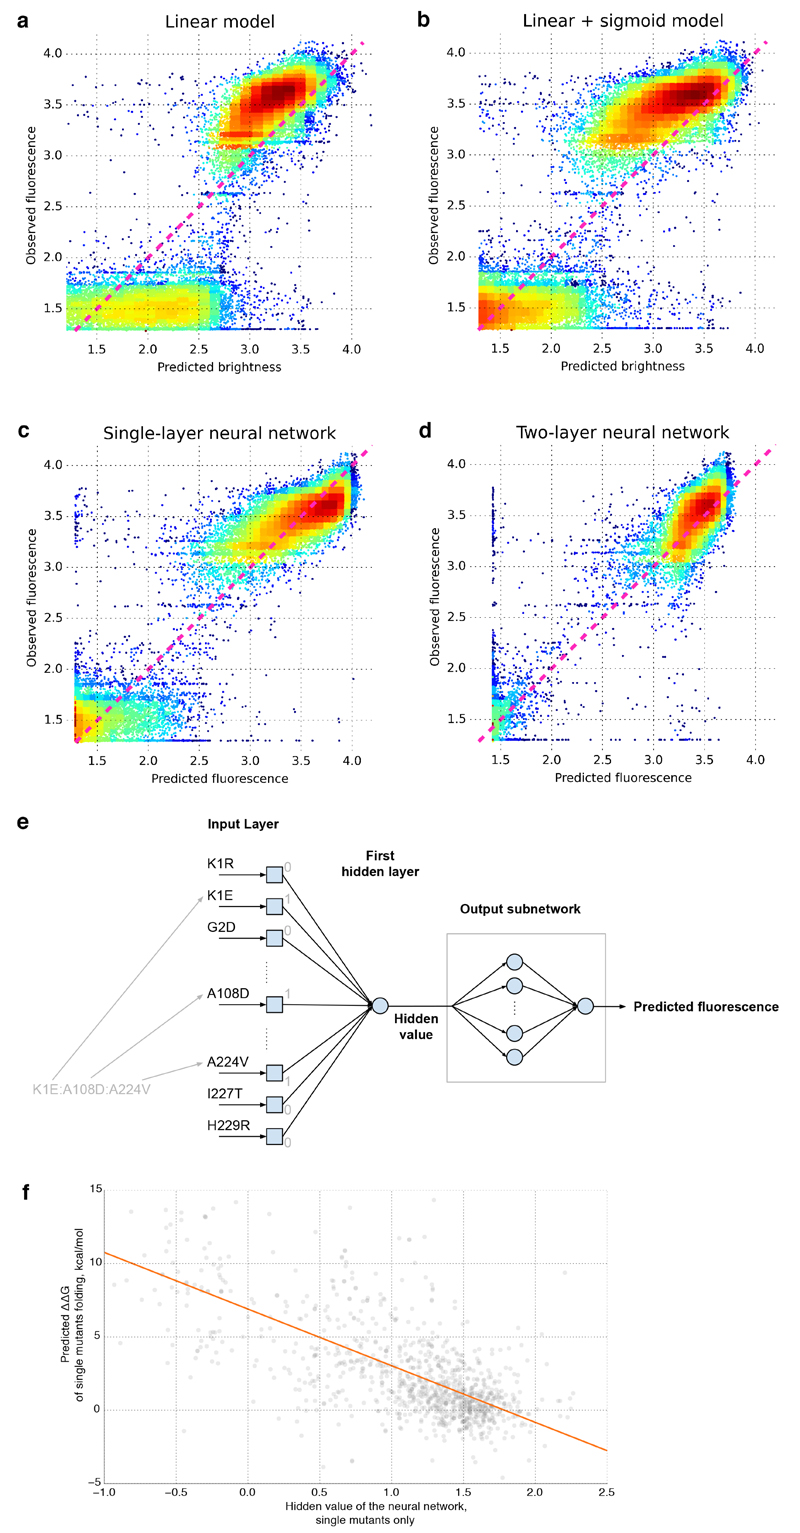
The simplest form of an epistatic fitness function is when fitness is a monotonic non-linear function of p21,22. The lack of genotypes with intermediate fluorescence (Extended Data Fig. 5a) suggests that the avGFP fitneses landscape can be described by a truncation-like fitness function23. We, therefore, modeled F as a sigmoid function of p, which explained 85% of the initial sample variance (σ2 = 0.17). A more complex sigmoid-shaped fitness function refined with a neural network approach (Supplementary Information S4.6) explained 93.5% of the initial sample variance (σ2 = 0.065, Extended Data Fig. 5), confirming that the fitness landscape can mostly be represented by a unidimensional threshold function (Figure 4), which can arise from the joint contribution of mutations to protein stability8,13,14,20,24. The average fluorescence of single mutants of avGFP as a function of the predicted protein destabilization, ΔΔG, reveals a threshold around 7–9 kcal/mol (Figure 4). Interestingly, the hidden value found by the artificial neural network for single mutants correlated to the predicted ΔΔG (Figure 4, Extended Data Fig. 5f), confirming a likely influence of protein stability on the nature of epistasis in avGFP. The threshold fitness function does a remarkably good job in approximating the entire fitness landscape explaining ~95% of all variance. However, when taking into account the error rate of our dataset we estimate that at least 0.3% of genotypes cannot be explained by the threshold fitness function (Supplementary Information S4.5 and Extended Data Fig. 5d) representing instances of multidimensional epistasis2,5,7.
Figure 4. Modeling genotype to phenotype relationship.
Median fluorescence of GFP with single mutations as a function of their effect on predicted folding energy (∆∆G), with SD, overlaid with the independently obtained sigmoid-like fitness function predicted by the neural network (orange line).
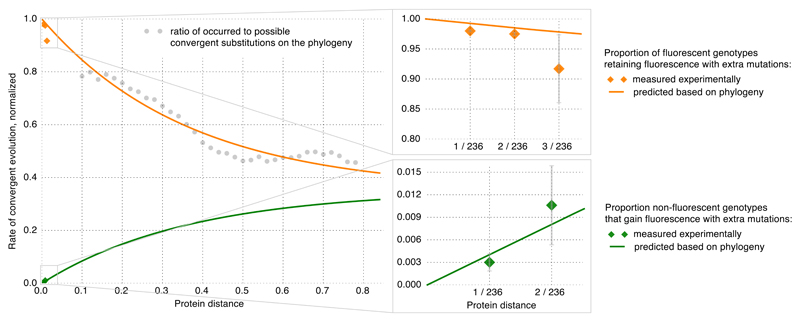
We compared the local avGFP fitness peak to the global GFP fitness landscape using sequences of GFP orthologues. Negative, threshold-like epistasis, leading to truncation selection23 against slightly deleterious mutations may prevent their accumulation in evolution25,26. Thus, we compared the fraction of neutral single mutations to the rate of nonsynonymous and synonymous evolution (dN/dS), a proxy for the average strength of selection. The average dN/dS across a broad phylogenetic range was 0.35 ± 0.1 (st. dev.) and 0.17 when avGFP was compared to the orthologue from the closest fluorescent relative A. macrodactyla. These measurements are similar to the estimated proportion of neutral mutations in avGFP (0.23) suggesting that the proportion of neutral mutations is similar across distant fitness peaks. The rate at which the phenotypic impact of amino acid substitutions changes across evolution, which is reflected in the changing rate of convergent evolution across the phylogenetic tree27,28, can be used to model the prevalence of epistasis with the fitness matrix model28. This model approximates the prevalence of epistasis as the proportion of amino acid mutations that dramatically change their impact on fitness after the occurrence of substitutions at other sites (Supplementary Information S5). Applying the fitness matrix model to the GFP multiple alignment we predicted the proportion of mutations that change their effects on fluorescence when found in a different genetic background, revealing prevalence of positive and negative epistasis, which concur with our experimental observations (Figure 5, Supplementary Figure 2). The congruence of the data from an evolutionary trajectory spanning hundreds of millions of years with experimental data is remarkable, suggesting similarity in the local and global structures of the fitness landscape shaped by strong epistatic interactions.
Figure 5. The fitness matrix model of GFP long-term evolution.
The normalized rate of convergent evolution to terminal and reconstructed ancestral amino acid states for each distance bin (grey dots). The expected (orange line) and observed in experimental data (orange dots) probability that a single mutation remains fluorescent as the sequence accumulates other substitutions. The expected (green line) and observed (green dots) probability that a non-fluorescent mutation becomes fluorescent with sequence divergence. Bars represent a binomial proportion confidence interval (confidence level 68%).
Our study provides complementary results of the analysis of single and double mutations to several previous studies9,11–14 and a novel depiction of a large segment of the fitness landscape of a single protein. The proportion of neutral single mutations in our data was similar to that observed when fitness was assayed directly or through competition experiments10,24,29 but substantially lower than that observed in functional studies4,10,11,13,17. Furthermore, the propensity of multiple mutations to have a stronger negative effect on fitness than the sum of individual mutation effects has been observed9,10,12,14. However, because our analysis considered genotypes carrying multiple mutations, we infer a wider picture of the local fitness landscape (Supplementary Video 1). The avGFP fitness peak is narrow and defined by negative epistasis, best described by truncation selection where fluorescence is eliminated if the joint effect of mutations exceeds a threshold of an intermediate property, possibly protein stability8,20. Such a landscape increases the efficacy of selection against slightly deleterious mutations23, preventing their accumulation in evolution25,26. Simultaneously, the fitness landscape is approximately non-epistatic near the fitness peak. If other proteins have a similar fitness landscape it would support the nearly-neutral theory of evolution30 explaining the selective forces and evolutionary dynamics of mutations with negligible individual effects on fitness.
The broad congruence of our data with the prevalence of epistasis from long-term evolution suggests that the shape of the local fitness landscape can be extrapolated to a larger scale. Yet, epistasis between sites coding for residues with a direct interaction in protein structure was rare, contrasting with observation of such instances in long-term evolution16 and a mutation assay of the RRM domain12. Thus, the local fitness landscape spanning a few mutations from a single fitness peak may be approximated by a unidimensional threshold fitness potential function, however, this simple fitness function may not be appropriate to describe fitness landscapes that incorporate fitness ridges connecting sequences of more divergent orthologues27. The nature of global fitness landscapes, especially the interplay between local and global scales, remains to be explored.
Extended Data
Extended Data Figure 1.
The scheme of the experimental approach.
Extended Data Figure 2.
A violin plot of the measured levels of fluorescence for genotypes carrying different number of missense mutations.
Extended Data Figure 3.
Log-fluorescence and d evolutionary conservation expressed as Shannon entropy and e fraction of mutant amino acid states found in avGFP orthologues (y-error bars in e show binomial proportion confidence interval level, 68%, and SE elsewhere).
Extended Data Figure 4. Epistatically interacting pairs of sites in the GFP structure.
a, Pairs of amino acid sites for which we assayed at least one combination of mutations (in blue, upper left). The distribution of the maximum level of epistasis observed between sites (blue scale, lower right) and unknown values (white). b, Pairs of sites under exceptionally strong epistatic interaction (e < −2) connected by a blue line on the GFP structure. c, The distribution of distances in the GFP structure between sites with at least one pair of epistatically interacting mutations (red) and all pairs of sites in the structure (grey). d, Epistasis between pairs of mutations as a function of their individual fluorescence.
The contribution of internally and externally oriented amino acid residues in the avGFP structure relative to pairs of missense mutations showing no epistasis (|e| < 0.3), weak (0.3 < |e| < 0.7) and strong (|e| > 0.7) epistasis.
Extended Data Figure 5.
a. A multiple linear regression where fluorescence is linear combination of effects of individual single mutations. b, A multiple regression where mutations contribute linearly to a fitness potential and fluorescence is a sigmoidal function of p where F ~ e−p/(1+e−p). c, d, The predicted fluorescence by a neural network approach. Predicted fitness function by a neural network with one hidden neuron and two neurons in the outer layer. e, The scheme of our neural network approach. The genotype data was passed to the input layer of the neural network as an array of 0’s and 1’s corresponding to the absence or presence of amino acid mutations in the genotype, respectively. The first hidden layer consisted of a single neuron which calculated the weighted sum of inputs using weights obtained during training. Output of the first hidden layer was passed through an output subnetwork that transformed this value with a non-linear function to make the final prediction of fluorescence. The output subnetwork consisted of several neurons with a sigmoidal transfer function, allowing the subnetwork to approximate a broad range of non-linear functions. The final mapping of the hidden value to fluorescence was determined by the weights of connections between neurons inside the output subnetwork. During training all weights were optimized to find the best prediction of fluorescence from the hidden value. The resulting function that was defined during training is shown in Figure 4. f, Correlation between hidden value of the neural network and Rosetta-predicted ΔΔG for single mutants.
Extended Data Table 1. Genotypes with measured fluorescence in our dataset.
| Number of mutations from the wildtype | Number of amino acid sequences assayed | Number of possible amino acid sequences | Fraction of amino acid sequences sampled | Number of nucleotide sequences assayed | Number of possible nucleotide sequences | Fraction of nucleotide sequences sampled |
|---|---|---|---|---|---|---|
| 1 | 1,114 | 1,233 | 0.90 | 1,336 | 2,133 | 0.63 |
| 2 | 13,010 | 759,528 | 0.02 | 11,555 | 1,313,928 | 0.0077 |
| 3 | 12,683 | 311,659,656 | 4.1 × 10⁻⁵ | 12,654 | 539,148,456 | 1.8 × 10⁻⁵ |
| 4 | 9,759 | 9.6 × 10¹⁰ | 1.0 × 10⁻⁷ | 10,633 | 1.7 × 10¹¹ | 4.3 × 10⁻⁸ |
| 5 | 7,215 | 2.4 × 10¹³ | 3.1 × 10⁻¹⁰ | 8,164 | 4.1 × 10¹³ | 1.2 × 10⁻¹⁰ |
| 6 | 4,643 | 4.8 × 10¹⁵ | 9.6 × 10⁻¹³ | 5,869 | 8.3 × 10¹⁵ | 3.6 × 10⁻¹³ |
| 7 | 2,783 | 8.5 × 10¹⁷ | 3.3 × 10⁻¹⁵ | 3,664 | 1.5 × 10¹⁸ | 1.1 × 10⁻¹⁵ |
| 8 | 1,526 | 1.3 × 10²⁰ | 1.2 × 10⁻¹⁷ | 2,212 | 2.2 × 10²⁰ | 3.9 × 10⁻¹⁸ |
| 9 | 714 | 1.8 × 10²² | 4.1 × 10⁻²⁰ | 1,229 | 3.0 × 10²² | 1.4 × 10⁻²⁰ |
| 10 | 352 | 2.2 × 1024 | 1.6 × 10⁻²² | 624 | 3.7 × 1024 | 5.0 × 10⁻²³ |
Supplementary Material
Acknowledgements
We thank Yuliya Kulikova and Guillaume Filion for insightful discussion on statistical analysis and Ilya Osterman, Rocco Moretti and Jens Meiler for technical assistance and Maren Friesen for a critical reading of the manuscript. We thank Heinz Himmelbauer, CRG Genomic Unit and the Russian Science Foundation project (14-50-00150) for sequencing. Experiments were partially carried out using the equipment provided by the IBCH core facility (CKP IBCH). The work was supported by HHMI International Early Career Scientist Program (55007424), the EMBO Young Investigator Programme, MINECO (BFU2012-31329), Spanish Ministry of Economy and Competitiveness Centro de Excelencia Severo Ochoa 2013-2017 grant (SEV-2012-0208), Secretaria d’Universitats i Recerca del Departament d’Economia i Coneixement de la Generalitat’s AGAUR program (2014 SGR 0974), Russian Science Foundation (14-25-00129) and the European Research Council under the European Union’s Seventh Framework Programme (FP7/2007-2013, ERC grant agreement (335980_EinME).
Footnotes
Accession numbers: Data availability. Raw sequencing data were deposited to SRA under BioProject number PRJNA282342. Processed data sets are available at Figshare http://dx.doi.org/10.6084/m9.figshare.3102154.
Author Contributions: KSS and MVM conceived the idea for the experiment; KSS, DAB, MVM, ASM, GVS, MDL, DMC, EVP, IZM, DST, KAL and FAK participated in experimental design; KSS, DAB, MVM, GVS, EVP, ESE and MDL performed the experiments; KSS, DAB, MVM, DRU, ASM, DNI, NGB, MSB, OS, OS, NSB, PKV, ASK, FAK performed data analysis; KSS, DAB, MVM, DRU, DNI and FAK wrote the draft.
Reprints and permissions information is available at www.nature.com/reprints.
The authors declare no interests.
References
- 1.Wright S. The roles of mutation, inbreeding, crossbreeding and selection in evolution. In: Jones DF, editor. Proc Sixth Int Congr Genet. Vol. 1. Genetics Society of America; 1932. pp. 356–366. [Google Scholar]
- 2.De Visser JAGM, Krug J. Empirical fitness landscapes and the predictability of evolution. Nat Rev Genet. 2014;15:480–490. doi: 10.1038/nrg3744. [DOI] [PubMed] [Google Scholar]
- 3.Dean AM, Thornton JW. Mechanistic approaches to the study of evolution: the functional synthesis. Nat Rev Genet. 2007;8:675–688. doi: 10.1038/nrg2160. [DOI] [PMC free article] [PubMed] [Google Scholar]
- 4.Soskine M, Tawfik DS. Mutational effects and the evolution of new protein functions. Nat Rev Genet. 2010;11:572–582. doi: 10.1038/nrg2808. [DOI] [PubMed] [Google Scholar]
- 5.Weinreich DM, Lan Y, Wylie CS, Heckendorn RB. Should evolutionary geneticists worry about higher-order epistasis? Curr Opin Genet Dev. 2013;23:700–707. doi: 10.1016/j.gde.2013.10.007. [DOI] [PMC free article] [PubMed] [Google Scholar]
- 6.Mackay TFC. Epistasis and quantitative traits: using model organisms to study gene-gene interactions. Nat Rev Genet. 2014;15:22–33. doi: 10.1038/nrg3627. [DOI] [PMC free article] [PubMed] [Google Scholar]
- 7.Taylor MB, Ehrenreich IM. Higher-order genetic interactions and their contribution to complex traits. Trends Genet. 2015;31:34–40. doi: 10.1016/j.tig.2014.09.001. [DOI] [PMC free article] [PubMed] [Google Scholar]
- 8.Bershtein S, Segal M, Bekerman R, Tokuriki N, Tawfik DS. Robustness-epistasis link shapes the fitness landscape of a randomly drifting protein. Nature. 2006;444:929–932. doi: 10.1038/nature05385. [DOI] [PubMed] [Google Scholar]
- 9.Fowler DM, et al. High-resolution mapping of protein sequence-function relationships. Nat Methods. 2010;7:741–746. doi: 10.1038/nmeth.1492. [DOI] [PMC free article] [PubMed] [Google Scholar]
- 10.Roscoe BP, Thayer KM, Zeldovich KB, Fushman D, Bolon DN. Analyses of the effects of all ubiquitin point mutants on yeast growth rate. J Mol Biol. 2013;425:1363–1377. doi: 10.1016/j.jmb.2013.01.032. [DOI] [PMC free article] [PubMed] [Google Scholar]
- 11.Jacquier H, et al. Capturing the mutational landscape of the beta-lactamase TEM-1. Proc Natl Acad Sci U S A. 2013;110:13067–13072. doi: 10.1073/pnas.1215206110. [DOI] [PMC free article] [PubMed] [Google Scholar]
- 12.Melamed D, Young DL, Gamble CE, Miller CR, Fields S. Deep mutational scanning of an RRM domain of the Saccharomyces cerevisiae poly(A)-binding protein. RNA. 2013;19:1537–1551. doi: 10.1261/rna.040709.113. [DOI] [PMC free article] [PubMed] [Google Scholar]
- 13.Olson CA, Wu NC, Sun R. A comprehensive biophysical description of pairwise epistasis throughout an entire protein domain. Curr Biol. 2014;24:2643–2651. doi: 10.1016/j.cub.2014.09.072. [DOI] [PMC free article] [PubMed] [Google Scholar]
- 14.Bank C, Hietpas RT, Jensen JD, Bolon DN. A systematic survey of an intragenic epistatic landscape. Mol Biol Evol. 2014;32:229–238. doi: 10.1093/molbev/msu301. [DOI] [PMC free article] [PubMed] [Google Scholar]
- 15.Meini MR, Tomatis PE, Weinreich DM, Vila AJ. Quantitative description of a protein fitness landscape based on molecular features. Mol Biol Evol. 2015;32:1774–1787. doi: 10.1093/molbev/msv059. [DOI] [PMC free article] [PubMed] [Google Scholar]
- 16.Kondrashov AS, Sunyaev S, Kondrashov FA. Dobzhansky-Muller incompatibilities in protein evolution. Proc Natl Acad Sci U S A. 2002;99:14878–14883. doi: 10.1073/pnas.232565499. [DOI] [PMC free article] [PubMed] [Google Scholar]
- 17.Firnberg E, Labonte JW, Gray JJ, Ostermeier M. A comprehensive, high-resolution map of a Gene’s fitness landscape. Mol Biol Evol. 2014;31:1581–1592. doi: 10.1093/molbev/msu081. [DOI] [PMC free article] [PubMed] [Google Scholar]
- 18.Parera M, Martinez MA. Strong epistatic interactions within a single protein. Mol Biol Evol. 2014;31:1546–1553. doi: 10.1093/molbev/msu113. [DOI] [PubMed] [Google Scholar]
- 19.Coates MM, Garm A, Theobald JC, Thompson SH, Nilsson DE. The spectral sensitivity of the lens eyes of a box jellyfish, Tripedalia cystophora (Conant) J Exp Biol. 2006;209:3758–3765. doi: 10.1242/jeb.02431. [DOI] [PubMed] [Google Scholar]
- 20.DePristo MA, Weinreich DM, Hartl DL. Missense meanderings in sequence space: a biophysical view of protein evolution. Nat Rev Genet. 2005;6:678–687. doi: 10.1038/nrg1672. [DOI] [PubMed] [Google Scholar]
- 21.Milkman R. Selection differentials and selection coefficients. Genetics. 1978;88:391–403. doi: 10.1093/genetics/88.2.391. [DOI] [PMC free article] [PubMed] [Google Scholar]
- 22.Kimura M, Crow JF. Effect of overall phenotypic selection on genetic change at individual loci. Proc Natl Acad Sci U S A. 1978;75:6168–6171. doi: 10.1073/pnas.75.12.6168. [DOI] [PMC free article] [PubMed] [Google Scholar]
- 23.Crow JF, Kimura M. Efficiency of truncation selection. Proc Natl Acad Sci U S A. 1979;76:396–399. doi: 10.1073/pnas.76.1.396. [DOI] [PMC free article] [PubMed] [Google Scholar]
- 24.Rockah-Shmuel L, Tóth-Petróczy Á, Tawfik DS. Systematic Mapping of Protein Mutational Space by Prolonged Drift Reveals the Deleterious Effects of Seemingly Neutral Mutations. PLoS Comput Biol. 2015;11:1–28. doi: 10.1371/journal.pcbi.1004421. [DOI] [PMC free article] [PubMed] [Google Scholar]
- 25.Li WH. Models of nearly neutral mutations with particular implications for nonrandom usage of synonymous codons. J Mol Evol. 1987;24:337–345. doi: 10.1007/BF02134132. [DOI] [PubMed] [Google Scholar]
- 26.Akashi H. Inferring weak selection from patterns of polymorphism and divergence at ‘silent’ sites in Drosophila DNA. Genetics. 1995;139:1067–1076. doi: 10.1093/genetics/139.2.1067. [DOI] [PMC free article] [PubMed] [Google Scholar]
- 27.Povolotskaya IS, Kondrashov FA. Sequence space and the ongoing expansion of the protein universe. Nature. 2010;465:922–926. doi: 10.1038/nature09105. [DOI] [PubMed] [Google Scholar]
- 28.Usmanova DR, Ferretti L, Povolotskaya IS, Vlasov PK, Kondrashov FA. A model of substitution trajectories in sequence space and long-term protein evolution. Mol Biol Evol. 2015;32:542–554. doi: 10.1093/molbev/msu318. [DOI] [PMC free article] [PubMed] [Google Scholar]
- 29.Eyre-Walker A, Keightley PD. The distribution of fitness effects of new mutations. Nat Rev Genet. 2007;8:610–618. doi: 10.1038/nrg2146. [DOI] [PubMed] [Google Scholar]
- 30.Ohta T. Slightly deleterious mutant substitutions in evolution. Nature. 1973;246:96–98. doi: 10.1038/246096a0. [DOI] [PubMed] [Google Scholar]
Associated Data
This section collects any data citations, data availability statements, or supplementary materials included in this article.


