Abstract
NAtural Deep Eutectic Solvents (NADES) are chemically simple but physiologically important plant constituents that exhibit unique solubilizing properties of other metabolites, including bioactive constituents. The high polarity of NADES introduces a challenge in the ability of conventional solid-support based chromatography to recover potential bioactive metabolites. This complicates the systematic explanation of the NADES’ functions in botanical extracts. The present study utilizes countercurrent separation (CCS) methodology to overcome the recovery challenge. To demonstrate its feasibility, Glucose-Choline chloride-Water (GCWat, 2:5:5, mole/mole) served as a model NADES, and four widely used marker flavonoids with different polarities (rutin, quercetin, kaempferol, and daidzein) were chosen as model target analytes. In order to prepare GCWat with high consistency, a water drying study was performed. The unique capabilities of the recently introduced CherryOne system, offering volumetric phase metering, were used to monitor the CCS operations. The collected fractions were analyzed using UHPLC and NMR/quantitative NMR. CCS was able to recover the analytes from the NADES matrix with quantitative recoveries of 95.7%, 94.6%, 97.0%, and 96.7% for rutin, quercetin, kaempferol, and daidzein respectively. The CCS strategy enables recovery of target metabolites from NADES-containing crude extracts as well as from other chemical mixtures, and moreover offers a means of using NADES as environmentally friendly extraction solvents.
Keywords: Natural deep eutectic solvents, Countercurrent separation, Countercurrent chromatography, Flavonoids, Metabolite extraction and recovery
1. Introduction
In 2011, NAtural Deep Eutectic Solvents (NADES) were identified from plants as a special form of mixtures of solids that remain in the liquid state at and below ambient temperature, and show distinctively different physiochemical characteristics from both water and lipids [1]. The NADES components were recognized as being “primary” metabolites [1,2], such as amino acids, organic acids, and sugars.
Habitually, natural products have been divided into “primary” (biochemical housekeeping) and “secondary” (frequently bioactive) metabolites. However, in the absence of a theoretical basis, this metabolite classification has been shown to be inadequate [3]. The historic partitioning of compounds into the two groups also illustrates a general but potentially deceptive relationship with polarity: “primary” metabolites are mostly highly polar, water soluble compounds, whereas the “secondary” metabolites tend to be more lipophilic. Meanwhile, numerous exceptions apply to this general rule, e.g., when quaternary alkaloids are classified as being “secondary” or fatty acids as being “primary”. However, this grouping still reflects the tendency of polar (primary) metabolites to represent the major portion of the currently defined metabolome in plants, but also other organisms. Conversely, the structurally more complex “secondary” metabolites typically represent the smaller, more lipophilic portion, granted varying degrees of overlap.
Typical “primary” plant metabolites are sugars (e.g., glucose, fructose, mannose, sucrose), organic salts (e.g., choline chloride, betaine), organic acids (e.g., lactic acid, citric acid, malic acid), and amino acids (e.g., proline, serine, alanine). Interestingly, these types of metabolites have also been found to be NADES constituents. Despite their high polarity, NADES exhibit an unexpected solubilizing ability for relatively lipophilic compounds [2] and can even stabilize bioactive metabolites [4]. As NADES components, “primary” metabolites may have important (non-housekeeping) functions in botanical extracts, including (over-)additive biological effects that are often referred to as “synergistic”. This hypothesis is nurtured by the observation that dietary supplements and traditional medical formulae continue to be administered in the form of the crude extracts, which often are rich in NADES, and show distinctly different pharmacodynamic properties relative to purified materials. However, as the “primary” metabolites are usually considered to have no intrinsic bioactivity, or even to represent “nonsense” compounds, their role in this context has remained essentially unstudied. Therefore, the recognition of NADES opens new perspectives in natural product research.
One important prerequisite for studying the function of the “primary”, potentially NADES-forming metabolome in botanical extracts is the ability to separate cleanly the polar “primary” from the potentially bioactive “secondary” metabolites. Another complication relates to the polar nature of NADES: many of the “primary” metabolites show unfavorable chromatographic characteristics in solid-support liquid chromatographic methods, in particular in preparative procedures that are key to the characterization of botanical active principles. One part of the challenge is associated with the inherently low vapor pressure of NADES, which paired with their high viscosity makes recovery of analytes from NADES media difficult when using conventional liquid chromatography (LC) [5,6]. To overcome this deficiency, an alternative chromatography needs to be developed.
Countercurrent separation (CCS) is a liquid-only form of LC [7,8]. This technology is orthogonal to solid phase-based LC, can avoid sample loss resulting from degradation or absorption on a solid support, and thus, is characterized by high recovery and reproducibility [9,10]. At the same time, as the stationary phase in CCS is a liquid, its separation and resolution essentially depend on the partition coefficient (K) value of each analyte, representing their relative distribution between the stationary and mobile phases of a given solvent system [11]. Unlike most natural products, polar NADES components are able to form strong hydrogen bonds [12]. Accordingly, NADES tend to be soluble in polar solvents such as water and MeOH, while being insoluble in non-polar solvents such as EtOAc and hexane [13]. Therefore, the NADES components will prefer to stay in an aqueous phase and may be eluted at, or very near the front or tail of the elution in a CCS, far away from the usual K value sweet spot range from 0.25 to 16 [14]. Following this discussion, if a given target analyte can be delivered into the sweet spot range of K values, a clean separation of the analyte from a NADES-analyte matrix is likely achievable. This was one of the key hypotheses of the present study.
The second set of rationales related to the choice of a model NADES system and target analytes for proof-of-concept purposes. Considering our research focus on botanicals for women’s health, certain flavonoids have been widely considered as bioactive constituents and, thus, were identified as potential model compounds. On one hand, some function as important bioactive ingredients, e.g., the isoflavone, daidzein, from red clover extract, exhibits estrogenic activity [15–17]. On the other hand, several have recently been identified as potential invalid metabolic panaceas (IMPs) [18], compounds that have led to wasted effort and resources. Accordingly, many of them are representatives of the top-ranking IMP candidates, and can even undermine the drug discovery and discovery of bioactive botanical markers. The glucoside, rutin, and the aglycones, quercetin and kaempferol, are representatives of the top-ranking IMP candidates [18]. Accordingly, these three flavonoids as well as the isoflavone, daidzein, were selected as model metabolites for the present study. One goal was to show that CCS is able to not only enrich bioactive constituents for subsequent screening of potential leads, but also to knock out the IMPs quantitatively, avoiding their otherwise unavoidable or unwanted interference in screening bioassays. Equally important, the advancement of a clean cut between “secondary” and “primary” metabolites would enable the investigation of the understudied “primary” metabolite function. For model NADES selection, the system of Glucose-Choline chloride-Water (GCWat, 2:5:5, mole/mole) was chosen due to its abundance in plants and the fact that it exhibits a relatively high solubility for flavonoids including the relatively lipophilic aglycones and the glycoside, rutin [2]. Each individual flavonoid was soluble in GCWat, and four individual GCWat-analyte solutions (rutin at 20 mg/mL, quercetin at 18 mg/mL, kaempferol and daidzein at 4 mg/mL), were used to demonstrate the feasibility of CCS-assisted recovery of analytes from the NADES matrix.
2. Experimental
2.1. Materials
Choline chloride, d-(+)-glucose, rutin, UHPLC grade solvents, and DMSO-d6 (99.9 at.% D) were purchased from Sigma-Aldrich Inc. (St. Louis, MO, USA). Quercetin, kaempferol, and daidzein were obtained from UIC/NIH Center for Botanical Dietary Supplements Research. The analytical grade solvents were purchased from Pharmco-AAPER (Crookfield, CT, USA) and redistilled before use.
2.2. Preparation of natural deep eutectic solvent and related solutions
Glucose-Choline chloride-Water (GCWat, 2:5:5, mole/mole) was prepared as follows: glucose (0.01 mole) and choline chloride (0.025 mole) were dissolved in distilled water (2 mL) and treated in an FS140 ultrasonic bath (Fisher Scientific, Loughborough, UK) until particles were completely dissolved. Then, the solution was placed in a centrifugal vacuum evaporation system (Thermo Scientific, Waltham, MA, USA) to remove water for 14.4 h. The evaporation system consisted of an SC250 Express SpeedVac Concentrator (37 °C and 4.7 Torr), a RVT4104 Refrigerated Vapor Trap (4 L and −104 °C), and an OFP 400 Vacuum Pump. After 14.4 h of vacuum centrifugal evaporation, the desired NADES, GCWat was obtained.
NADES-analyte solutions were prepared as follows: the analytes were mixed with the appropriate volume of GCWat in a vial. The vial was then placed into an ISOTEMP 110 water bath (Fisher Scientific, Loughborough, UK) at 37 °C for 24 h. The following NADES-analyte solutions were produced: rutin (20 mg/mL), quercetin (18 mg/mL), kaempferol (4 mg/mL), and daidzein (4 mg/mL).
2.3. Countercurrent chromatography procedures
2.3.1. Biphasic solvent system selection
The TLC-based Generally Useful Estimate of Solvent System (GUESS) method was used for the selection of the biphasic solvent systems. Rutin, quercetin, kaempferol, and daidzein dissolved in MeOH (1 mg/mL) were spotted individually on silica gel TLC plates (Macherey-Nagel, USA). All TLC plates were developed with the organic phase of each candidate solvent system [14,19], and the resulting chromatograms were screened for ones in which the Rf value of each test sample was close to 0.5. All solvent systems used and the results obtained are listed in Table 1.
Table 1.
The screened CCS solvent systems and their related TLC results.
| Rutin | Quercetin | Kaempferol | Daidzein | ||
|---|---|---|---|---|---|
|
|
|
||||
| EBuWat | Rf values | HEMWat | Rf values | ||
| 5:5:10 | 0.59 | 3:7:5:5 | 0.63 | 0.73 | 0.62 |
| 6:4:10 | 0.53 | 4:6:5:5 | 0.36 | 0.59 | 0.37 |
| 7:3:10 | 0.41 | 5:5:5:5 | 0.20 | 0.37 | 0.21 |
2.3.2. Countercurrent separation (CCS)
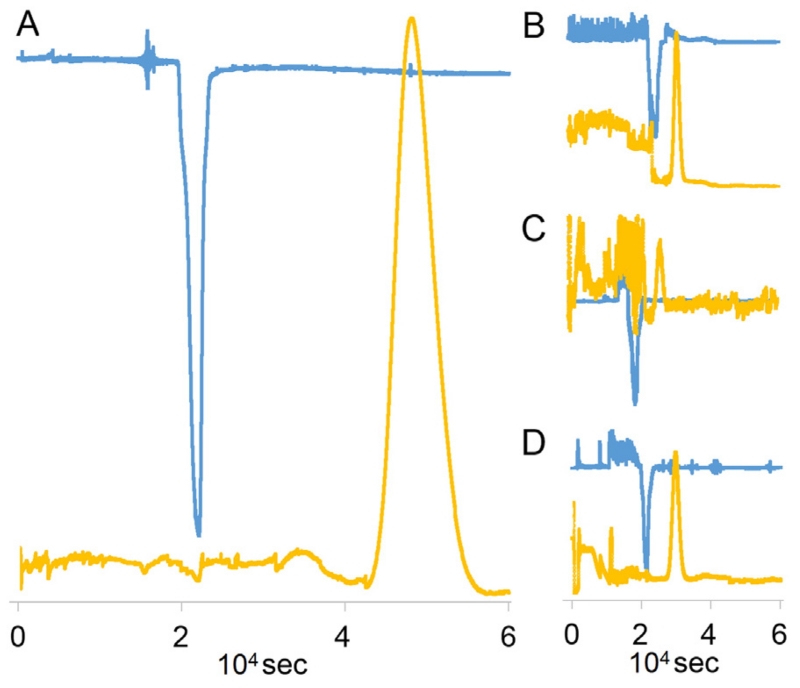
CCS was performed as previously described [20] in a TBE-20 A HSCCC instrument (16 mL, Tauto Biotech, China). The NADES-analyte solution (100 μL) was diluted with both upper and lower phase (200 μL of each), then loaded into the sample loop (2 mL). Several different solvent systems were used in this study, for details see Table 1 and Section 3.2. In order to optimize recovery, the dipped part of the tube attached to the flush out port and the vial were washed three times with lower phase (300 μL/each) and also loaded into the sample loop. Reversed phase mode (equivalent to lower phase mobile) was used in all CCS operations. Throughout the CCS operation, the stationary phase volume retention ratio (Sf), the partition coefficient (K), the UV absorption at 254 nm, and the eluting phase (Phase Metering Apparatus, PMA) were monitored and recorded by the CherryOne system [21]. Guided by the PMA and UV signals, the GCWat and target analyte for each run were collected into two separate fractions (Fig. 2). After the operation, these fractions were dried by vacuum centrifugal evaporation and subject to qualitative and quantitative analyses by UHPLC and NMR, including 1H NMR, 13C NMR, and quantitative 1H NMR (qHNMR).
Fig. 2.
The real time parameters (UV and PMA) were determined by the CherryOne operating system. The four plots (A, B, C and D) stem from different CCS operations. A shows the behavior of GCWat-rutin solution in EBuWat (6:4:10, v/v). B reflects the behavior of GCWat-quercetin solution in HEMWat (3:7:5:5, v/v). C shows the behavior of GCWat-kaempferol solution in HEMWat (4:6:5:5, v/v). D demonstrates the behavior of GCWat-daidzein solution in HEMWat (3:7:5:5, v/v). The dispersion signals represented PMA values and the peak signals represented UV absorption. The x-axis exhibited the operation time.
2.4. NMR analyses
Prior to analysis, each sample was dried under vacuum (<1 mbar) in a desiccator overnight for removal of residual water. Samples were dissolved in 600 μL DMSO-d6 delivered with a 1000 μL analytical syringe (Valco Instruments, Baton Rouge, LA, USA). NMR spectra were acquired on a BRUKER AVANCE 360 NMR spectrometer in 5 mm tubes at 298 K. Acquisition of 1H NMR was as follows: a total of 16 scans (NS), 32 k of time domain (TD) data, a 30 degree excitation pulse, and a relaxation delay (D1) of 1 s. The acquisition of the DEPT-135 spectra used a total of 2048 scans (NS) and 32 k of time domain (TD) data. The acquisition of qHNMR analysis used a total of 64 scans (NS), 64 k of time domain (TD) data, a 90 degree excitation pulse, a relaxation delay (D1) of 60 s, and an acquisition time (AQ) of 4 s. The spectra were processed using MestReNova v9.0.1 (Mestrelab Research, Santiago de Compostela, Spain) software. For enhanced NMR line shape, a Gaussian-Lorentzian window functions (GB 0.05 and LB −0.3) was applied, followed by four times zero-filling prior to Fourier transformation of the FID. The baseline was corrected with a 5th order polynomial function for 1H NMR and DEPT-135 spectra, and Whittaker Smoother functions were used for qHNMR spectra. Phase correction was performed manually.
2.5. UHPLC analyses
These were performed on Nexera, an ultra-high performance liquid chromatography system (UHPLC, Shimadzu Corporation, Kyoto, Japan) equipped with a Waters Acquity UPLC BEH C18 (2.1 × 5.0 mm, 1.7 μm) column and a diode array detector (DAD, Shimadzu SPD-M20-A). The autosampler temperature was set to 4 °C, and the column oven temperature was set to 40 °C. Post-run data analyses were performed using the Shimadzu LabSolution software package. Analytes of each were dissolved in MeOH (1 mg/mL, HPLC grade, Fisher Co. Ltd.) and filtered (filter Acrodisc CR 13 mm, 0.20 μm PTFE membrane) prior to injection (10 μL). All LC conditions are listed in Table 3.
Table 3.
UHPLC conditions for the target metabolites.
| Sample | Water (%) |
ACN (%) |
Wavelength (nm) |
Flow rate (mL/min) |
Retention time (min) |
|---|---|---|---|---|---|
| Rutin | 90 | 10 | 350/254 | 0.4 | 4.9 |
| Quercetin | 85 | 15 | 350/254 | 0.4 | 6.9 |
| Kaempferol | 80 | 20 | 350/254 | 0.4 | 5.4 |
| Daidzein | 85 | 15 | 300/254 | 0.4 | 4.6 |
2.6. Recovery determination
Two identical aliquots (100 μL) of each of the GCWat-test sample solutions were used for the determination of the analyte recovery values. One aliquot (100 μL) was subject to CCS and the fractions were determined by quantitative 1H NMR (qHNMR). The other aliquot was used as a quantitative (100%) reference control and directly analyzed by qHNMR without CCS. When the aliquot from CCS and the control aliquot were dissolved in DMSO-d6 (600 μL), the volume of each solution was measured precisely by a 1000 μL analytical syringe. Otherwise, sample preparation procedures and NMR instrumentation were the same as described in Section 2.4, including qHNMR analysis.
3. Results and discussion
3.1. Preparation of natural deep eutectic solvent
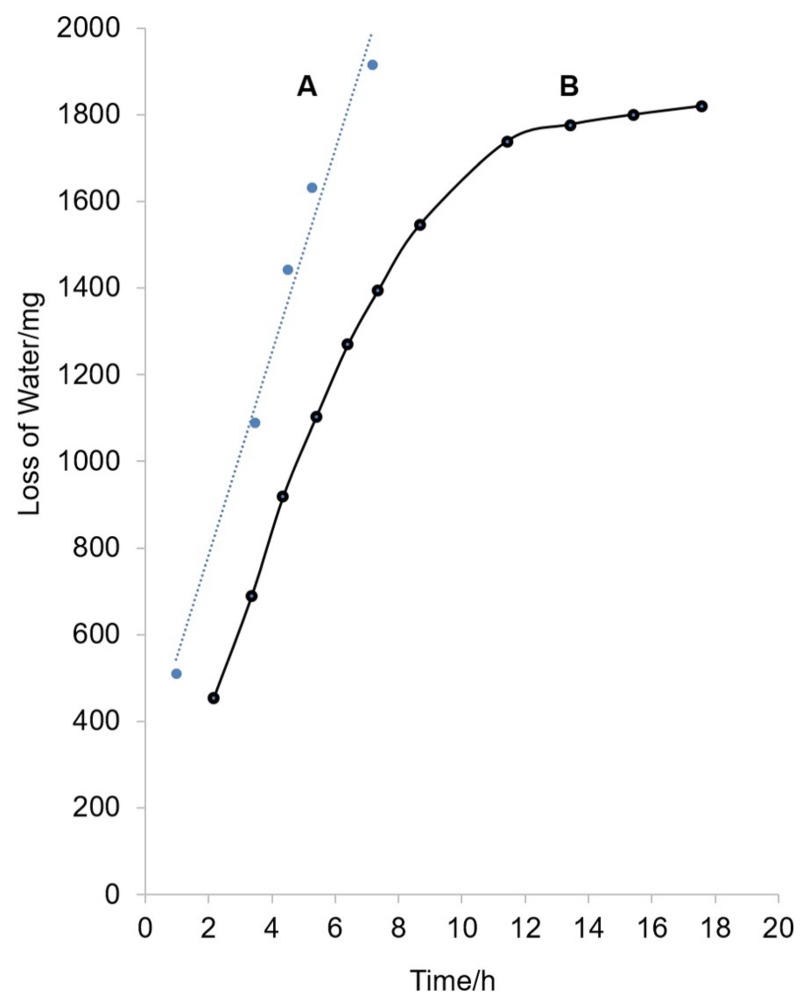
In order to prepare the NAtural Deep Eutectic Solvents (NADES) in a reproducible manner, an ultrasound-vacuum centrifugal evaporation method was developed. The use of ultrasound permitted the efficient dissolution of solid particles, and vacuum centrifugation led to the removal of extra water. Compared to the reported vortex-vacuum evaporation method [2], the ultrasound-vacuum centrifugal evaporation method avoids the laborious vortex step. Importantly, the present procedure optimizes the reproducibility of the water removal. A systematic investigation of water drying during the evaporation stage helped to understand how long the water drying lasts. Furthermore, it provides indications as to how the intermolecular forces change during NADES preparation. Fig. 1 compares NADES solution drying (B) with the drying of free water (A). While free water showed a linear drying loss (y = 253x + 384, R2 = 0.982), the drying curve of the GCWat NADES was split into two time zones: a rapid drying zone (i) during the first 8 h, which was linear following the equation: y = 169x + 140, R2 = 0.986; and much slower zone (ii) reflecting asymptotic loss of water from 12 to 18 h, which was also linear following equation: y = 10x + 1640, R2 = 0.996.
Fig. 1.
(A) Distilled water was dried by a vacuum centrifugal evaporation. (B) Glucose (0.01 mol) and choline chloride (0.025 mol) were dissolved in distilled water (2 mL). After total dissolution in the water, the resulting solution was treated by a vacuum centrifugal evaporation.
The slope of equation (i) from 2 to 8 h was 169. With reference to the observed slope of 253 for free water, the removed water molecules are likely influenced by the molecules of NADES components. According to the Frank model for structure of water around an ion [22], water molecules removed from 2 to 8 h may originate from the disordered zone. The lower slope of 10 observed for the quantitative linear slower period (ii) from 12 to 18 h indicated higher resistance of removing more residual water. This indicated that the hydrogen bond strength had increased in the NADES matrix. The water molecules being removed at this stage likely stay in the ordered zone, i.e., are surrounded with NADES ions, and, thus, stronger (more highly ordered) hydrogen bonds are formed in the NADES matrix. This indicates that the hydrogen bonding network reaches maximum strength during the final stage (ii) of the ultrasound-vacuum centrifugal evaporation procedure, leading to a defined amount of retained water. Therefore, hydrogen bonding is likely one of the most important molecular forces in GCWat. This confirms results demonstrated by FT-IR spectral analysis [4]. Moreover, the formation of hydrogen bonding is an important factor affecting analyte solubility and stability in NADES. Thus, the water content of NADES may be highly related to their solubility and stabilizing ability for any given analyte.
For a NADES preparation method, reproducibility is another important aspect. Based on the zone (ii) equation y = 10x + 1640, the preparation time can be calculated as 14.4 h. In this manner, the ultrasound-vacuum centrifugal evaporation method can provide highly consistent GCWat solutions. To evaluate the ultrasound-vacuum centrifugal evaporation method further, the solubility of rutin was assessed in a range of NADES: GCWat, 5% GCWat (GCWat:water, 95:5, v/v), and 10% GCWat (GCWat:water, 90:10, v/v) were investigated, and the solubilities were found to be 0.26 M, 0.40 M, and 0.18 M, respectively. These findings are consistent with previous results [2].
3.2. GUESS-guided CCS solvent system selection
Solvent system selection is the priority step to achieve a successful CCS, but it can be the most time consuming and labor intensive step in a CCS operation. Here, the Generally Useful Estimate of Solvent System (GUESS) method [19] was employed to accelerate solvent system selection. GUESS uses TLC to directly predict an appropriate CCS solvent system. Briefly, if the organic phase of a solvent system or an equivalent organic-only solvent system reported in [19] can develop a given analyte to a Rf close to 0.5 on a normal phase TLC plate, the parent solvent system will likely deliver the analyte into the CCS K value sweet spot. This approach has been validated [20,23]. Although only Hexane-EtOAc-MeOH-Water (HEMWat) and CHCl3-MeOH-Water (ChMWat) solvent system families were fully detailed in the original GUESS method publication [19], in practice, this consideration can be applied to most available biphasic solvent systems. For example, the EtOAc-BuOH-Water (EBuWat) solvent system family was employed successfully to find a suitable solvent system for the glycosylated flavonoid, rutin. Actually, the equivalent organic-only solvent system is a variant of the organic phase of the solvent system, which facilitates preparation of the TLC eluent and conserves solvent. As no equivalent organic-only solvent has been developed for the EBuWat solvent system family, the organic phases of the candidate systems were used.
The Rf value of each target analyte was determined using each candidate solvent system, and the results are listed in Table 1. Considering the high polarity of the NADES components, if a solvent system delivers the analyte in the K value sweet spot, the analyte will be recovered quantitatively from the NADES matrix. It should be noted that a better resolution can be achieved if the Rf value of the target analyte is slightly over 0.5, with the target analyte favoring the organic phase. This approach was used in solvent system selection for all test samples. According to Table 1, the CCS solvent systems were selected as follows: EBuWat (6:4:10, v/v) for rutin, HEMWat (3:7:5:5, v/v) for quercetin and daidzein, and HEMWat (4:6:5:5, v/v) for kaempferol.
3.3. Compatibility study
Due to the high viscosity of the NADES, one of the main concerns was the potential blockage of the CCS column by “NADES pulp” potentially formed as a result of NADES’ enrichment. In order to assess this possibility, compatibility studies were performed prior to the actual CCS operation. Partitioning experiments evaluated the fluidity of the solutions. GCWat was dissolved in the selected solvent systems HEMWat (4:6:5:5, v/v), HEMWat (3:7:5:5, v/v), and EBuWat (7:3:10, v/v), respectively. In all tests, 100 μL of GCWat was mixed with 200 μL of each of upper and lower phase. No precipitation of particles from the partitioned solution occurred. The viscosity of the solution was clearly lower than that of GCWat alone. Due to the hydrophilicity of GCWat, the volume ratio of lower to upper phase was close to 3:2 after partitioning. This evidence matched what could be predicted from the K values of NADES components, which were close to 0 in all of the tested solvent systems.
Next, a series of CCS trials were performed in a 16 mL high-speed countercurrent chromatography (HSCCC) instrument. GCWat (100 μL) was dissolved in equal volumes of upper and lower phase (200 μL of each), which yielded the trial sample that was loaded into the sample loop (2 mL). All three selected solvent systems were tested. The whole CCS operation worked well, and the pressure remained at a low level (<18 psi). In all solvent systems, the K values of GCWat were close to 0 in a reversed phase (or lower phase mobile) mode. Based on these results, a mixture of upper phase, lower phase, and a GCWat solution of the test sample (2:2:1, v/v) was used for sample loading in the further studies. The components of GCWat showed a characteristic dispersion signal (Fig. 2), when monitored by the Phase Metering Apparatus (PMA), thus allowing the targeted collect component of GCWat in the CCS elution. Furthermore, as the NADES components represent highly polar or ionic molecules, it was conceivable that they might break the equilibration of the biphasic CCS solvent systems. This was assessed by real time monitoring of the stationary phase volume retention ratio (Sf) using the CherryOne system [21]. The results showed that the Sf values were constant during the CCS operation (data not shown).
3.4. Recovery of flavonoids from a NADES matrix, via CCC
Small-volume (16 mL) CCS was used for the recovery study. The K values of the target analytes were all above 1 as predicted by the GUESS approach for the chosen solvent systems (Table 2), and consistent with the discussion in Section 3.2. Accordingly, CCS was successfully performed to individually recover the target analyte from the NADES-analyte matrix.
Table 2.
The solvent systems selected for the CCS recovery of the target metabolites and their K values.
| Target analyte | Solvent system (v/v) | K value |
|---|---|---|
| Rutin | EBuWat 6:4:10 | 7.75 |
| Quercetin | HEMWat 3:7:5:5 | 1.11 |
| Kaempferol | HEMWat 4:6:5:5 | 1.63 |
| Daidzein | HEMWat 3:7:5:5 | 1.47 |
As mentioned above, the CherryOne PMA can detect ions or polar NADES components during CCS elution. Additionally, as all target analytes showed high UV absorption at 254 nm (Table 3), the UV detector in the CherryOne system [21] was set at 254 nm. The whole CCS operation was monitored by both the PMA and the UV (Fig. 2). The K values were also recorded by the CherryOne system (data not shown). Guided by the PMA and UV absorption values, GCWat and the test target analyte were separated by using the small-volume CCS (Fig. 2). GCWat and the target metabolites were then collected into separate fractions. Furthermore, after drying of the fractions by vacuum centrifugal evaporation, the GCWat containing fraction still retained the NADES characteristics of viscous liquids. The target metabolite containing fraction could also be recognized by the presence of a colored solid residue. Additional qualitative and quantitative analyses focusing on both fractions were also performed.
3.4.1. Characterization of the GCWat containing fraction
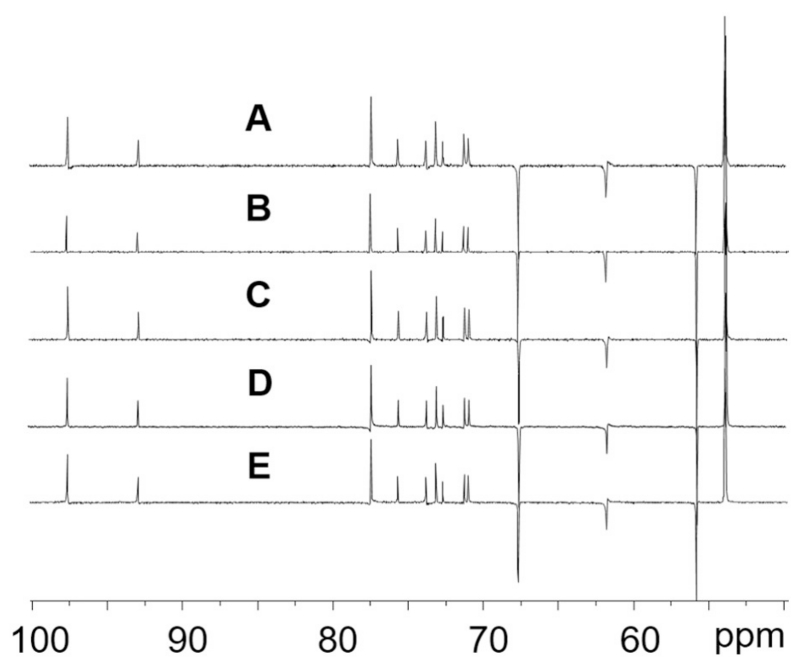
The GCWat containing fraction was dissolved in DMSO-d6 for DEPT-135 NMR analysis (Fig 3). Compared to unprocessed GCWat, the data demonstrated that the NADES containing fractions consist of both glucose and choline chloride. This is consistent with the high polarity of both glucose and choline chloride. Under the chosen CCS conditions, the K values of the two components are nearly identical, explaining why both are unseparated and occurred as a mixed fraction. The strong, more highly ordered hydrogen bonding among the GCWat components (Fig. 1) also explains why GCWat components consistently form a liquid. Moreover, this supports the hypothesis that NADES such as GCWat can form larger structures such as liquid crystals [1], which could affect the solubility and stabilizing ability of NADES species. Depending on the size and shape of the liquid crystals, NADES may also produce micro- or even nano-particles of the lipophilic bioactive constituents [24]. This mechanism may increase further the solubility of bioactives in physiological and similar environments, such as in vitro assays. Furthermore, due to reduced aqueous solubility, any lipophilic bioactive lead compounds are transported from the lipophilic cellular membranes to hydrophilic extracellular fluids at a slower rate. Meanwhile, protein binding in extracellular submucosal tissue can cause lower compound permeability. Collectively, these effects represent major challenges in small molecule absorption [25,26]. As NADES and NADES-like components are abundant in crude botanical extracts, lipophilic bioactive components can be loaded into a hydrophilic environment. It is conceivable that this can have a potential impact on the pharmacokinetic behavior of lipophilic metabolites. The unusual solubilizing power of NADES for a wide range of natural products and the duality (lipophilicity and hydrophilicity) of this formulation suggest a unique role in small molecule formulation, which may represent an inherent advantage of crude herbal dietary supplements and traditional medicinal preparations.
Fig. 3.
DEPT-135 NMR spectra of the GCWat containing fractions from different recovery studies. A to D were all GCWat containing fractions from different NADES-test sample solutions. A was from GCWat-rutin matrix, B was from GCWat-quercetin matrix, C was from GCWat-kaempferol matrix and D was from GCWat-daidzein matrix. E was the standard GCWat sample.
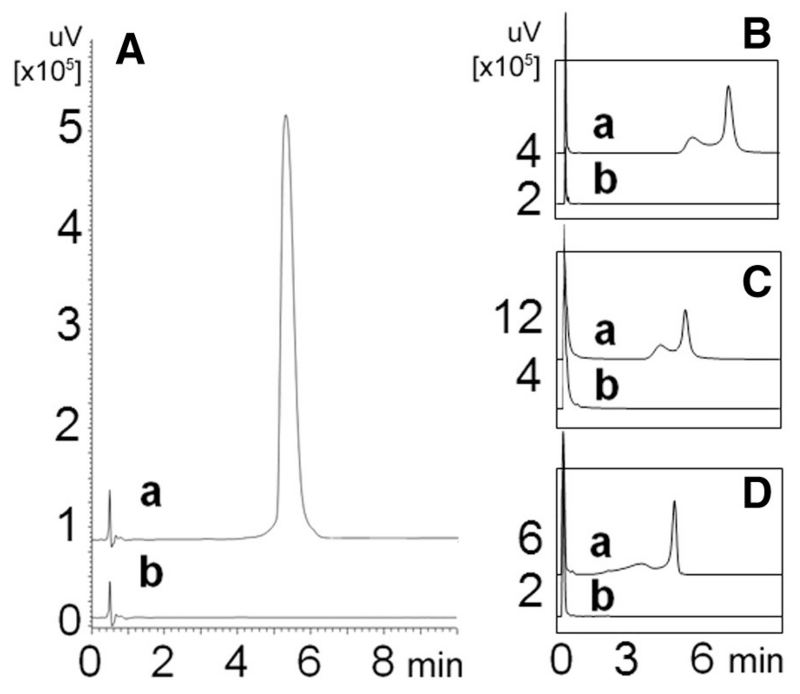
UHPLC analyses (Table 3) showed that the GCWat containing fraction did not contain traces of the target analytes (Fig. 4). This clearly demonstrated that CCS offered highly efficient separation and allows a quantitative (full) recovery of the target analyte from NADES matrices.
Fig. 4.
UHPLC results on GCWat containing fractions from different recovery studies. In the chromatograms, (a) represents the reference standard sample and (b) the GCWat containing fraction. The GCWat containing fractions A, B, C, and D were recovered from rutin-GCWat solution, quercetin-GCWat solution, kaempferol-GCWat, and daidzein-GCWat solution, respectively.
3.4.2. Characterization of the target analyte containing fraction
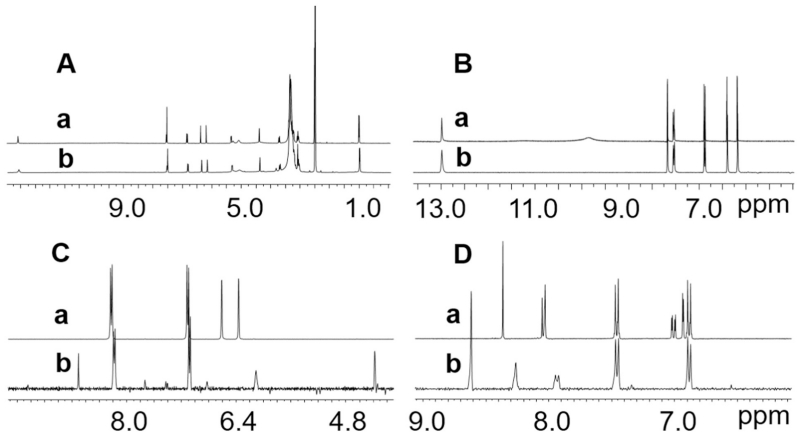
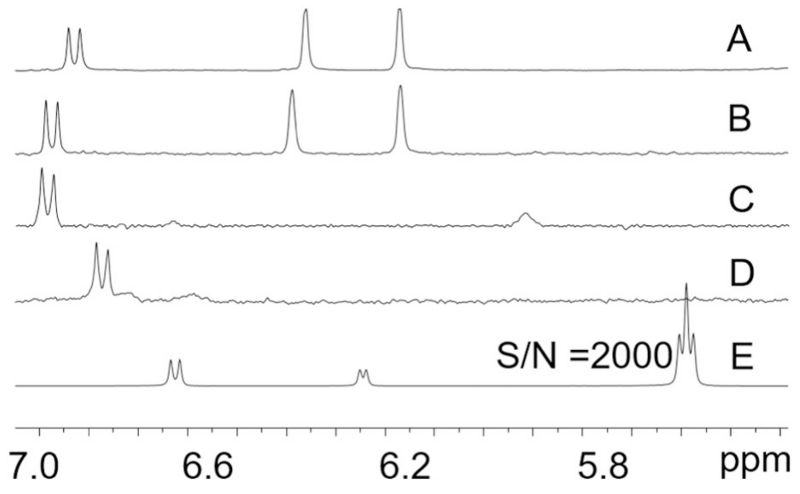
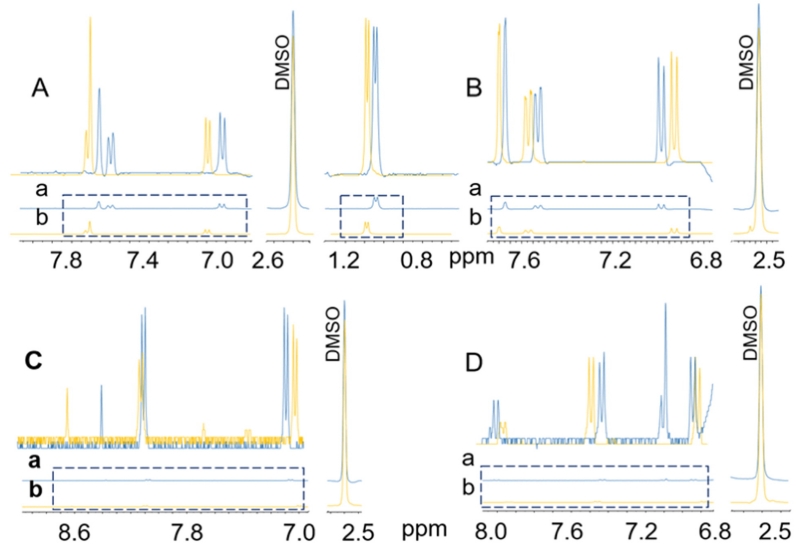
The target analyte containing fractions were characterized by 1H NMR (Fig. 5) and compared with reference standards of the same analytes. The GCWat components were completely absent from the target analyte containing fractions (Fig. 6). As shown in Fig. 6 E, the signal at 5.591 ppm (CH2 of choline chloride) had a signal to noise ratio of 2000. In contrast, none of the recovered samples (Fig. 6 A, B, C, and D) showed such a signal. The recovery of NADES was >99% in all CCS runs. The same result can be calculated based on the signals of glucose at 6.238 ppm and 6.625 ppm. The results from the CherryOne system (PMA and UV at 254 nm), UHPLC, 1H NMR, qHNMR, and 13C NMR combined all showed signals of NADES components, indicating that the target analyte was recovered from the NADES-analyte matrix. As a nondestructive and near universal detection method, qHNMR is ideal for quantitative analysis. Because it is a mole-based determination, qHNMR does not need an identical, high purity, calibrant for the establishment of a standard curve [20]. Additionally, based on the UHPLC results, there was a small peak with a close retention time and a major absorption (Fig. 4B, C and D). This may be caused by low flow rate or high loading concentration. A potentially compromised specificity was avoided by the use of qHNMR, which was applied to quantify the recovery of each target analyte from the GCWat-analyte solution. The pre-calibrated DMSO-d5 residual solvent signal area was used as the internal calibrant. The qHNMR sample preparation and acquisition parameters were identical for all samples. Because the GCWat-test analyte solution was concentrated in the GCWat component, the receiver gain was set to a low level (14.3). The resulting signal areas corresponding to the test sample were normalized to the internal calibrant area (Fig. 7). Because qHNMR provides a molar ratio, the volumes of the solutions were also measured for the recovery calculation. The recovery of each target analyte was then calculated by Eq. 1 and the results were as follows: rutin, 95.7%; quercetin, 94.6%; kaempferol, 97.0%; daidzein, 96.7%.
Fig. 5.
1H NMR spectra of target metabolite containing fractions from different recovery studies. In the spectra, (a) standard reference sample and (b) the test sample containing fraction. A, B, C and D represent rutin, quercetin, kaempferol and daidzein, respectively.
Fig. 6.
Test sample containing fractions from different recovery studies were detected by qHNMR. The recovered samples were rutin (A), quercetin (B), kaempferol (C) and daidzein (D). E represents the standard GCWat sample.
Fig. 7.
The qHNMR spectra used for calculation of the recovery (%) using DMSO solvent signal area as internal calibrant standard. (a) the aliquot positive control, in blue. (b) the recovered test sample, in yellow. A, B, C and D represent rutin, quercetin, kaempferol, and daidzein, respectively. (For interpretation of the references to color in this figure legend, the reader is referred to the web version of this article.)
| (1) |
where Intpost-ccc is the signal area of the recovered sample, Intpre-ccc is the signal area of the aliquot positive control, Vr is the volume of the recovered sample dissolved in 600 μL of NMR solvent, Vs is the aliquot positive control dissolved in 600 μL of NMR solvent, and R represents the recovery (%).
3.4.3. Evaluation of the recovery study
Performed in reversed phase mode, CCS showed a high separation resolution and was capable of recovering target analytes from NADES matrices quantitatively. While, NADES covers a comparatively broad K value range (Fig. 2), potentially causing a low separation resolution, this was not the limitation in the present study. In natural product research, the extract matrix often contains metabolites that are dispersed in a very broad range of K values. The target compounds of interest are typically not expected to overlap the K value range of NADES. However, in reversed phase mode, small-volume CCS may still not achieve the desired separation in some cases. There are two possible solutions to this issue: (i) A normal phase mode separation can be performed, using the organic phase as mobile phase. Under these conditions, NADES will stay in the tail of the elution because of their high affinity for the aqueous stationary phase, which is far away from the desired K value sweet spots. Once an appropriate solvent system is found for the target natural products, there will be a highly sufficient K value range for the separation of target analytes. (ii) A large scale of CCS can be employed. As a given analyte has a constant K value in a specific solvent system, CCS can be scaled up linearly and beyond the small-volume scale, based on the needs of a specific project. E.g., a medium capacity (~320 mL) CCS can increase the separation resolution by 20-fold beyond the small-volume scale. For example, in a 16 mL HSCCC, GCWat was eluted in K value range from 0 to 0.8. In a 320 mL HSCCC, the same amount of GCWat will be only eluted into the K value range from 0 to 0.04 in theory. However, either normal phase mode using small-volume CCS or a medium capacity CCS will increase the amount of solvents consumed and the time of the separation cycle. Therefore, prior to a CCS operation, an appropriate operation mode and scale should be reasonably selected according to the specific needs.
4. Conclusions
CCS can successfully recover target metabolites from NADES-containing botanical and other matrices. The observed recoveries of targets ranged from 94.6% to 97%. The small remaining gap of 3–5% likely reflects practical limitations including liquid handling and weighing, rather than intrinsic limitations of CCS. CCS allows both targeted and broad polarity-based recovery with high efficiency. The key aspects of method design were as follows: (i) the GUESS method was applied to rapidly select the CCS solvent systems, thus, helping accelerate process development; (ii) the CherryOne operating system used in this study allowed simultaneous acquisition of UV, PMA, Sf, and K values for each test sample in real time. Moreover, because of a characteristic dispersive PMA signal, the GCWat components, i.e., glucose and choline chloride, could be detected during CCS elution; (iii) the target metabolites (bioactive ingredients) and GCWat (NADES) components in the matrix may be quantified by qHNMR, using methods equally suitable for the botanical extract. Notably, quantification of the highly polar primary metabolites by qHNMR avoids the requirement of special liquid chromatography columns needed for “primary” metabolite analyses.
This CCS recovery strategy overcomes the disadvantage of conventional LC methods and can have significant impact on the following three fields of application: (i) CCS effectively solves the recovery challenge when using NADES as extraction media: regardless whether NADES are contained in the extraction medium, are part of an experimental design, or occur as a natural phenomenon, the extracted bioactive ingredients can be recovered, and the NADES can be recycled as they remain intact after CCS. This could lead to a potential contribution to the development of green chemistry. (ii) The primary metabolites in the botanical extract can be “cleanly” knocked out from extracts using the strategy in this study. This enables the investigation of the potential (synergistic) function of NADES in natural product extracts. (iii) The present CCS strategy can be used to isolate certain bioactive metabolite(s) and/or knock out metabolites that represent invalid metabolic panaceas (IMPs) [18] from botanical extracts. For advanced bioactivity determination, CCS can enrich these target bioactive metabolite(s) and/or remove the designed IMPs as a new means of assessing the negative bioassay interference caused by these compounds.
Acknowledgements
This work was supported by grant P50 AT000155 from the ODS and NCCIH of the NIH. Furthermore, support from the team at Cherry Instruments, Wrightwood Technologies (Chicago, IL), in particular by Samuel Pro and Warren Friedel, is gratefully acknowledged.
Footnotes
Conflict of interest
The authors declare no conflicts of interest.
References
- [1].Choi YH, van Spronsen J, Dai Y, Verberne M, Hollmann F, Arends IW, et al. Are natural deep eutectic solvents the missing link in understanding cellular metabolism and physiology? Plant Physiol. 2011;156:1701–1705. doi: 10.1104/pp.111.178426. [DOI] [PMC free article] [PubMed] [Google Scholar]
- [2].Dai Y, van Spronsen J, Witkamp GJ, Verpoorte R, Choi YH. Natural deep eutectic solvents as new potential media for green technology. Anal. Chim. Acta. 2013;766:61–68. doi: 10.1016/j.aca.2012.12.019. [DOI] [PubMed] [Google Scholar]
- [3].Firn RD, Jones CG. A Darwinian view of metabolism: molecular properties determine fitness. J. Exp. Bot. 2009;60:719–726. doi: 10.1093/jxb/erp002. [DOI] [PubMed] [Google Scholar]
- [4].Dai Y, Verpoorte R, Choi YH. Natural deep eutectic solvents providing enhanced stability of natural colorants from safflower (Carthamus tinctorius) Food Chem. 2014;159:116–121. doi: 10.1016/j.foodchem.2014.02.155. [DOI] [PubMed] [Google Scholar]
- [5].Dai Y, Witkamp GJ, Verpoorte R, Choi YH. Natural deep eutectic solvents as a new extraction media for phenolic metabolites in Carthamus tinctorius L. Anal. Chem. 2013;85:6272–6278. doi: 10.1021/ac400432p. [DOI] [PubMed] [Google Scholar]
- [6].Dai Y, van Spronsen J, Witkamp GJ, Verpoorte R, Choi YH. Ionic liquids and deep eutectic solvents in natural products research: mixtures of solids as extraction solvents. J. Nat. Prod. 2013;76:2162–2173. doi: 10.1021/np400051w. [DOI] [PubMed] [Google Scholar]
- [7].Pauli GF, Pro SM, Friesen JB. Countercurrent separation of natural products. J. Nat. Prod. 2008;71:1489–1508. doi: 10.1021/np800144q. [DOI] [PubMed] [Google Scholar]
- [8].Friesen JB, McAlpine JB, Chen SN, Pauli GF. Countercurrent separation of natural products: an update. J. Nat. Prod. 2015;78:1765–1796. doi: 10.1021/np501065h. [DOI] [PMC free article] [PubMed] [Google Scholar]
- [9].Ito Y. High-speed countercurrent chromatography. Nature. 1987;326:419–420. doi: 10.1038/326419a0. [DOI] [PubMed] [Google Scholar]
- [10].Liu Y, Friesen JB, McAlpine JB, Pauli GF. Solvent system selection strategies in countercurrent separation. Planta Med. 2015;81:1582–1591. doi: 10.1055/s-0035-1546246. [DOI] [PMC free article] [PubMed] [Google Scholar]
- [11].Berthod A, Mekaoui N. Distribution ratio, distribution constant and partition coefficient. Countercurrent chromatography retention of benzoic acid. J. Chromatogr. A. 2011;1218:6024–6030. doi: 10.1016/j.chroma.2010.12.027. [DOI] [PubMed] [Google Scholar]
- [12].Li C, Li D, Zou S, Li Z, Yin J, Wang A, et al. Extraction desulfurization process of fuels with ammonium-based deep eutectic solvents. Green Chem. 2013;15:2793–2799. [Google Scholar]
- [13].Abbott AP, Capper G, Davies DL, Rasheed RK, Tambyrajah V. Novel solvent properties of choline chloride/urea mixtures. Chem. Commun. (Camb.) 2003;9:70–71. doi: 10.1039/b210714g. [DOI] [PubMed] [Google Scholar]
- [14].Friesen JB, Pauli GF. Rational development of solvent system families in counter-current chromatography. J. Chromatogr. A. 2007;1151:51–59. doi: 10.1016/j.chroma.2007.01.126. [DOI] [PubMed] [Google Scholar]
- [15].Booth NL, Overk CR, Yao P, Totura S, Deng Y, Hedayat AS, et al. Seasonal variation of red clover (Trifolium pratense L., Fabaceae) isoflavones and estrogenic activity. J. Agric. Food Chem. 2006;54:1277–1282. doi: 10.1021/jf052927u. [DOI] [PMC free article] [PubMed] [Google Scholar]
- [16].Booth NL, Overk CR, Yao P, Burdette JE, Nikolic D, Chen SN, et al. The chemical and biologic profile of a red clover (Trifolium pratense L.) phase II clinical extract. J. Altern. Complement. Med. 2006;12:133–139. doi: 10.1089/acm.2006.12.133. [DOI] [PMC free article] [PubMed] [Google Scholar]
- [17].Liu J, Burdette JE, Xu H, Gu C, van Breemen RB, Bhat KP, et al. Evaluation of estrogenic activity of plant extracts for the potential treatment of menopausal symptoms. J. Agric. Food Chem. 2001;49:2472–2479. doi: 10.1021/jf0014157. [DOI] [PubMed] [Google Scholar]
- [18].Bisson J, McAlpine JB, Friesen JB, Chen S-N, Graham J, Pauli GF. Can invalid bioactives undermine natural product-based drug discovery? J. Med. Chem. 2016;59:1671–1690. doi: 10.1021/acs.jmedchem.5b01009. [DOI] [PMC free article] [PubMed] [Google Scholar]
- [19].Friesen JB, Pauli GF. G.U.E.S.S.—a generally useful estimate of solvent systems for CCC. J. Liq. Chromatogr. Relat. Technol. 2005;28:2777–2806. [Google Scholar]
- [20].Liu Y, Chen SN, McAlpine JB, Klein LL, Friesen JB, Lankin DC, et al. Quantification of a botanical negative marker without an identical standard: ginkgotoxin in Ginkgo biloba. J. Nat. Prod. 2014;77:611–617. doi: 10.1021/np400874z. [DOI] [PubMed] [Google Scholar]
- [21].Pauli GF, Pro SM, Chadwick LR, Burdick T, Pro L, Friedl W, et al. Real-time volumetric phase monitoring: advancing chemical analysis by countercurrent separation. Anal. Chem. 2015;87:7418–7425. doi: 10.1021/acs.analchem.5b01613. [DOI] [PMC free article] [PubMed] [Google Scholar]
- [22].Frank HS, Wen W-Y. Ion-solvent interaction. Structural aspects of ion-solvent interaction in aqueous solutions: a suggested picture of water structure. Discuss. Faraday Soc. 1957;24:133–140. [Google Scholar]
- [23].Liu Y, Friesen JB, Klein LL, McAlpine JB, Lankin DC, Pauli GF, et al. The Generally Useful Estimate of Solvent Systems (GUESS) method enables the rapid purification of methylpyridoxine regioisomers by countercurrent chromatography. J. Chromatogr. A. 2015;1426:248–251. doi: 10.1016/j.chroma.2015.11.046. [DOI] [PMC free article] [PubMed] [Google Scholar]
- [24].Ma B-L, Yin C, Zhang B-K, Dai Y, Jia Y-Q, Yang Y, et al. Naturally occurring proteinaceous nanoparticles in Coptidis Rhizoma extract act as concentration-dependent carriers that facilitate berberine absorption. Sci. Report. 2016;6:20110. doi: 10.1038/srep20110. [DOI] [PMC free article] [PubMed] [Google Scholar]
- [25].Artursson P, Palm K, Luthman K. Caco-2 monolayers in experimental and theoretical predictions of drug transport. Adv. Drug Deliv. Rev. 2001;46:27–43. doi: 10.1016/s0169-409x(00)00128-9. [DOI] [PubMed] [Google Scholar]
- [26].Lipinski CA, Lombardo F, Dominy BW, Feeney PJ. Experimental and computational approaches to estimate solubility and permeability in drug discovery and development settings. Adv. Drug Deliv. Rev. 2001;46:3–26. doi: 10.1016/s0169-409x(00)00129-0. [DOI] [PubMed] [Google Scholar]


