Significance
Hemoglobin is generally assumed to be the only globin in vertebrate RBCs. In addition to its foremost role as an oxygen carrier, mammalian hemoglobin can also operate as a nitrite reductase, producing the signaling molecule nitric oxide (NO) from nitrite. Over the last 15 yr, several novel globins have been identified with six-coordinate heme geometry and uncertain physiological functions. Here we report that a six-coordinate globin of ancient origin, named Globin X, is present in fish RBCs. We establish that Globin X is a fast nitrite reductase, and this activity can regulate NO production from fish RBCs and modulate platelet activation. Thus we provide evidence that the ancestral globins in blood were efficient nitrite reductases.
Keywords: nitrite, nitric oxide, blood, RBC, platelet
Abstract
The discovery of novel globins in diverse organisms has stimulated intense interest in their evolved function, beyond oxygen binding. Globin X (GbX) is a protein found in fish, amphibians, and reptiles that diverged from a common ancestor of mammalian hemoglobins and myoglobins. Like mammalian neuroglobin, GbX was first designated as a neuronal globin in fish and exhibits six-coordinate heme geometry, suggesting a role in intracellular electron transfer reactions rather than oxygen binding. Here, we report that GbX to our knowledge is the first six-coordinate globin and the first globin protein apart from hemoglobin, found in vertebrate RBCs. GbX is present in fish erythrocytes and exhibits a nitrite reduction rate up to 200-fold faster than human hemoglobin and up to 50-fold higher than neuroglobin or cytoglobin. Deoxygenated GbX reduces nitrite to form nitric oxide (NO) and potently inhibits platelet activation in vitro, to a greater extent than hemoglobin. Fish RBCs also reduce nitrite to NO and inhibit platelet activation to a greater extent than human RBCs, whereas GbX knockdown inhibits this nitrite-dependent NO signaling. The description of a novel, six-coordinate globin in RBCs with dominant electron transfer and nitrite reduction functionality provides new insights into the evolved signaling properties of ancestral heme-globins.
In recent years a number of novel six-coordinated globins have been identified in vertebrates (1). The function of these proteins remains largely unknown. Globin X (GbX) is a novel globin found in fish, amphibians, and reptiles that diverged early from a common ancestor to hemoglobin (Hb) and myoglobin (Mb) (2, 3), thus representing a landmark in the evolution of the globins, probably carrying out functions that were later taken over by other globins in higher vertebrates. Because six-coordinate globins have proximal and distal histidines that bind the heme iron and are expressed at low concentrations, it has been hypothesized that they did not evolve for oxygen storage and transport, but rather participate in reactive oxygen and nitrogen species metabolism or other processes (1, 4).
It is now well accepted that the allosterically regulated reduction of nitrite by Hb generates nitric oxide (NO) (5, 6). Whether this NO produced can escape the RBC and signal in a physiologically relevant manner remains controversial. In platelets, NO is one of the main vascular factors responsible for the inhibition of platelet activation (7, 8). Once NO is produced, despite its short half-life, it diffuses in the plasma and smooth muscle and acts as a signaling molecule through activation of soluble guanylate cyclase (sGC) (9). sGC activation catalyzes the formation of the second messenger cGMP and subsequent inhibition of intracellular calcium release, resulting in decreased platelet aggregation. Recent studies from multiple laboratories show that low concentrations of nitrite in the presence of RBCs inhibit human platelets activation in vitro and in vivo in mice and humans (10–12). It has been demonstrated that in low oxygen conditions, Hb functions as a nitrite reductase, generating NO from nitrite and thus producing an antiaggregation effect on platelets (13, 14). It is not known whether this nitrite reductase role of Hb is reminiscent of a function present in earlier globins or has been acquired later during globin evolution.
To date, the dominating paradigm has been that Hb is the only globin present in blood. Recent reports suggest that other globin proteins may also be present in vertebrate RBCs, but their presence has not yet been proven (15). Here we demonstrate that GbX is also present in fish erythrocytes. To elucidate its function, we carried out histological, biophysical, and signaling studies of the fish GbX and we show its potential role as a potent nitrite reductase in the blood.
Results
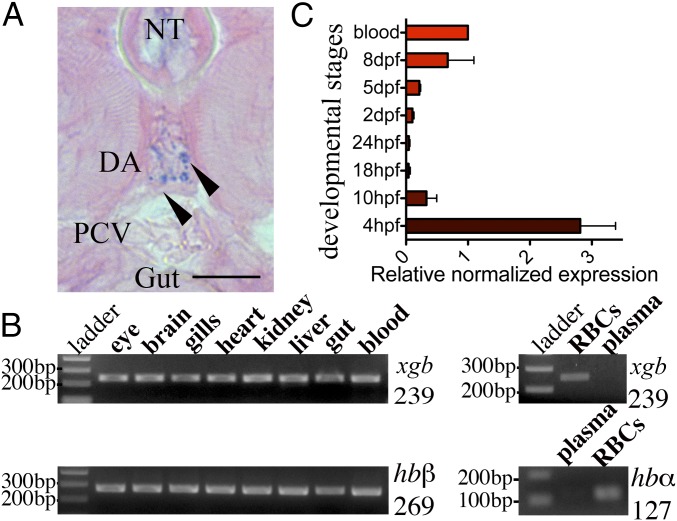
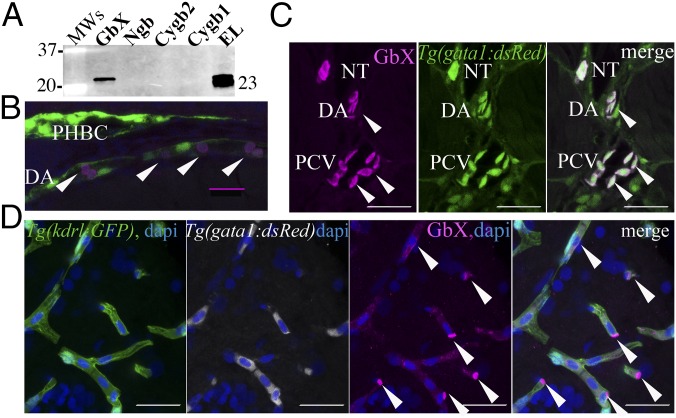
The sequence analysis of GbX shows highest identity scores with neuroglobin (Ngb) (25–35%) (2, 3, 16) and suggests that phylogenetically they derive from the same common ancestor that diverged ∼800 million yr ago from the evolutionary branch of Hb, Mb, and cytoglobin (Cygb) (Fig. S1) (17). During our analysis of zebrafish Globin X gene transcript (xgb) expression in different tissues, we were surprised to observe apparent expression in the RBCs, rather than restriction to the brain and retina as previously described (18). xgb mRNA can be identified by in situ hybridization at 48 h postfertilization (hpf) in the circulating cells within the main axial vessels (Fig. 1A). RT-PCR performed using several adult tissues shows ubiquitous expression of xgb in all of the tissues analyzed apart from plasma, similarly to Hb α (hbα) and Hb β (hbβ), well-known blood proteins (Fig. 1B). Previous developmental xgb expression profiling showed significant levels only in unfertilized eggs (19). Here we found the highest expression at 4 hpf, likely of maternal origin, and a gradual increase from 18 hpf to the adult stage (Fig. 1C). Other globins, such as Ngb, have been previously detected at the transcript level in adult fish RBCs (15). We compared the expression levels of xgb and ngb in zebrafish blood and found that the amount of xgb mRNA is 10-fold higher than ngb (Fig. S2). This is unexpected as studies in stickleback showed opposite results, with 500-fold higher levels of ngb mRNA (15). To further determine the protein cellular localization, we produced recombinant zebrafish GbX protein and generated a custom anti-GbX antibody. Due to the high similarity to other six-coordinate globins, we first tested the antibody specificity by Western blotting analysis against the zebrafish recombinant proteins Cygb1, Cygb2, Ngb, and GbX. The 23-kDa band corresponding to GbX is detectable only in the recombinant GbX sample. Moreover, a similar and unique band is observed in the 28-hpf embryo lysate (EL) (Fig. 2A). The identity of the protein was confirmed by mass spectrometry analysis (data not shown). We performed colocalization experiments using transgenic zebrafish that carry a marker for vascular endothelial cells [Tg(kdrl:GFP)]. Immunohistochemistry of Tg(kdrl:GFP) embryos at 28 hpf shows GbX+ cells inside the vessel lumen (Fig. 2B). Moreover GbX antibody staining colocalizes with the Gata1:DsRed transgene, an early marker of erythrocytes, at 48 hpf (Fig. 2C). To assess a possible neuronal expression pattern of GbX, we analyzed the adult brain tissue in the double transgenic Tg(kdrl:GFP; Gata1:DsRed). Surprisingly, the detected GbX protein was localized in the erythrocytes found in the adult brain (Fig. 2D). In contrast to the previous report (18), these data provide evidence that GbX is a newly discovered blood heme-globin.
Fig. S1.
Evolutionary tree of the globins from Homo sapiens and Danio rerio.
Fig. 1.
The GbX gene is expressed in the RBCs. (A) In situ hybridization performed with an antisense riboprobe synthesized against the whole xgb transcript. Whole mount embryos at 48 hpf were embedded in JB-4, cross-sectioned, and visualized by optical microscopy. Arrowheads indicate a positive staining within the main axial vessels. DA, dorsal aorta; NT, notochord; PCV, posterior cardinal vein. (Scale bar: 20 µM.) (B) The xgb, hbα, and hbβ transcripts analyzed by RT-PCR were detectable in all of the tissues. When RBCs were separated from plasma, the xgb transcript was exclusively detected in RBCs. The expected amplified fragment sizes are indicated (Right) as well as the molecular markers (Left). (C) Increasing levels of xgb transcript were detectable after 18 hpf. Highest levels are detectable in the 4-hpf embryos. On the x axis, the fold change normalized to the adult blood is shown. Values are means ± SEM.
Fig. S2.
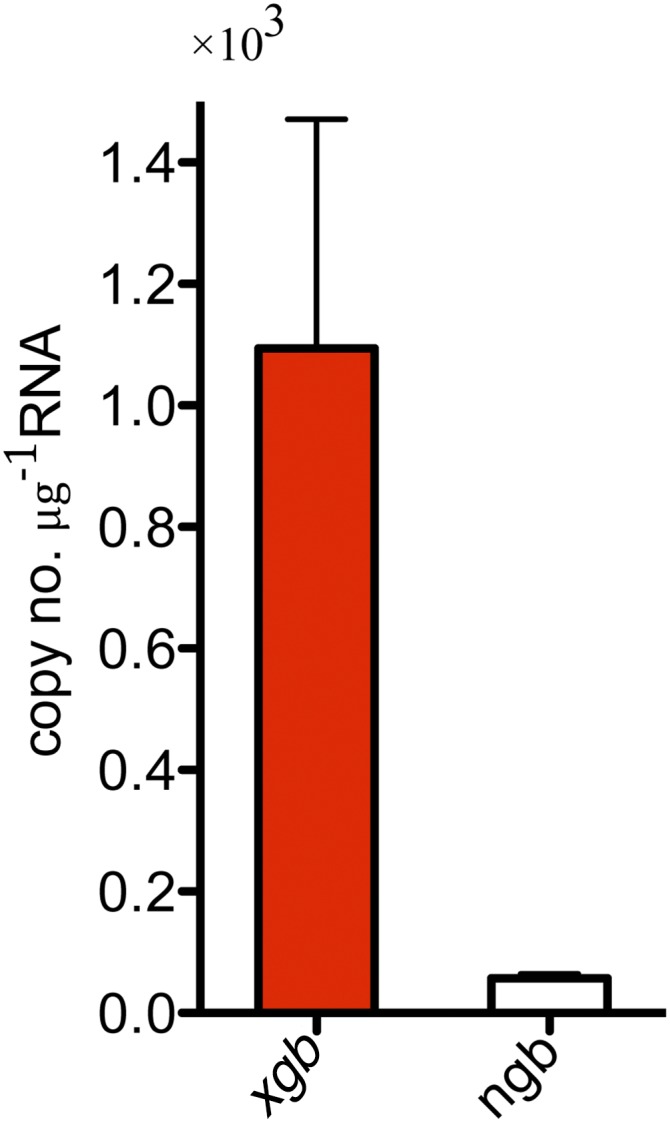
Absolute quantification of Gbx (xgb) and Ngb (ngb) transcripts in the zebrafish blood.
Fig. 2.
GbX is detectable in the RBCs throughout development. (A) The anti-GbX antibody reacts with the recombinant GbX, but not with the recombinants Ngb, Cygb2, or Cygb1 from D. rerio. The EL at 28 hpf showed detectable levels of the 23-kDa protein, corresponding to the GbX expected size. Molecular weights are indicated (Left) as well as the GbX size (Right). (B) Immunohistochemistry on longitudinal cryosections of a 28-hpf Tg(kdrl:GFP)la116 embryo using the anti-GbX antibody showed positive staining (magenta) within the main axial vessels. The endothelial cells are evidenced by the expression of the GFP (green) and nuclear DAPI signal is in blue. DA, dorsal aorta; PHBC, primordial hindbrain channel. (C) Immunohistochemistry on cross-cryosections of a 48-hpf Tg(gata1:dsRed)sd2 embryo indicates colocalization of GbX staining (magenta) with the dsRed transgene (green) in the RBCs. (D) GbX is detectable in the RBCs contained in the small endothelial vessels present in the adult brain. Immunohistochemistry was performed on adult brain cryosections using the double transgene Tg(kdrl:GFP)la116; Tg(gata1:dsRed)sd2. GbX is visualized in magenta, dsRed in white, GFP in green, and nuclear DAPI signal is in blue. Images are 2D confocal projections. (Scale bars: 20 μm.)
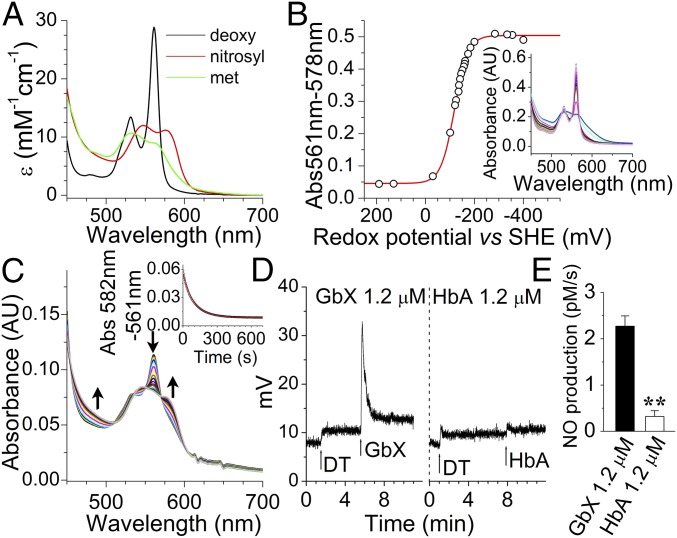
To better understand the biophysics of the protein, we cloned, expressed, and purified the full-length GbX in Escherichia coli. Similar to Ngb, but unlike Hb, the full-length GbX is a six-coordinate globin, as shown by the double peak absorbance at 531 nm and 561 nm in the deoxygenated state (Fig. 3A). We determined a redox potential for GbX of −119 ± 3 mV at 25 °C (Fig. 3B). This value is ∼200 mV more negative than oxygen carrier proteins such as Hb or Mb (5). More negative redox potentials have been associated with increased autoxidation rates in six-coordinate globins (20) and with faster nitrite reductase rates (5). We found that the autoxidation of the oxyGbX complex is relatively fast, with a decay rate of 0.32 ± 0.05 min−1 at 37 °C. This value implies a half-life of the oxyGbX complex of around 2.1 min and indicates that GbX is not particularly suited for oxygen-carrier functions.
Fig. 3.
GbX is a hexacoordinated globin and generates NO from nitrite. (A) Absorption spectra of the reduced (ferrous deoxy), nitrosyl and oxidized (met) forms of GbX. The reduced form of GbX shows peaks at 531 and 561 nm characteristic of six-coordinate heme proteins. (B) GbX redox potential determined by redox titration. Ferric GbX was reduced by stepwise addition of dithionite and then oxidized by stepwise addition of ferricyanide. The change in the absorbance between 561 and 578 nm fitted to the Nernst equation is shown. The Inset shows the spectral changes during the redox titration. A redox potential of −119 ± 3 mV was measured at 25 °C in 100 mM phosphate buffer at pH 7.0. The figure is one representative experiment of n = 4. (C) GbX nitrite reduction. DeoxyGbX reduces nitrite to NO with a rate constant of 26.7 ± 2.0 M−1⋅s−1. The spectral changes in the 450- to 700-nm range during the reaction are shown. The Inset shows the fit of the absorbance changes to a single exponential equation for the anaerobic reaction of 1 mM nitrite with GbX at 37 °C in the presence of 2.5 mM sodium dithionite in 100 mM sodium phosphate buffer, pH 7.4. (D) Chemiluminescence detection of NO production from 250 µM nitrite after injection of GbX or Hb. Arrows indicate the time of 500 µM sodium dithionite (DT) and protein injections into the system. One representative experiment of n = 4 is shown. (E) Rate of NO formation from nitrite at different concentrations of GbX or Hb, respectively. (Student’s t test **P = 0.002, n = 4.) Values are means ± SEM.
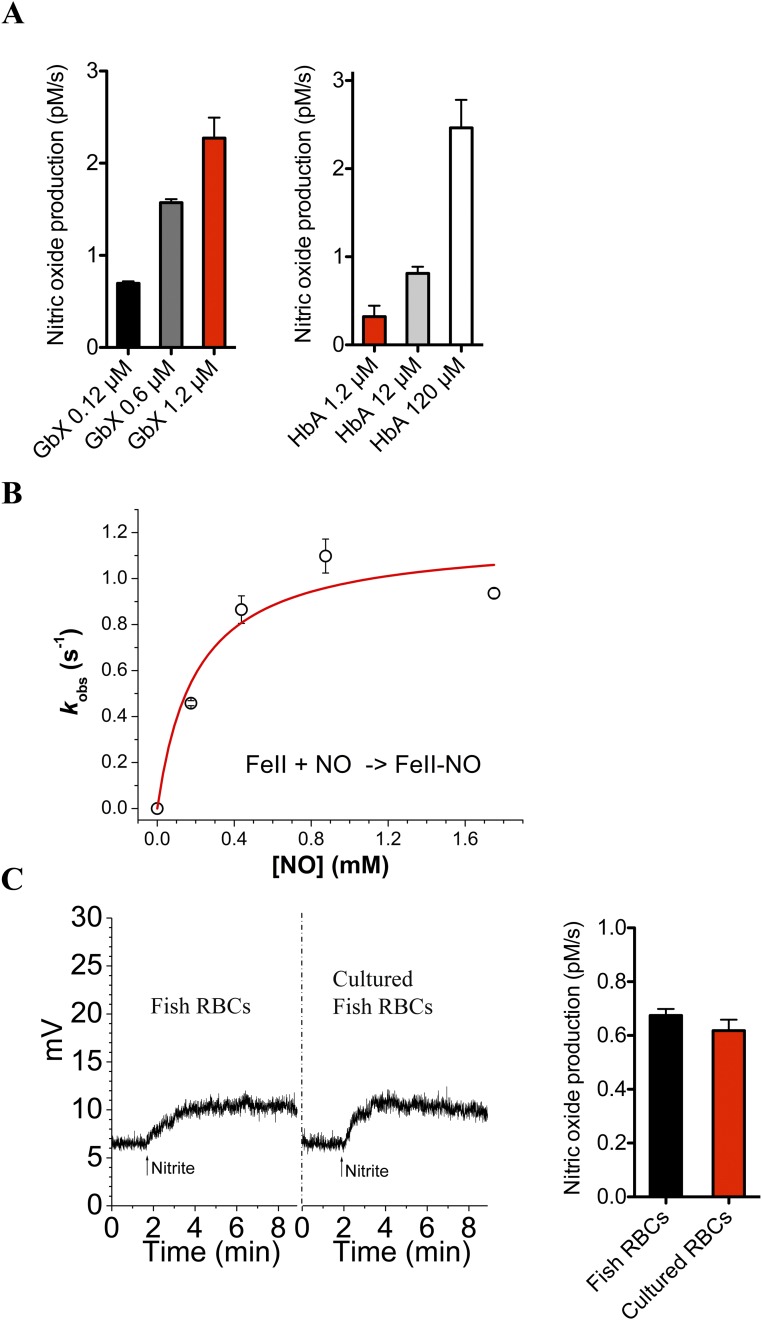
Hb and Mb are capable of nitrite reduction activity under conditions of low oxygen; to compare the reduction rates we determined the nitrite reductase rate of deoxyGbX in the absence of oxygen. GbX has a nitrite reduction bimolecular rate constant of 26.7 ± 2.0 M−1⋅s−1 at 37 °C (Fig. 3C); this rate is 5- to 10-fold faster than the value for Mb or R-state Hb, 25- to 50-fold faster than Ngb or Cygb, and 200-fold larger than T-state Hb (5, 21, 22). To assess the production of bioavailable NO from the reduction of nitrite, we used chemiluminescence detection techniques. DeoxyGbX or deoxyHb were mixed anaerobically with 10 mM nitrite in PBS. Fig. 3D shows representative trace signals of NO production. The injection of Hb caused NO release as described in previous studies (11, 23). However, the injection of deoxyGbX resulted in a greater release of NO into the gas phase compared with human deoxyHb. Comparison of the observed rates of NO production with 1.2 µM GbX and 120 µM Hb indicates a ∼100-fold higher NO release for GbX compared with Hb, consistent with the measured nitrite reduction rates (Fig. 3E and Fig. S3A). We also monitored NO binding to GbX, which seems to be limited by the dissociation of the distal histidine, as observed for other six-coordinated globins (24, 25) (Fig. S3B).
Fig. S3.
(A) Rate of NO formation from nitrite at different concentrations of GbX (Left) or adult Hb (HbA) (Right), respectively. (B) Observed rates of GbX–nitrosyl complex formation by the reaction of deoxyGbX with NO in sodium phosphate buffer, pH 7.4, 25 °C. Data points indicate the average ± SD. The trace indicates a fit of the data to a hyperbolic equation. Calculated Vmax = 1.18⋅s−1. (C) Chemiluminescence detection of NO production with 250 µM nitrite and 30 µM RBCs collected fresh or after 3 d of culture (Left). Arrows indicate the time of addition of nitrite. Rate of NO formation with fresh or cultured RBCs shows similar values in the two groups (Right).
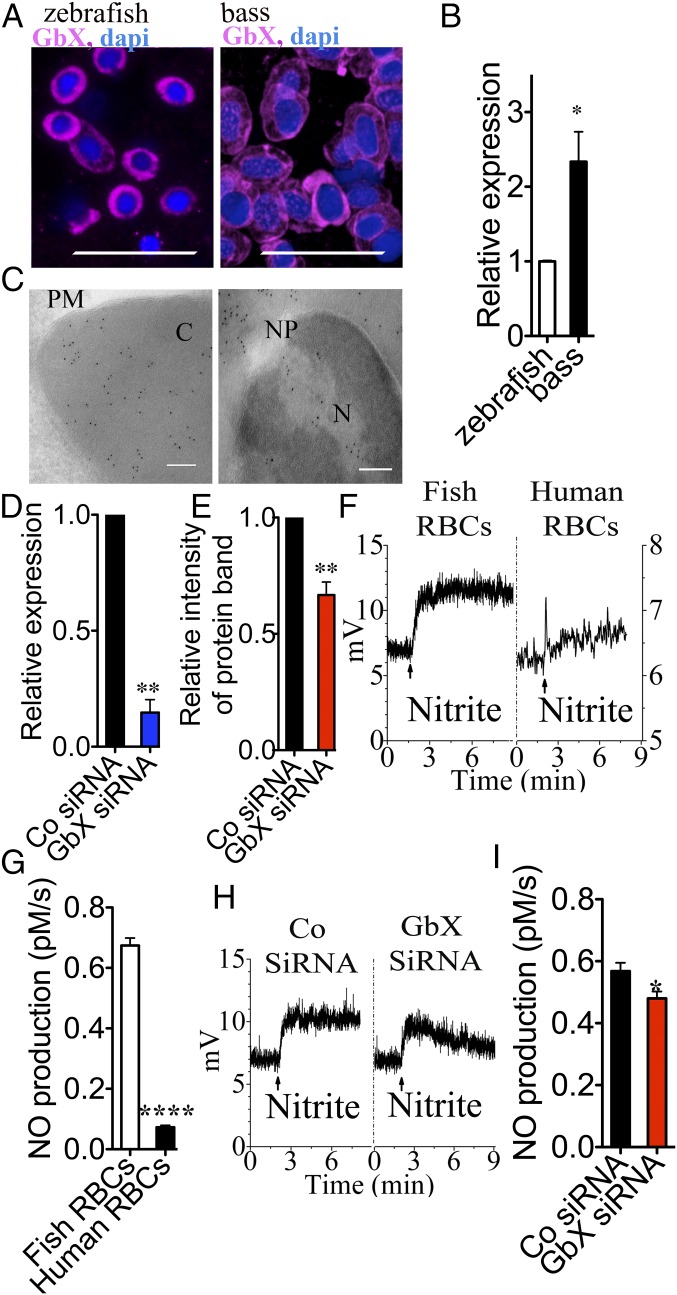
Due to the limited blood volume in zebrafish, we conducted additional studies in a larger fish, the striped bass (Morone saxatilis). GbX genes have been described for other fish such as goldfish and tilapia but not bass (26). We first analyzed bass blood to confirm the presence of GbX by immunohistochemistry with the anti-zebrafish GbX antibody (Fig. 4A). Quantification by quantitative RT-PCR (qRT-PCR) of the xgb transcript showed higher levels in bass compared with zebrafish (Fig. 4B). We also analyzed the intracellular localization of the protein in RBCs by immunogold labeling and transmission electron microscopy (TEM) analysis. GbX is clearly detectable in the cytoplasm of bass RBCs and nuclear pores (Fig. 4C). Previous reports described GbX as a membrane-bound globin (18); however, our results do not localize the protein in vivo at the plasma or nuclear membrane sites specifically. It should be noted that the cellular localization of GbX might be regulated by posttranslational modifications or alternative splicing of the N terminus segment that includes the putative myristoylation/palmitoylation motif. Therefore, the migration of GbX to membranes in response to unknown stimuli remains possible.
Fig. 4.
Fish RBCs cultured in vitro. (A) GbX is conserved among teleosts. GbX was detected in adult blood of zebrafish and striped bass by immunohistochemistry. (Scale bar: 20 μm.) (B) xgb transcript in the bass blood is higher than zebrafish (Student’s t test *P = 0.015, n = 3). (C) Cellular localization of GbX in bass RBCs by immunogold. (Scale bar: 100 nm.) EM analysis revealed cytoplasmic and nuclear localization of the protein. C, cytoplasm; N, nucleus; NP, nuclear pore; PM, plasma membrane. (D) xgb transcript quantification in cultured RBCs transfected with control siRNA or GbX siRNA. The 88 ± 5% knockdown of xgb transcript is shown (Student’s t test **P = 0.004, n = 4). (E) Protein quantification in cultured RBCs transfected with GbX siRNA relative to control siRNA transfected cells. The 33 ± 6% knockdown of the protein is shown (Student’s t test **P = 0.009, n = 4). (F) Chemiluminescence detection of NO production with 250 µM nitrite and fish RBCs (28 µM heme) or human RBCs (50 µM heme). (G) Rates of NO formation from bass RBCs and human RBCs (Student’s t test ****P < 0.0001, n = 3). (H) Chemiluminescence detection of NO production with 250 µM nitrite and fish RBCs (18 µM heme) transfected with control siRNA or GbX siRNA. (I) Rate of NO formation with cultured bass RBCs in the presence of either the control siRNA or GbX siRNA (Student’s t test *P = 0.027, n = 7). Values are means ± SEM.
To test our hypothesis that GbX is a nitrite reductase in fish blood, we used siRNAs in cultured RBCs from bass blood. Unlike mammalian RBCs, fish RBCs are nucleated and can be cultured and subjected to gene silencing experiments, which we validate herein. Primary bass RBCs were cultured for 3 d and transfected with control (scrambled) siRNA or GbX siRNA. We obtained 88% knockdown in the transcript levels of xgb (Fig. 4D) and 33% decrease in the protein levels (Fig. 4E). It should be noticed that RBCs in culture preserve endogenous GbX that may have slower turnover than the transcript. This could explain the discrepancy between transcript and protein levels in the knockdown RBCs. Chemiluminiscence NO detection was used to assess the relative nitrite reduction in human, fish, and GbX-knockdown RBCs (Fig. 4 F–I). First we compared the human RBCs with the bass RBCs. Heme concentration was used to quantify RBC heme proteins, noting that it measures the combined HbA and GbX levels. The representative NO signal generated by 28 µM heme of bass RBCs was sevenfold higher than for 50 µM heme of human RBCs (Fig. 4 F and G), consistent with the presence of GbX with enhanced nitrite-reductase activity. We then assessed the stability of our cultured bass RBCs by comparing the NO generation with fresh bass RBCs with the 3-d-cultured bass RBCs. No significant difference was detected in the NO production rates (Fig. S3C). We next analyzed the NO production in the GbX siRNA transfected RBCs in culture compared with scramble control siRNA transfected cells. Raw signals of NO generation detected by chemiluminescence are shown in Fig. 4H. The genetic knockdown of GbX significantly decreased the ability of fish RBCs to generate NO from nitrite (−15.5%) (Fig. 4I) with the larger concentration of intracellular Hb accounting for most of the NO generation in these conditions.
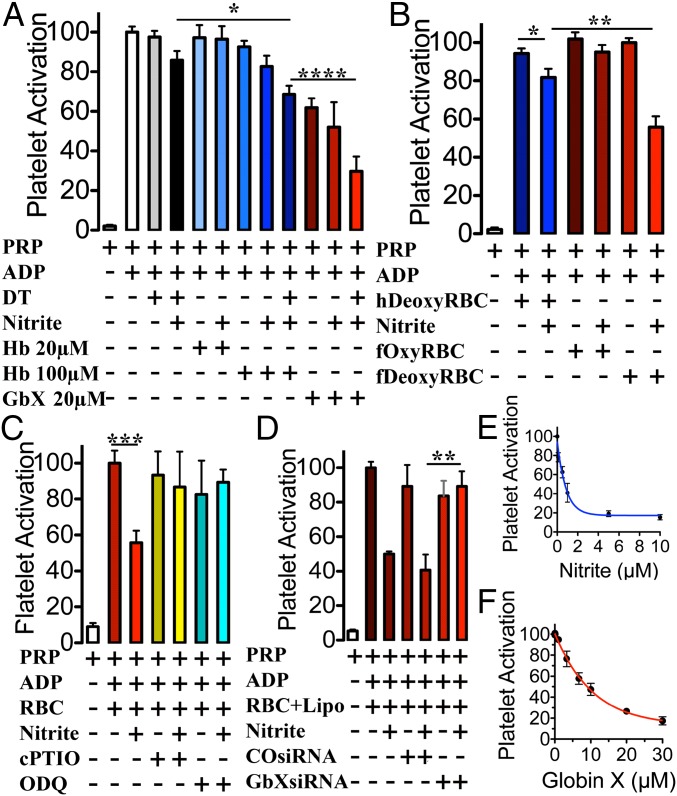
The reduction of nitrite to NO has been shown to activate a number of downstream pathways important in human physiology. In particular, Mb is the main regulator of the vasodilatory response in muscles (27) and Hb appears to be the main protein regulating NO production from nitrite in the human RBCs (11). As platelet activation is inhibited by NO, platelet activation assays are useful and biologically relevant models to assess the release of NO from nitrite reactions with globins and intact RBCs. The experimental conditions in these assays are more physiological, with signaling effects of nitrite observed with as low as 100 nM nitrite in the presence of deoxygenated RBCs (13). We tested the recombinant zebrafish GbX in the human platelet activation assay, comparing GbX to Hb (Fig. 5). We observed that nitrite inhibits platelet activation in the presence of human deoxyHb as previously reported (11, 13) (Fig. 5A). In the presence of 10 µM sodium dithionite, to deoxygenate samples, and 10 µM nitrite, 20 µM of recombinant GbX reduces platelet activation to a greater extent than 20 and 100 µM Hb (Fig. 5A). We also observed a strong inhibition of platelet activation by GbX and nitrite in the absence of sodium dithionite compared with the platelet-rich plasma (PRP) and ADP positive control; in contrast, no significant effect could be detected by 100 µM Hb and nitrite under aerobic conditions (Fig. 5A). These data support the hypothesis that GbX produces bioavailable NO from nitrite more efficiently than human Hb and suggest that electron transfer reactions from GbX can occur in the presence of molecular oxygen.
Fig. 5.
NO generation by GbX from nitrite inhibits platelet activation. (A) Recombinant GbX strongly inhibits platelet activation in the presence of 10 µM nitrite and 10 µM sodium dithionite at pH 7.4 and 37 °C. This inhibition was stronger for GbX than for human Hb, whereas both are statistically significant (Student’s t test ****P < 0.0001, *P = 0.023, respectively; n = 7). (B) Likewise, in the presence of 10 µM nitrite, fish deoxyRBCs inhibit platelet activation more than human deoxyRBCs, whereas both are statistically significant (Student’s t test **P = 0.005, *P = 0.038, respectively; n = 6). (C) There is no statistically significant inhibition of platelet activation by nitrite and fish deoxygenated RBCs in the presence of 500 µM cPTIO and 1 µM ODQ (Student’s t test ***P < 0.001, n = 3–9). (D) Specific knockdown of the xgb transcript in fish deoxygenated RBCs completely rescued the inhibitory effect of nitrite on platelet activation (Student’s t test **P = 0.003, n = 6). Values are means ± SEM. (E) Platelet activation in the presence of different concentrations of nitrite. The concentration of RBCs corresponds to 15% Hct (∼3 mM Hb). (F) Platelet activation in the presence of different concentrations of recombinant GbX. Nitrite concentration was 10 µM.
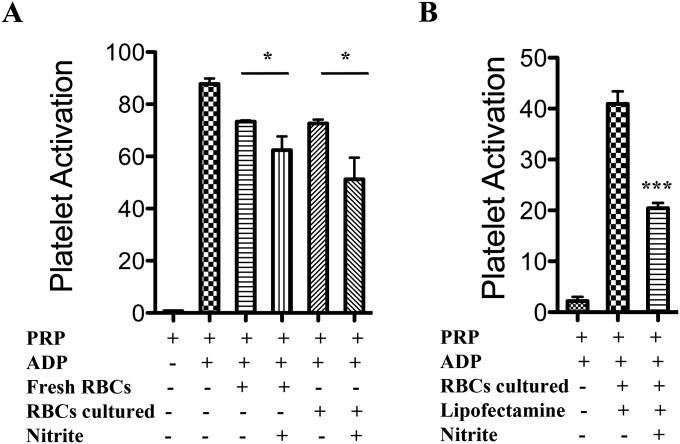
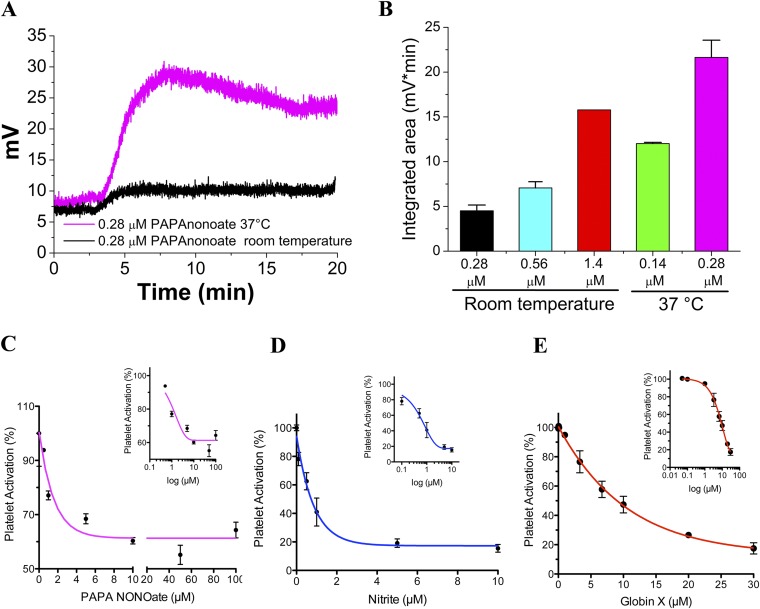
To further explore the mechanisms of nitrite-dependent reduction in platelet activation by fish RBCs, we compared human deoxygenated RBCs with the bass deoxygenated RBCs (Fig. 5B). The observed changes in platelet activation by human RBCs and nitrite are significant (P = 0.038) and consistent with previous results (11) (Fig. S4). The addition of fish deoxyRBCs to human PRP and ADP reduces platelet activation to a higher level than human deoxyRBCs in the presence of nitrite. To verify that the effect seen on platelets was due to the effect of NO generated from nitrite, we ran control experiments using 1H-[1,2,4]oxadiazolo[4,3-a]quinoxalin-1-one (ODQ) to selectively block the activity of sGC and 2-(4-carboxyphenyl)-4,4,5,5-tetramethylimidazoline-1-oxyl-3-oxide (cPTIO) as NO scavenger. In the presence of these compounds, the inhibition of platelet activation by nitrite and fish deoxyRBCs is completely abolished (Fig. 5C). To attempt knockdown studies, we first confirmed that cultured RBCs from bass have the same inhibitory effect on platelet activation as fresh RBCs. After 3 d in culture, the cells still preserve a strong inhibitory effect similarly to fresh RBCs (P = 0.034) (Fig. S5A). We then transfected the RBCs with a GbX siRNA and analyzed the nitrite bioactivation in the platelet assay. Knockdown of GbX completely abolished the inhibitory effect in platelet activation seen with scramble siRNA transfected cells (Fig. 5D and Fig. S5B). Thus, we conclude that GbX is largely responsible for the fish RBCs’ capacity to reduce nitrite and generate NO. This effect is magnified in fish blood compared with human blood, consistent with selective GbX expression in fish. It is unclear how the modest decrease in GbX protein (33%, Fig. 4E) does translate into a complete inhibition of platelet activation (Fig. 5D). To address this point, we have studied the dose–response curves of platelet activation for a NO donor [3-(2-hydroxy-2-nitroso-1-propylhydrazino)-1-propanamine (PAPA NONOate)], nitrite, and recombinant GbX (Fig. 5 E and F and Fig. S6). These curves show narrow ranges for the activation response of the platelets, although the ranges seem broad enough to provide a linear response in our experimental conditions (Fig. 5 E and F and Fig. S6). Conversely, our experimental data do indicate a significant effect of intracellular GbX on platelet activation in our system (Fig. 5D). This finding suggests a more potent effect of GbX on nitrite signaling in the fish RBCs that requires further investigation. It remains to be determined whether the function of GbX is also modulated by other factors such as compartmentalization and/or membrane localization, and these factors can induce a nonlinear behavior in nitrite–NO signaling.
Fig. S4.
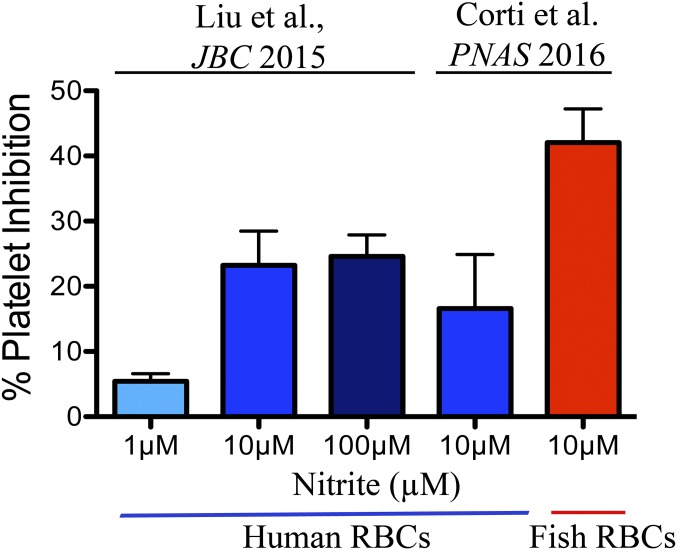
Comparison of platelet inhibition between the findings in ref. 11 and ours.
Fig. S5.
(A) Platelets activation with 10 µM ADP in presence of 10 µM nitrite and RBCs fresh or 3 d cultured. The two groups inhibited platelet activation to the same level and showed identical P values. No statistically significant difference could be detected in the two groups of RBCs. (Student’s t test *P = 0.034, n = 3). (B) Platelet activation with 1 µM ADP in the presence of 10 µM nitrite and cultured RBCs supplemented with lipofectamine (Student’s t test ***P < 0.001, n = 3).
Fig. S6.
Chemiluminescence detection of NO generation from different concentrations of PAPA NONOate at room temperature or at 37 °C (A and B). Platelet activation in the presence of different concentrations of PAPA NONOate (C), nitrite (D), or recombinant GbX (E). For the experiments in D, the concentration of RBCs corresponds to 15% Hct (∼3 mM Hb). For the experiments in E, the concentration of nitrite is 10 µM.
Discussion
Zebrafish GbX was first characterized as a neuronal globin, found predominantly in the zebrafish eye and brain (18). However, the tissue distribution of GbX seems quite inconsistent compared with the two other species where GbX has been studied, namely goldfish (Carassius auratus) (2) and frog (Xenopus laevis) (28). In both species, the mRNA seems to be absent in brain tissue, and the mRNA levels seem similar across different tissues with sporadic increases in Xenopus eye or goldfish gut and liver. Thus, the existing mRNA data are not consistent with a clear, tissue-specific role of GbX. Whereas small amounts of the xgb mRNA transcript were previously detected in the RBC of the three-spined stickleback (Gasterosteus aculeatus) and X. laevis, neither the presence of the protein nor functional significance was described (15). Here we definitively identify the xgb mRNA and protein in the zebrafish and bass RBCs. The quantification of the transcript in zebrafish RBCs follows the trend of adult RBC proteins, showing a gradual increase during development after 24 hpf, when the circulation starts and the first wave of definitive hematopoiesis begins (29). Thus, GbX mRNA ontology and protein localization are consistent with the expression of a RBC protein.
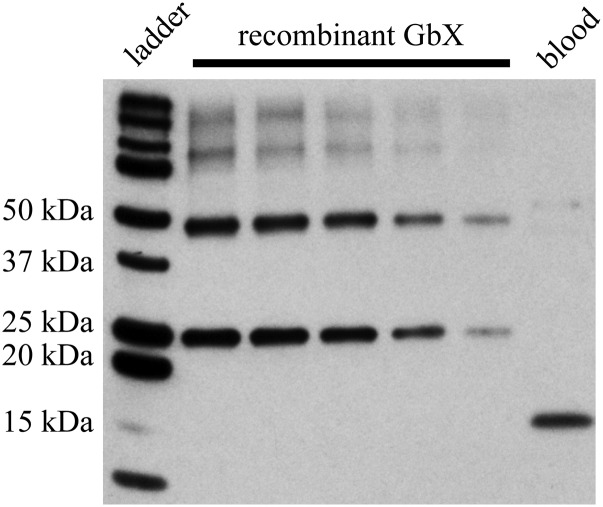
The presence of a novel six-coordinate globin in fish RBCs is remarkable, as Hb is commonly assumed to be the only RBC globin. At the same time, we must consider what function such a six-coordinate globin could determine in the blood. It is tempting to speculate that GbX in RBCs may serve as a response mechanism to hypoxia, delivering oxygen at very low oxygen tensions when Hb is deoxygenated. The P50 of zebrafish GbX ranges between 1.3 and 12.5 torr, depending on the pH and reducing conditions (18). This value is within the range of respiratory globins, but the low concentration of GbX (89.9 ± 26.3 nM in bass blood; Fig. S7) would still suggest a limited role in oxygen storage capacity. Moreover, the study of zebrafish globin expression under hypoxia does not seem to support this hypothesis. After 24–48 h under severe hypoxia (PO2 = 4.1 kPa ∼31 torr) there is no up-regulation of GbX, and actually a significant decrease in xgb mRNA was observed. Notably, there was a similar trend by hbα and hbβ, probably indicating that the decrease in xgb mRNA was due to a general decrease in RBCs (30).
Fig. S7.
GbX quantification by Western blot in bass blood. The bands present in the blood sample were quantified using a calibration curve calculated with different amounts of recombinant protein in the blot. The GbX concentration is 89.9 ± 26.3 nM in whole blood.
Most ancient globins have generally an enzymatic or sensing function, whereas oxygen storage and transport is a more recently evolved function (31). The six-coordinate geometry and monomeric form of GbX reflect the original coordination state of the vertebrate globins (1) and it is more consistent with an electron transfer functionality. GbX predates the appearance of tetrameric vertebrate Hbs (32) and thus the oldest tetrameric Hbs most probably coexisted with GbX in the ancestral fish RBCs. Despite the loss of GbX in bird and mammalian genomes, the gene is still preserved in fish, amphibians, and reptiles. Therefore, the elucidation of the functional properties of GbX may help establish primacy of certain functions that are conserved and shared across globins.
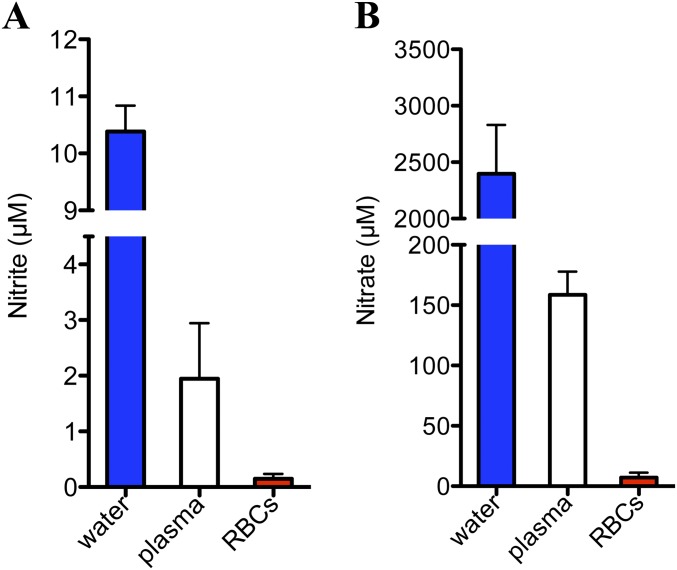
The role of nitrite as an exogenous source of NO has gathered increasing attention as it can increase NO bioavailability under physiological hypoxemic conditions and provide beneficial effects in the treatment of cardiovascular diseases (33, 34). In this regard, it is now recognized that deoxygenated Hb in mammalian blood can reduce nitrite to NO in vivo, and thus modulate blood pressure, hypoxic vasodilation, mitochondrial respiration and the inhibition of platelet activation (11, 35). The function of NO and nitrite in fish metabolism has been explored only recently (36–38). Nitrite and nitrate levels detected in the bass plasma are in similar ranges to the reported values for carp and goldfish (Fig. S8) (36, 39). Altogether, the new reports indicate that NO metabolism is important in the response of fish to hypoxia. Although NO synthases are oxygen dependent, NO metabolites in goldfish are maintained at similar levels during normoxia/hypoxia, indicating that additional mechanisms to preserve NO homeostasis are at play during hypoxia (36). Nitrite reduction to NO appears to be a main factor in these hypoxia-dependent mechanisms. The decrease in oxygen concentration increases the intracellular concentrations of nitrite, probably to serve as a reservoir of NO for signaling (36). Hypoxia-tolerating fish have Hbs with faster nitrite reductase activities (38). Similar trends have been observed in hypoxia-resistant turtles (40). It is conceivable that GbX plays a role in the hypoxic adaptation of these organisms, whereas mammals have relied on alternate mechanisms of nitrite reduction in hypoxic tissue.
Fig. S8.
Nitrite (A) and nitrate (B) levels in the striped bass water tank, plasma, and RBCs.
The nitrite reduction rate constant of zebrafish GbX is among the fastest reported for globins, in a similar range to the values measured for bacterial flavoHb and plant Hbs and up to 200-fold faster than mammalian globins (4, 41, 42). This finding suggests a specialized function of GbX as a nitrite reductase at lower oxygen tensions. We observed that recombinant GbX is able to generate NO from nitrite in vitro and inhibited platelet aggregation in cell systems with stronger effects than deoxygenated human Hb. Cultured fish RBCs can also prevent platelet activation in the presence of nitrite, but more significantly, the siRNA knockdown of GbX in fish RBCs impaired this anticoagulation effect. Therefore, we hypothesize that this reaction in fish blood is physiologically relevant and leads to activation of downstream pathways that might be conserved between humans and fish. Whether the biological targets of bioactivated nitrite are the fish thrombocytes, (homologs of the mammalian platelets) or other cells, still remains to be determined. The presence of a six-coordinated globin in the blood, with robust nitrite reductase activity and capable of releasing NO at biologically active levels, underscores the biological relevance of ancient globins as biologically relevant nitrite reductases. Further studies, including gene disruption analysis, are needed to establish the present physiological roles of GbX. Establishing the function of GbX in fish blood may help to elucidate the broader roles of cellular six-coordinate globins in biology.
Materials and Methods
Fish Care.
WT (AB strain) zebrafish (Danio rerio) were maintained according to standard protocols (43). The zebrafish experiments were performed according to protocol approved by the Institutional Animal Care and Use Committee (IACUC) at the University of Pittsburgh that conforms to the NIH guidelines. Blood from striped bass (M. saxatilis) was purchased from a local fish market.
Transcript Analysis.
The xgb transcript was evaluated by whole mount in situ hybridization as previously described (44) using a riboprobe synthesized against the full xgb transcript. The samples were then embedded in JB-4 plastic resin and sectioned (45). Tissue extraction and RT-PCR performed according to methodologies previously described (22) and detailed in SI Materials and Methods. For qRT-PCR we used pools of 30 embryos for each stage of development and a pool of blood from 25 adult zebrafish. Analysis with Taqman probes and relative quantification of the transcript was performed according to standard procedures (Applied Biosystems).
Immunohistochemistry and Western Blotting.
Immunohistochemistry was performed on cryosections of embryos and adult brain (46) or on adult fish blood using a custom anti-GbX antibody (1:500 dilution) (LifeTechnologies). For Western blot we extracted the proteins from a pool of 30 embryos or cultured RBCs in radio immunoprecipitation assay buffer (Santa Cruz Biotechnology). To quantify the protein, we used total protein normalization methods using stain-free gels and blot methodology described in detail in SI Materials and Methods (Bio-Rad) (47). Immunogold was performed by standard procedures on 30-nm cryosections.
Recombinant GbX Protein Studies.
For biochemical studies, the complete D. rerio xgb, cygb1, cygb2, and ngb genes (22) were cloned into the pET-28a expression vector between the NdeI and HindIII sites. The expressed protein incorporates an N-terminal His tag. The resulting plasmid was transformed into E. coli SoluBL21 cells (Genlantis) and used to induce the protein expression in vitro. Recombinant GbX was purified by Ni-nitrilotriacetic acid (Ni-NTA) agarose chromatography using an AKTA Purifier 10 FPLC system (GE Healthcare) with UNICORN software. Protein purity was assessed by SDS-PAGE and UV-visible spectroscopy. Nitrite reduction experiments, autoxidation rates, and redox potential were measured as previously described (20).
Measurements of NO Formation by Ozone-Based Chemiluminescence.
A Sievers nitric oxide analyzer (NOA) (model NOA 208i), equipped with a liquid sampling purge system (GE Healthcare) was used to monitor NO production. The calibration was performed with known amounts of sodium nitrite using triiodide (I−3) assays (SI Materials and Methods) (48). The assays with proteins and RBCs were conducted in PBS with 10 mM sodium nitrite in 2 mL volume reaction. The proteins were reduced by the addition of 500 µM sodium dithionite to the reaction mix. The concentration of the heme-RBCs used in the NOA injections was 28 µM and 50 µM for the fish and human samples, respectively, and it was calculated by spectrophotometric analysis of the cell lysate. For the protein experiments, the data were first integrated to calculate the amount of NO accumulation over a 6-s reaction calculated around the maximum peak reached. For the RBC experiments, we used a 30-s time window. We used Origin Lab software (version 8.6) to calculate NO formation rates.
RBCs in Vitro Cultures.
Blood from striped bass was extracted, washed in PBS, and cultured as 5 × 10⁷ cells/mL in RPMI-1640 (Gibco 11875–093) with 10% FBS, 100 units/mL penicillin, and 100 μg/mL streptomycin (Gibco 15140–122) in six-well plates for 3 d at 28.5 °C, 5% CO2 in a cell incubator. The cell mortality was monitored every day with Trypan Blue staining. A total of 96–98% viable cells were detectable throughout the entire experiment. Transfection with control (scramble) siRNA and GbX siRNA (Ambion; 4399667 and 4399665) in Lipofectamine RNAi Max reagent (Thermo Fisher; 13778-150) was performed after a 4-h initial culture following Lipofectamine RNAiMax transfection procedure (Life Technologies), and cells were harvested for analysis on day 3.
Platelet Activation Assays.
PRP preparation, deoxygenation of reagents, and activation assays were run as described previously using PAC-1 and CD61 antibodies for detection by flow cytometer (11). In the assays with recombinant GbX and human or fish RBCs, we used 10 µM ADP for platelet activation. In the assays with cultured RBCs, we used 1 µM ADP. The concentration of nitrite and sodium dithionite was 10 µM. We used 20 µM GbX and 20 µM and 100 µM Hb. We used 15% Hct for the human RBCs and fish RBCs, fresh and in culture. cPTIO and ODQ were used at the concentrations of 500 µM and 1 µM, respectively. Deoxygenated RBCs were prepared by circulating wet nitrogen on the RBC samples as described (11). Data were plotted as a function of the maximal activation (100%) recorded in the presence of ADP for the assays with the proteins or in the presence of ADP and RBCs for the assays with RBCs.
SI Materials and Methods
Measurements of Nitrite and Nitrate Levels by Ozone-Based Chemiluminescence.
We used a Sievers NOA (NOA 208i) equipped with a liquid sampling purge system (GE Healthcare) to measure levels of nitrite and nitrate. Liquid software (version 3) was used to monitor and collect data. Quantification of nitrite was determined using acidic triiodide (I3−) reagent (prepared fresh daily: 2.0 g potassium iodide and 1.3 g iodine, 40 mL distilled H2O and 140 mL glacial acetic acid), whereas nitrate was measured using a solution of vanadium(III) chloride in 1 N hydrochloric acid (saturated solution) at 95 °C. As vanadium(III)/HCl will also convert nitrite to NO, the amount of nitrate was quantified by subtraction of the nitrite concentration. To avoid foaming of the reducing solution after protein-rich sample injections, samples for nitrate measurements were deproteinized before analysis with cold methanol (plasma/methanol ratio = 1/4). The calibration curve was obtained with freshly prepared nitrite and nitrate standard solutions in ultrapure water. Known amounts of nitrite (0–500 pmol) and nitrate (0–1,000 pmol) were injected in 5 mL volume solution. In this concentration range, the chemiluminescent signal is linear with increasing concentration (R2 = 0.999) (48). Blood was extracted from the fish in heparinized tubes, centrifuged to separate RBCs from plasma (1,500 × g for 5 min at 4 °C), and frozen until measurement. RBCs were lysed with water before injections. Samples were injected in the purge vessel through the vessel’s septa using a Hamilton syringe. Raw data from the NOA were transferred into Origin Lab software (version 8.6) to calculate nitrite and nitrate levels. The area under the curve of the sample to be analyzed was divided by the slope from the standard curve (area/picomoles) and then divided by the volume of the sample injected (in microliters). This calculation provides the concentration of nitrite and nitrate in the sample (in micromoles).
Western Blotting.
We carried out protein quantification by Western blotting using precast AnykD mini-PROTEAN TGX Stain-Free gradient gels (Bio-Rad; 456-8123) loaded with 10 μg of protein from blood lysate or RBCs. Before blotting, stain-free gels were activated by UV exposure for 1 min using a Bio-Rad ChemiDoc MP Imaging System. Proteins were subsequently transferred to PVDF membranes (Bio-Rad; 162-0177). After protein transfer, total proteins on membranes (blots) were detected using a stain-free method (47). Afterward, the membranes were blocked with 5% (wt/vol) nonfat milk in PBST for 1 h at room temperature and then incubated with 1–1,000 diluted rabbit anti-GbX overnight at 4 °C. Membranes were then washed with PBST three times, for 5 min each time, and incubated with donkey anti-rabbit horseradish peroxidase antibody (1:10,000; Sc-2077) for 1 h at room temperature. Membranes were again washed with PBST three times for 5 min each time, exposed to Clarity chemiluminescence substrate (Bio-Rad; 170-5060) for 2 min at room temperature and visualized using the ChemiDoc MP Imaging System. Detection and quantification of band intensities were conducted using Image Lab 5.2.1 software (Bio-Rad). Bands were normalized to the total protein load in each lane. In knockdown experiments with RBCs in cultures we compared the normalized bands corresponding to GbX among the different conditions tested.
qRT-PCR.
Tissue extraction and RT-PCR was performed according to methodologies previously described (22) and using the following primers (F, forward; R, reverse): xgb 5′-AGGAGGACATCGCCAAAGTG-3′ (F) and 5′-GTAGTGGCTCTTGCCCAGTT-3′ (R); hbα 5′-AGCGAACTCCATGCCTTCAA-3′ (F) and 5′-CGACTGACACGTGAACCTCA-3′ (R); and hbβ 5′-GGCCTGTGGGGAAAGCTC-3′ (F) and 5′-GTTGTCGGGATCCACATGCAG-3′ (R). Total RNA for each sample was extracted from a pool of blood of 25 adult zebrafish or from one striped bass. For the quantification of the transcript, we used 2 µg of the extracted RNA as a template for the reverse transcriptase reaction. A total of 50 ng of the synthesized cDNA was amplified in a qPCR reaction using TaqMan Universal PCR Master Mix (Applied Biosystems) and TaqMan gene expression assays for ngb (assay ID Dr03150444_m1) and xgb (assay Dr03096323_m1 and assay Dr03096324_m1). All assays were done in triplicates and appropriate nontranscriptase and nontemplate control reactions were included. For relative quantification of the transcript, we used polr2d (assay Dr03095552_m1) and β-actin [primers: 5′-CGTGCTGTCTTCCCATCCA-3′ (F) and 5′-TCACCAACGTAGCTGTCTTTCTG-3′ (R)] as housekeeping genes for normalization and the results were analyzed by the ΔΔCT method after averaging the triplicates of each assay. Fold change was calculated by taking the average of all of the control samples (in the knockdown experiments) or the zebrafish blood as the baseline. Analysis was performed using two different sets of primers for xgb and two different housekeeping genes for comparisons. One representative data set is shown for each assay.
For absolute quantification of the globin transcript in blood, we generated standard curves using 10- to 100-fold dilutions in triplicates of the recombinant plasmid (pET-28a; Novagen) containing the globin clones. The standard curve was drawn by plotting the natural log of the threshold cycle (CT) against the natural log of the number of molecules. CT was calculated under default settings for the real-time sequence detection software (Applied Biosystems). The equation drawn from the graph was used to calculate the absolute mRNA copy number of specific globins present per microgram of total RNA (copy no. per microgram of RNA), tested in the same reaction plate as the standard.
Acknowledgments
This work was supported by NIH Grants HL058091 (to D.B.K.-S.), HL098032, HL096973, and HL125886 (to M.T.G.), and funding from the Institute for Transfusion Medicine and the Hemophilia Center of Western Pennsylvania (to M.T.G.) and from Ri.MED Foundation (to P.C.).
Footnotes
Conflict of interest statement: M.T.G. and D.B.K.-S. are listed as co-inventors on a patent application for the use of nitrite salts in cardiovascular diseases.
This article is a PNAS Direct Submission.
This article contains supporting information online at www.pnas.org/lookup/suppl/doi:10.1073/pnas.1522670113/-/DCSupplemental.
References
- 1.Burmester T, Hankeln T. Function and evolution of vertebrate globins. Acta Physiol (Oxf) 2014;211(3):501–514. doi: 10.1111/apha.12312. [DOI] [PubMed] [Google Scholar]
- 2.Roesner A, Fuchs C, Hankeln T, Burmester T. A globin gene of ancient evolutionary origin in lower vertebrates: Evidence for two distinct globin families in animals. Mol Biol Evol. 2005;22(1):12–20. doi: 10.1093/molbev/msh258. [DOI] [PubMed] [Google Scholar]
- 3.Dröge J, Makałowski W. Phylogenetic analysis reveals wide distribution of globin X. Biol Direct. 2011;6:54. doi: 10.1186/1745-6150-6-54. [DOI] [PMC free article] [PubMed] [Google Scholar]
- 4.Tejero J, Gladwin MT. The globin superfamily: Functions in nitric oxide formation and decay. Biol Chem. 2014;395(6):631–639. doi: 10.1515/hsz-2013-0289. [DOI] [PMC free article] [PubMed] [Google Scholar]
- 5.Huang Z, et al. Enzymatic function of hemoglobin as a nitrite reductase that produces NO under allosteric control. J Clin Invest. 2005;115(8):2099–2107. doi: 10.1172/JCI24650. [DOI] [PMC free article] [PubMed] [Google Scholar]
- 6.Roche CJ, Dantsker D, Samuni U, Friedman JM. Nitrite reductase activity of sol-gel-encapsulated deoxyhemoglobin. Influence of quaternary and tertiary structure. J Biol Chem. 2006;281(48):36874–36882. doi: 10.1074/jbc.M603914200. [DOI] [PubMed] [Google Scholar]
- 7.Mellion BT, et al. Evidence for the inhibitory role of guanosine 3′, 5′-monophosphate in ADP-induced human platelet aggregation in the presence of nitric oxide and related vasodilators. Blood. 1981;57(5):946–955. [PubMed] [Google Scholar]
- 8.Radomski MW, Palmer RM, Moncada S. Endogenous nitric oxide inhibits human platelet adhesion to vascular endothelium. Lancet. 1987;2(8567):1057–1058. doi: 10.1016/s0140-6736(87)91481-4. [DOI] [PubMed] [Google Scholar]
- 9.Apostoli GL, Solomon A, Smallwood MJ, Winyard PG, Emerson M. Role of inorganic nitrate and nitrite in driving nitric oxide-cGMP-mediated inhibition of platelet aggregation in vitro and in vivo. J Thromb Haemost. 2014;12(11):1880–1889. doi: 10.1111/jth.12711. [DOI] [PubMed] [Google Scholar]
- 10.Park JW, Piknova B, Huang PL, Noguchi CT, Schechter AN. Effect of blood nitrite and nitrate levels on murine platelet function. PLoS One. 2013;8(2):e55699. doi: 10.1371/journal.pone.0055699. [DOI] [PMC free article] [PubMed] [Google Scholar]
- 11.Liu C, et al. Mechanisms of human erythrocytic bioactivation of nitrite. J Biol Chem. 2015;290(2):1281–1294. doi: 10.1074/jbc.M114.609222. [DOI] [PMC free article] [PubMed] [Google Scholar]
- 12.Velmurugan S, et al. Antiplatelet effects of dietary nitrate in healthy volunteers: Involvement of cGMP and influence of sex. Free Radic Biol Med. 2013;65:1521–1532. doi: 10.1016/j.freeradbiomed.2013.06.031. [DOI] [PMC free article] [PubMed] [Google Scholar]
- 13.Srihirun S, et al. Platelet inhibition by nitrite is dependent on erythrocytes and deoxygenation. PLoS One. 2012;7(1):e30380. doi: 10.1371/journal.pone.0030380. [DOI] [PMC free article] [PubMed] [Google Scholar]
- 14.Akrawinthawong K, et al. A flow cytometric analysis of the inhibition of platelet reactivity due to nitrite reduction by deoxygenated erythrocytes. PLoS One. 2014;9(3):e92435. doi: 10.1371/journal.pone.0092435. [DOI] [PMC free article] [PubMed] [Google Scholar]
- 15.Götting M, Nikinmaa M. More than hemoglobin: The unexpected diversity of globins in vertebrate red blood cells. Physiol Rep. 2015;3(2):e12284. doi: 10.14814/phy2.12284. [DOI] [PMC free article] [PubMed] [Google Scholar]
- 16.Hoffmann FG, et al. Evolution of the globin gene family in deuterostomes: Lineage-specific patterns of diversification and attrition. Mol Biol Evol. 2012;29(7):1735–1745. doi: 10.1093/molbev/mss018. [DOI] [PMC free article] [PubMed] [Google Scholar]
- 17.Hankeln T, et al. Neuroglobin and cytoglobin in search of their role in the vertebrate globin family. J Inorg Biochem. 2005;99(1):110–119. doi: 10.1016/j.jinorgbio.2004.11.009. [DOI] [PubMed] [Google Scholar]
- 18.Blank M, et al. A membrane-bound vertebrate globin. PLoS One. 2011;6(9):e25292. doi: 10.1371/journal.pone.0025292. [DOI] [PMC free article] [PubMed] [Google Scholar]
- 19.Tiedke J, Gerlach F, Mitz SA, Hankeln T, Burmester T. Ontogeny of globin expression in zebrafish (Danio rerio) J Comp Physiol B. 2011;181(8):1011–1021. doi: 10.1007/s00360-011-0588-9. [DOI] [PubMed] [Google Scholar]
- 20.Tejero J, Sparacino-Watkins CE, Ragireddy V, Frizzell S, Gladwin MT. Exploring the mechanisms of the reductase activity of neuroglobin by site-directed mutagenesis of the heme distal pocket. Biochemistry. 2015;54(3):722–733. doi: 10.1021/bi501196k. [DOI] [PMC free article] [PubMed] [Google Scholar]
- 21.Tiso M, et al. Human neuroglobin functions as a redox-regulated nitrite reductase. J Biol Chem. 2011;286(20):18277–18289. doi: 10.1074/jbc.M110.159541. [DOI] [PMC free article] [PubMed] [Google Scholar]
- 22.Corti P, Ieraci M, Tejero J. Characterization of zebrafish neuroglobin and cytoglobins 1 and 2: Zebrafish cytoglobins provide insights into the transition from six-coordinate to five-coordinate globins. Nitric Oxide. 2016;53:22–34. doi: 10.1016/j.niox.2015.12.004. [DOI] [PubMed] [Google Scholar]
- 23.Cosby K, et al. Nitrite reduction to nitric oxide by deoxyhemoglobin vasodilates the human circulation. Nat Med. 2003;9(12):1498–1505. doi: 10.1038/nm954. [DOI] [PubMed] [Google Scholar]
- 24.Dewilde S, et al. Biochemical characterization and ligand binding properties of neuroglobin, a novel member of the globin family. J Biol Chem. 2001;276(42):38949–38955. doi: 10.1074/jbc.M106438200. [DOI] [PubMed] [Google Scholar]
- 25.Hamdane D, et al. The redox state of the cell regulates the ligand binding affinity of human neuroglobin and cytoglobin. J Biol Chem. 2003;278(51):51713–51721. doi: 10.1074/jbc.M309396200. [DOI] [PubMed] [Google Scholar]
- 26.Blank M, Burmester T. Widespread occurrence of N-terminal acylation in animal globins and possible origin of respiratory globins from a membrane-bound ancestor. Mol Biol Evol. 2012;29(11):3553–3561. doi: 10.1093/molbev/mss164. [DOI] [PubMed] [Google Scholar]
- 27.Totzeck M, et al. Nitrite regulates hypoxic vasodilation via myoglobin-dependent nitric oxide generation. Circulation. 2012;126(3):325–334. doi: 10.1161/CIRCULATIONAHA.111.087155. [DOI] [PMC free article] [PubMed] [Google Scholar]
- 28.Fuchs C, Burmester T, Hankeln T. The amphibian globin gene repertoire as revealed by the Xenopus genome. Cytogenet Genome Res. 2006;112(3-4):296–306. doi: 10.1159/000089884. [DOI] [PubMed] [Google Scholar]
- 29.Chen AT, Zon LI. Zebrafish blood stem cells. J Cell Biochem. 2009;108(1):35–42. doi: 10.1002/jcb.22251. [DOI] [PubMed] [Google Scholar]
- 30.Roesner A, Hankeln T, Burmester T. Hypoxia induces a complex response of globin expression in zebrafish (Danio rerio) J Exp Biol. 2006;209(Pt 11):2129–2137. doi: 10.1242/jeb.02243. [DOI] [PubMed] [Google Scholar]
- 31.Vinogradov SN, et al. A phylogenomic profile of globins. BMC Evol Biol. 2006;6:31. doi: 10.1186/1471-2148-6-31. [DOI] [PMC free article] [PubMed] [Google Scholar]
- 32.Schwarze K, Burmester T. Conservation of globin genes in the “living fossil” Latimeria chalumnae and reconstruction of the evolution of the vertebrate globin family. Biochim Biophys Acta. 2013;1834(9):1801–1812. doi: 10.1016/j.bbapap.2013.01.019. [DOI] [PubMed] [Google Scholar]
- 33.Bryan NS, et al. Dietary nitrite supplementation protects against myocardial ischemia-reperfusion injury. Proc Natl Acad Sci USA. 2007;104(48):19144–19149. doi: 10.1073/pnas.0706579104. [DOI] [PMC free article] [PubMed] [Google Scholar]
- 34.Bryan NS, Calvert JW, Gundewar S, Lefer DJ. Dietary nitrite restores NO homeostasis and is cardioprotective in endothelial nitric oxide synthase-deficient mice. Free Radic Biol Med. 2008;45(4):468–474. doi: 10.1016/j.freeradbiomed.2008.04.040. [DOI] [PMC free article] [PubMed] [Google Scholar]
- 35.Gladwin MT, et al. The emerging biology of the nitrite anion. Nat Chem Biol. 2005;1(6):308–314. doi: 10.1038/nchembio1105-308. [DOI] [PubMed] [Google Scholar]
- 36.Hansen MN, Jensen FB. Nitric oxide metabolites in goldfish under normoxic and hypoxic conditions. J Exp Biol. 2010;213(Pt 21):3593–3602. doi: 10.1242/jeb.048140. [DOI] [PubMed] [Google Scholar]
- 37.Sandvik GK, Nilsson GE, Jensen FB. Dramatic increase of nitrite levels in hearts of anoxia-exposed crucian carp supporting a role in cardioprotection. Am J Physiol Regul Integr Comp Physiol. 2012;302(4):R468–R477. doi: 10.1152/ajpregu.00538.2011. [DOI] [PubMed] [Google Scholar]
- 38.Fago A, Jensen FB. Hypoxia tolerance, nitric oxide, and nitrite: Lessons from extreme animals. Physiology (Bethesda) 2015;30(2):116–126. doi: 10.1152/physiol.00051.2014. [DOI] [PubMed] [Google Scholar]
- 39.Hansen MN, Gerber L, Jensen FB. Nitric oxide availability in deeply hypoxic crucian carp: Acute and chronic changes and utilization of ambient nitrite reservoirs. Am J Physiol Regul Integr Comp Physiol. 2016;310(6):R532–R540. doi: 10.1152/ajpregu.00515.2015. [DOI] [PubMed] [Google Scholar]
- 40.Jacobsen SB, et al. Circulating nitric oxide metabolites and cardiovascular changes in the turtle Trachemys scripta during normoxia, anoxia and reoxygenation. J Exp Biol. 2012;215(Pt 15):2560–2566. doi: 10.1242/jeb.070367. [DOI] [PubMed] [Google Scholar]
- 41.Sturms R, DiSpirito AA, Hargrove MS. Plant and cyanobacterial hemoglobins reduce nitrite to nitric oxide under anoxic conditions. Biochemistry. 2011;50(19):3873–3878. doi: 10.1021/bi2004312. [DOI] [PubMed] [Google Scholar]
- 42.Tiso M, Tejero J, Kenney C, Frizzell S, Gladwin MT. Nitrite reductase activity of nonsymbiotic hemoglobins from Arabidopsis thaliana. Biochemistry. 2012;51(26):5285–5292. doi: 10.1021/bi300570v. [DOI] [PMC free article] [PubMed] [Google Scholar]
- 43.Westerfield M. The Zebrafish Book. University of Oregon Press; Eugene, OR: 1995. [Google Scholar]
- 44.Cermenati S, et al. Sox18 and Sox7 play redundant roles in vascular development. Blood. 2008;111(5):2657–2666. doi: 10.1182/blood-2007-07-100412. [DOI] [PubMed] [Google Scholar]
- 45.Sullivan-Brown J, Bisher ME, Burdine RD. Embedding, serial sectioning and staining of zebrafish embryos using JB-4 resin. Nat Protoc. 2011;6(1):46–55. doi: 10.1038/nprot.2010.165. [DOI] [PMC free article] [PubMed] [Google Scholar]
- 46.Poss KD, Wilson LG, Keating MT. Heart regeneration in zebrafish. Science. 2002;298(5601):2188–2190. doi: 10.1126/science.1077857. [DOI] [PubMed] [Google Scholar]
- 47.Taylor SC, Posch A. The design of a quantitative western blot experiment. BioMed Res Int. 2014;2014:361590. doi: 10.1155/2014/361590. [DOI] [PMC free article] [PubMed] [Google Scholar]
- 48.MacArthur PH, Shiva S, Gladwin MT. Measurement of circulating nitrite and S-nitrosothiols by reductive chemiluminescence. J Chromatogr B Analyt Technol Biomed Life Sci. 2007;851(1-2):93–105. doi: 10.1016/j.jchromb.2006.12.012. [DOI] [PubMed] [Google Scholar]


