Significance
We investigated the effect of PD-1 (programmed-death 1), a negative immunoreceptor, on the function of transcription factor FoxP3+ Treg cells. When a moderately down-modulated transcription factor FoxP3 knock-in mouse, which did not show any autoimmunity, was made PD-1–deficient, the mouse developed severe pancreatitis and died soon after birth. PD-1 deficiency also induced instability of Treg cell status and increased so-called ex-Treg cells, which showed the helper effector activity with self-antigen recognition. PD-1–deficient T reg cells, however, did not compromise their function but rather increased their suppressive activity. Thus, PD-1 and Treg cells mutually influence and both are required for protection from autoimmunity.
Keywords: immune tolerance, autoimmunity, T lymphocytes, regulatory T cell, PD-1
Abstract
PD-1 (programmed-death 1), an immune-inhibitory receptor required for immune self-tolerance whose deficiency causes autoimmunity with variable severity and tissue specificity depending on other genetic factors, is expressed on activated T cells, including the transcription factor FoxP3+ Treg cells known to play critical roles in maintaining immune tolerance. However, whether PD-1 expression by the Treg cells is required for their immune regulatory function, especially in autoimmune settings, is still unclear. We found that mice with partial FoxP3 insufficiency developed early-onset lympho-proliferation and lethal autoimmune pancreatitis only when PD-1 is absent. The autoimmune phenotype was rescued by the transfer of FoxP3-sufficient T cells, regardless of whether they were derived from WT or PD-1–deficient mice, indicating that Treg cells dominantly protect against development of spontaneous autoimmunity without intrinsic expression of PD-1. The absence of PD-1 combined with partial FoxP3 insufficiency, however, led to generation of ex-FoxP3 T cells with proinflammatory properties and expansion of effector/memory T cells that contributed to the autoimmune destruction of target tissues. Altogether, the results suggest that PD-1 and FoxP3 work collaboratively in maintaining immune tolerance mostly through nonoverlapping pathways. Thus, PD-1 is modulating the activation threshold and maintaining the balance between regulatory and effector T cells, whereas FoxP3 is sufficient for dominant regulation through maintaining the integrity of the Treg function. We suggest that genetic or environmental factors that even moderately affect the expression of both PD-1 and FoxP3 can cause life-threatening autoimmune diseases by disrupting the T-cell homeostasis.
Peripheral immune tolerance is maintained by multiple mechanisms. Activation of T cells, for example, is regulated by activation-induced cell death, clonal anergy, negative costimulation, and regulatory T-cell (Treg)-mediated suppression, among others.
Many regulatory pathways are partially redundant, as in the case of the costimulatory receptor CTLA-4 and the nuclear factor FoxP3, both inhibiting other T cells in a cell-extrinsic fashion. FoxP3 is a hallmark for Treg, driving either transcriptional repression or activation of more than 100 targets (1, 2). FoxP3 directly promotes the expression of CTLA-4, a receptor member of the CD28 family (3). CTLA-4 suppresses the activation of T cells through competitive binding to CD80 and CD86 ligands, thus preventing their interaction with the coactivator receptor CD28 (3, 4). CTLA-4 also plays a critical role in Treg function. Indeed, deficiency of CTLA-4 or FoxP3 in humans causes lethal autoimmunity (5, 6). In mice, genetic ablation of CTLA-4 causes a lympho-proliferative disease that phenocopies FoxP3 deficiency. Moreover, deletion of CTLA-4 specifically on FoxP3+ T cells results in autoimmunity and early death of mice (3). These results support the notion that CTLA-4 and FoxP3 cooperate for the proper function of Tregs and that both molecules need to be coexpressed in T cells to prevent lymphoproliferation (7).
PD-1 is another cell-surface receptor belonging to the CD28/CTLA-4 family that inhibits activation of T cells. PD-1 has a typical immune receptor tyrosine-based switch motif (ITSM) (8) in its cytoplasmic tail that is phosphorylated upon engagement of PD-1 by its ligands (PD-L1 and PD-L2) (9). The phosphorylated ITSM recruits the tyrosine phosphatase SHP-2, leading to dephosphorylation of the antigen receptor complex (10). In this way, PD-1 causes the rheostatic inhibition of signaling through TCR, which results in reduced proliferation, cytokine secretion, and cytotoxic activities of T cells (11, 12). PD-1 contributes to maintaining immune tolerance, as autoantigen-specific T cells are maintained in an anergic state in vivo long term in a PD-1–dependent manner (13). Accordingly, the deficiency of PD-1 causes autoimmunity in mice, and PD-1 is a genetic risk factor in humans and mice, albeit with less dramatic outcomes than CTLA-4 or FoxP3 deficiency (14).
FoxP3+ Treg cells constitutively express PD-1 under diverse conditions, in both mice and humans. In fact, Treg cells isolated from mouse germinal centers, as well as from chronically hepatitis C virus (HCV)-infected patients or cancer patients, express high levels of PD-1 on the surface (15–17). However, the precise role of PD-1 in homeostasis and function of Treg cells is still unclear. Its high expression levels suggest that PD-1 acts directly on FoxP3+ T cells in a way similar to CTLA-4. Supporting this view, PD-1 stimulation inhibits IL-2 production by activated T cells and induces anergy, which may account for the naturally anergic phenotype of Tregs (18). PD-1 may also regulate other aspects of Treg cell biology. Because PD-1 controls the strength of the TCR signal, the absence of PD-1 on FoxP3+ T cells may alter the nature of these cells as well as their behavior and function. It is accepted that helper T cells possess remarkable plasticity in vivo (19). T helper cells derived from FoxP3+ T cells, generally referred to as ex-FoxP3 cells, can be identified using a complex genetic strategy that allows for the fate mapping of FoxP3-expressing cells in vivo (20). Unlike Treg cells, the ex-FoxP3 cells are pathogenic cells with an effector/memory phenotype. Indeed, ex-FoxP3 cells were shown to produce inflammatory cytokines and to contribute to autoimmunity (20).
We aimed to elucidate the role of PD-1 and FoxP3 to immune tolerance. For this purpose, we bred mice deficient for PD-1 (PD-1 KO) with mice carrying the FoxP3-GFPcre knock-in (KI) locus and Rosa26-tdRFP transgene that can report the history of FoxP3 expression (21). Serendipitously, we observed that the FoxP3-GFPcre reporter strain showed reduced transcription of FoxP3, which led to early death by autoimmune pancreatitis of PD-1 KO mice but not PD-1–sufficient mice. The lethal autoimmunity was prevented by the transfer of FoxP3-sufficient Treg cells regardless of whether cells were sufficient or deficient for PD-1, indicating that PD-1 expression is not required for the suppressive functions of Treg cells. However, deficiency of PD-1 affected the Treg compartment by increasing considerably the generation of ex-FoxP3 cells and contributing to the expansion of effector/memory T cells capable of inducing autoimmunity. Our results indicate that PD-1 regulates the relative abundance of Treg and effector T cells to maintain immune tolerance.
Results
Lympho-Proliferation and Lethal Autoimmune Pancreatitis in FoxP3-GFPcreKI PD-1–Deficient Mice.
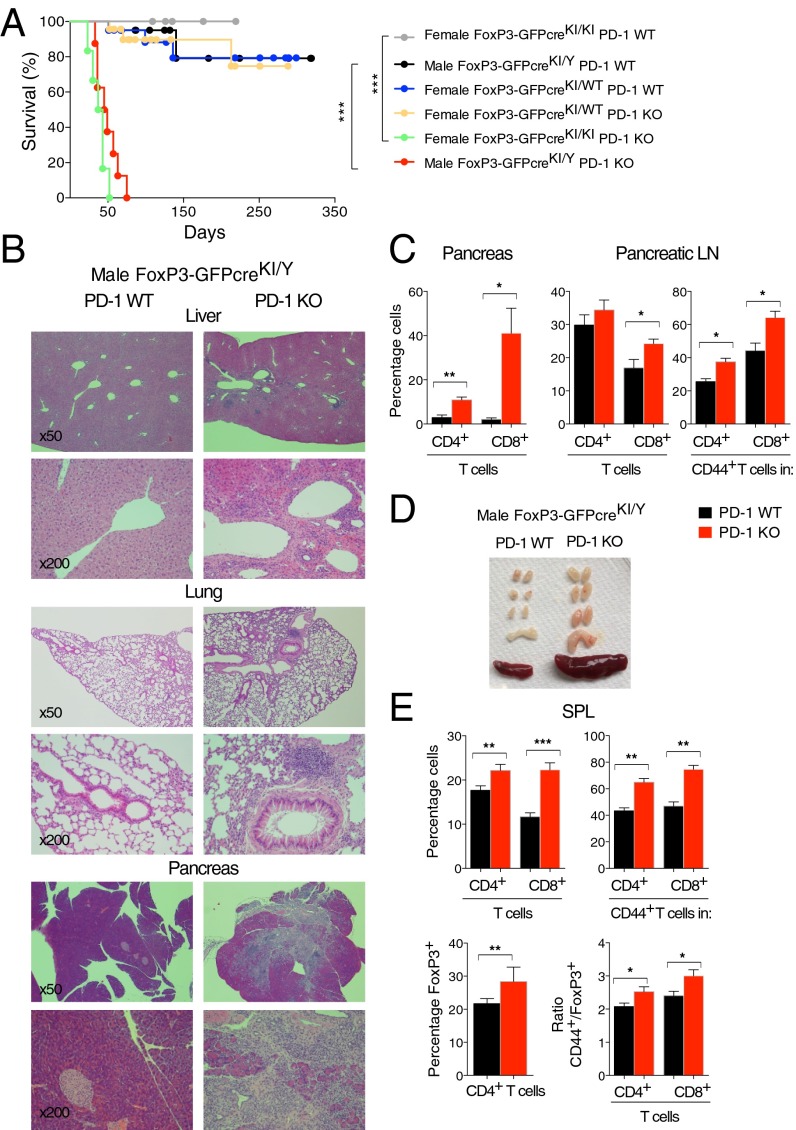
We bred PD-1 KO mice with mice carrying the IRES-GFPcre reporter KI at the 3′ untranslated region of the FoxP3 gene (hereafter FoxP3-GFPcreKI) (21) (Fig. S1A). During the course of breeding, we found that some of the litters died soon after weaning. The cumulative data revealed that all male mice with the genotype of FoxP3-GFPcreKI/Y PD-1 KO died within 3 mo of age (Fig. 1A). Histological analyses revealed the presence of mononuclear infiltrates in multiple organs such as the pancreas, liver, lung, or heart of FoxP3-GFPcreKI/Y PD-1 KO but not FoxP3-GFPcreKI/Y PD-1 WT mice (Fig. 1B and Table S1). Remarkably, the pancreas was atrophic and its exocrine structure was almost completely lost in most of the mice analyzed. Indeed, the level of serum lipase was significantly reduced in FoxP3-GFPcreKI/Y PD-1 KO mice (Fig. S1C). The total number of cells and frequencies of CD4+ and CD8+ T cells were considerably higher in pancreas and pancreatic lymph nodes (LNs) (Fig. 1C and Fig. S1D). There was a significant increase in CD4+CD44+ and CD8+CD44+ effector/memory T cells, especially in the pancreatic LNs (Fig. 1C and Fig. S1E). The moribund FoxP3-GFPcreKI/Y PD-1 KO mice did not show any kidney or joint pathology as observed previously in PD-1 KO mice on a C57BL/6 background (22), probably because of the early onset and lethal outcome of exocrine pancreatitis. Nephritis and arthritis begin after 3 mo of age (22).
Fig. S1.
Schematic representation of reporter mice and lympho-proliferation of FoxP3-GFPcreKI/Y PD-1 KO mice. (A) Map of the FoxP3-GFPcre locus is shown. Filled boxes, exons; gray box, 3′UTR of Foxp3 gene; I, IRES. (B) Principle of Cre-Lox–mediated tdRFP. (C) The 3- to ∼11-wk-old male FoxP3-GFPcreKI/Y PD-1 WT or PD-1 KO mice were analyzed for serum lipase concentration (excluding the maximum and minimum values). (D) Total number of mononuclear cells in the pancreas, pancreatic LNs, SPL, and LNs of 3- to ∼10-wk-old FoxP3-GFPcreKI/Y PD-1 WT or PD-1 KO mice. (E) The number of CD4+ and CD8+ T cells from the pancreas and pancreatic LNs and the number of CD44+ in CD4+ or CD8+ T cells from the pancreatic LNs of mice are as in D. (F) The number of CD4+, CD8+, CD44+CD4+, CD44+CD8+, and FoxP3+(GFP+) T cells from the SPL of mice as in D. (G) LN cells were analyzed for the frequency and number of CD4+, CD8+, CD44+CD4+, CD44+CD8+, and FoxP3+ (GFP+) T cells and for the ratio of CD44+ (gated on CD4+ or CD8+ T cells) and FoxP3+ (GFP+) T cells of mice as in D. Data are representative of 3 to ∼7 mice per group and shown as the means (±SEM). *P < 0.05, **P < 0.01, ***P < 0.001.
Fig. 1.
PD-1–deficient FoxP3-GFPcre mice show lethal autoimmunity. (A) Survival curve of male GFPcreKI/Y PD-1 WT (n = 20), male GFPcreKI/Y PD-1 KO (n = 8), female GFPcreKI/WT PD-1 WT (n = 20), female GFPcreKI/WT PD-1 KO (n = 23), female GFPcreKI/KI PD-1 WT (n = 11), and female GFPcreKI/KI PD-1 KO (n = 6) mice. (B) H&E staining of tissues (magnification, 50× and 200×). (C) FACS analysis of pancreas of 3- to ∼10-wk-old FoxP3-GFPcreKI/Y PD-1 WT or PD-1 KO mice. (D) Appearance of SPL and LNs. (E) FACS analysis of splenocytes. Data are representative of 3 to ∼7 mice per group. Bars represent the means (±SEM). *P < 0.05, **P < 0.01, ***P < 0.001.
Table S1.
Histological examination of mice
| Genotype | Age | Pancreas | Lung | Liver | Salivary | Heart |
| FoxP3-GFPcreKI/Y PD-1 WT | 38 | 0 | 0 | 0 | 0 | 0 |
| 38 | 0 | 0 | 0 | 0 | 0 | |
| 42 | 0 | 1 | 0 | 0 | 0 | |
| 47 | 0 | 0 | 0 | ND | ND | |
| 71 | 0 | 1 | 0 | 0 | 0 | |
| 71 | 0 | 1 | 0 | 0 | 0 | |
| 80 | 1 | 0 | 0 | 0 | 0 | |
| FoxP3- GFPcreKI/Y PD-1 KO | 38 | 1 | 1 | 0 | 0 | 0 |
| 38 | 4 | 0 | 1 | 0 | 0 | |
| 47 | 3 | 1 | 1 | ND | ND | |
| 42 | 4 | 1 | 1 | 0 | 0 | |
| 56 | 4 | 1 | 1 | 0 | 1 | |
| 71 | 3 | 1 | 1 | 0 | 1 | |
| 71 | 4 | 1 | 1 | 1 | 1 |
Table summarizes the score of inflammation of organs from male FoxP3-GFPcreKI/Y PD-1 WT or male FoxP3-GFPcreKI/Y PD-1 KO mice at the indicated age (days). Score 0, absence of lymphocytic infiltrates; score 1, mild infiltrates; score 2, moderate infiltrates; score 3, marked infiltrates; score 4, almost complete destruction of organs. ND, not done.
Examination of lymphoid organs of FoxP3-GFPcreKI/Y PD-1 KO mice revealed enlarged spleen (SPL) and LNs with significantly increased cellularity (Fig. 1D and Fig. S1D). There was a significant increase in frequencies of both CD4+ and CD8+ T cells, especially those expressing CD44 in the SPL and LNs of FoxP3-GFPcreKI/Y PD-1 KO mice compared with those in PD-1 WT mice, indicating a preferential expansion of effector/memory T-cell populations (Fig. 1E and Fig. S1 F and G). Interestingly, the GFP+ (FoxP3+) T cells were also increased in SPL and LNs of FoxP3-GFPcreKI/Y PD-1 KO mice (Fig. 1E and Fig. S1 F and G). The ratios of CD4+CD44+/Treg cells and CD8+CD44+/Treg cells were significantly higher in FoxP3-GFPcreKI/Y PD-1 KO mice (Fig. 1E and Fig. S1G), indicating that unbalanced T-cell expansion with dominance of effector/memory T cells versus Treg cells occurs in the absence of PD-1 control.
Taken together, the analyses revealed that PD-1 deficiency caused lympho-proliferation in lymphoid and nonlymphoid organs in FoxP3-GFPcreKI/Y mice, resulting in their early death from T-cell–mediated autoimmune destruction, especially autoimmune pancreatitis.
Transcription of FoxP3 Is Reduced in the FoxP3-GFPcreKI Mice.
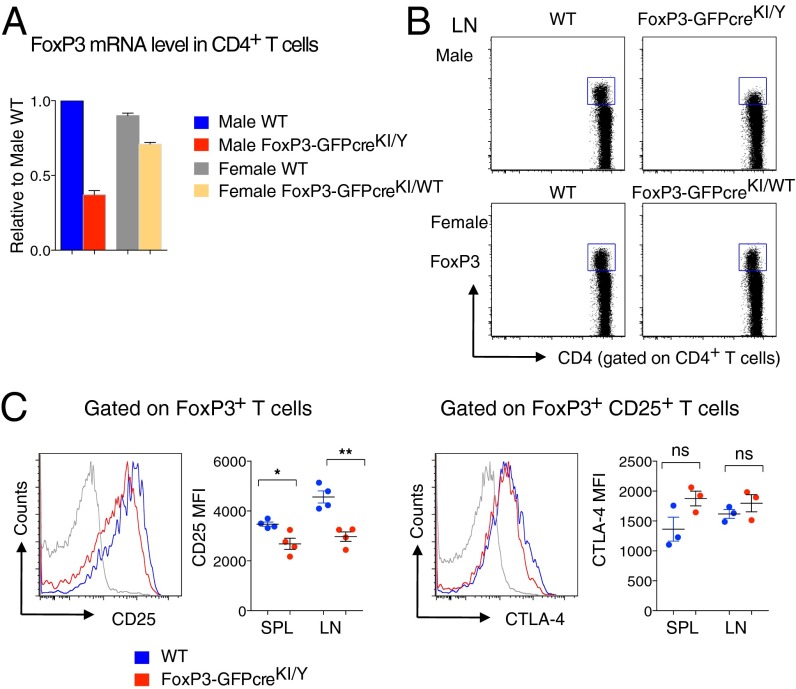
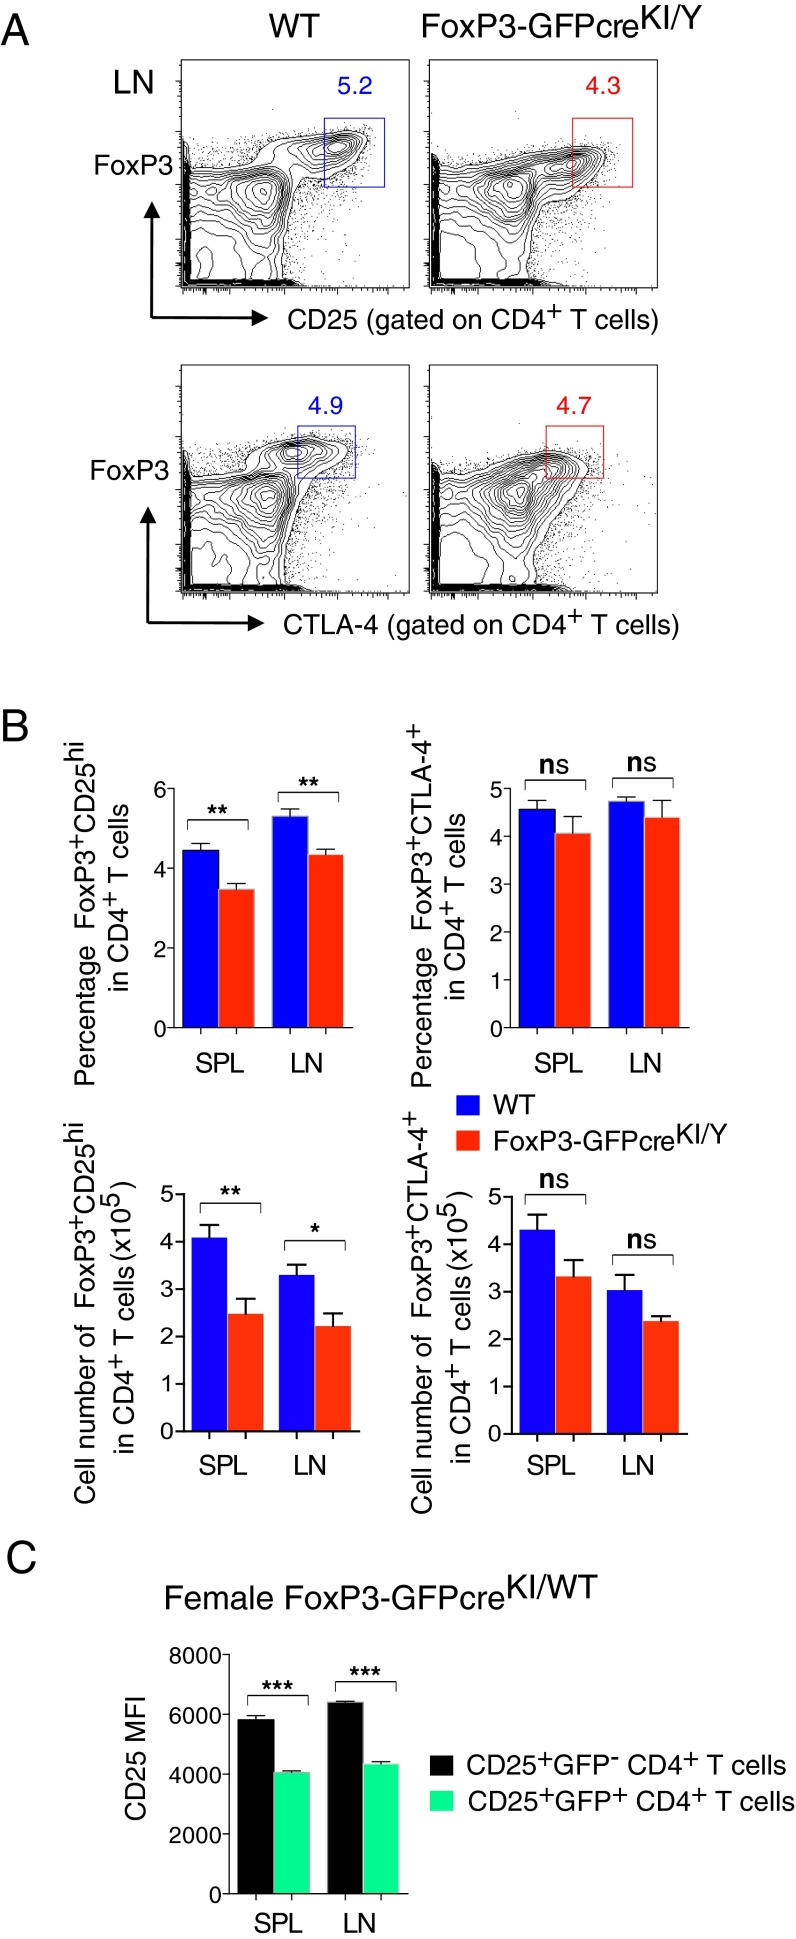
Two groups reported that FoxP3 KI reporter mice harboring GFP fused to the amino terminus of FoxP3 (GFP-FoxP3 KI) display a partial loss of FoxP3 function, promoting autoimmune phenotypes (23, 24). We thought that the current genetic modification of the FoxP3 locus could also affect the endogenous FoxP3 expression and consequently the function of Treg cells. In the case of GFP-FoxP3 KI mice, the transcriptional level of FoxP3 was unaffected, yet the mature GFP-FoxP3 fusion protein had altered binding to various cofactors (23, 24). In contrast, our FoxP3-GFPcreKI line showed reduced expression of FoxP3 at both transcriptional and protein levels, which was more obvious in male FoxP3-GFPKI/Y than in female FoxP3-GFPcreKI/WT mice (Fig. 2 A and B). The expression of CD25, a marker that usually defines activated T cells and Treg cells, was reduced on FoxP3+ T cells in lymphoid organs from male FoxP3-GFPcreKI/Y mice (Fig. 2C). However, the levels of CTLA-4 were comparable between FoxP3+CD25+ Treg cells from FoxP3-GFPcreKI/Y mice and those from WT mice (Fig. 2C). At the population level, the frequency of CD25+ Treg but not that of CTLA-4+ Treg cells was reduced in male FoxP3-GFPcreKI/Y mice (Fig. S2 A and B).
Fig. 2.
Reduced expression of endogenous FoxP3 in FoxP3-GFPcre mice. (A) CD4+ cells from the SPL and LNs of 2- to ∼3-mo-old indicated mice were subjected for quantitative real-time PCR (qRT-PCR) for the expression levels of endogenous FoxP3. (B) Intracellular staining for FoxP3 gated on LN CD4+ T cells. (C) FACS analysis of CD25 and CTLA-4 expression from LN cells of 2-mo-old male WT or FoxP3-GFPcreKI/Y mice. Statistical analysis of CD25 MFI and CTLA-4 MFI from the SPL and LNs of each mouse in indicated genotype is shown. Data are representative of 3 to ∼4 mice per group. Bars represent the means (±SEM). *P < 0.05, **P < 0.01; ns, not significant.
Fig. S2.
CD25+ T cells are decreased in FoxP3-GFPcre mice. (A) FACS analysis of LN cells from 2- to ∼3-mo-old male WT or FoxP3-GFPcreKI/Y mice for expression of FoxP3, CD25, and CTLA-4 gated on CD4+ T cells. Numbers in plots indicate percentage of cells in each gate. (B) Statistical analysis of FoxP3+CD25hi frequency and cell number in CD4+ T cells (Left) and FoxP3+CTLA-4+ frequency and cell number in CD4+ T cells (Right) from the SPL and LNs of mice as in A. (C) Statistical analysis of CD25 MFI within CD25+GFP− or CD25+GFP+ T cells from the SPL and LNs of female FoxP3-GFPcreKI/WT mice. Data are representative of 3 to ∼4 mice per group. Bars represent the means (±SEM). *P < 0.05, **P < 0.01, ***P < 0.001; ns, not significant.
Importantly, female FoxP3-GFPcreKI/WT PD-1 KO mice were healthy, presumably because one-half of Treg cells express a normal level of FoxP3 transcripts from the WT allele (due to random X-inactivation), thus providing a dominant protection (Fig. 1A). The allelic difference in FoxP3 expression was represented by higher CD25+ expression in GFP− T cells compared with GFP+ T cells in female FoxP3-GFPcreKI/WT mice (Fig. S2C). In contrast, the female PD-1 KO mice with the genotype of FoxP3-GFPcre KI on both alleles (FoxP3-GFPcreKI/KI PD-1 KO) died with kinetics similar to those of male FoxP3-GFPcreKI/Y PD-1 KO (Fig. 1A). Thus, the reduced FoxP3 expression in Treg cells is likely contributing to the autoimmune phenotype observed in FoxP3-GFPcreKI PD-1 KO mice.
PD-1–Deficient Treg Cells Efficiently Rescue the Autoimmune Phenotype of FoxP3-GFPcreKI/Y PD-1 KO Mice.
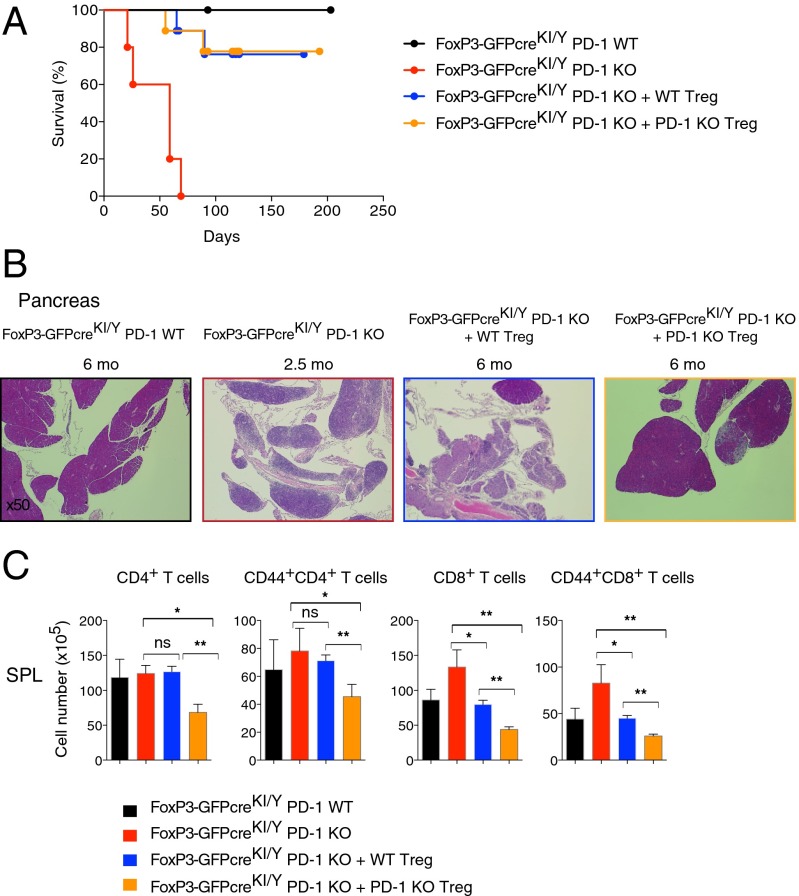
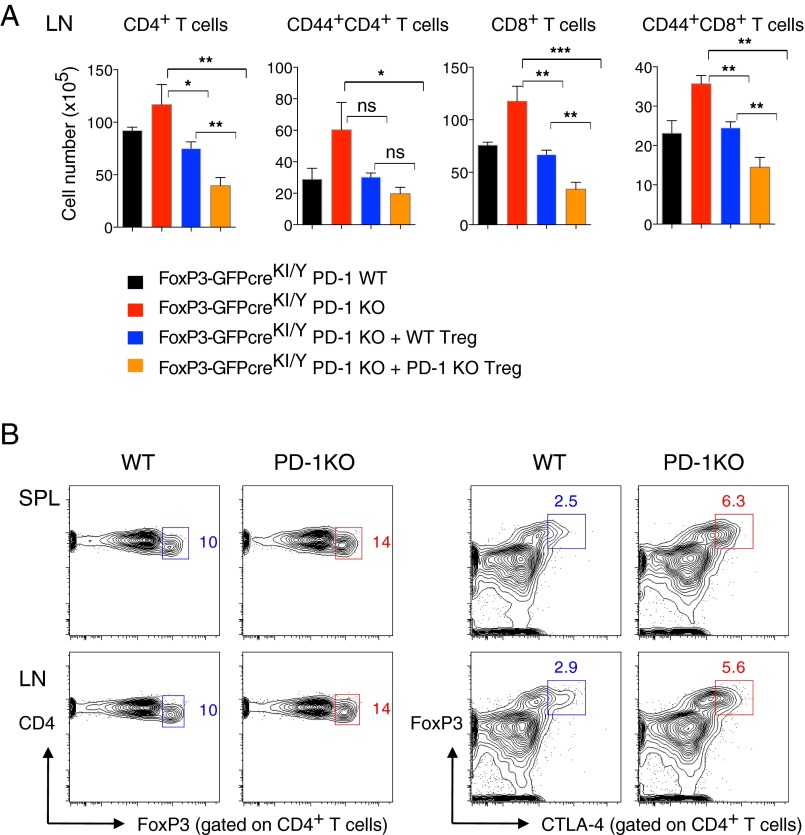
To determine if the partial insufficiency of FoxP3 was the cause of fatal autoimmunity in male FoxP3-GFPcreKI/YPD-1 KO mice, we tested whether supplying FoxP3-sufficient Treg cells could rescue the FoxP3-GFPcreKI/Y PD-1 KO mice from death. We transferred CD4+CD25+ T cells (>98% of which were Treg cells) sorted from the SPL and LNs of WT mice into neonatal FoxP3-GFPcreKI/Y PD-1 KO mice at day 3 after birth. More than 70% of mice that received FoxP3-sufficient Treg cells survived over 3 mo without any signs of disease (i.e., wasting) (Fig. 3A). We next asked whether PD-1 expression on transferred Treg cells was needed for such rescue. To address this issue, we performed transfer experiments with CD4+CD25+ T cells sorted from PD-1 KO mice. Remarkably, the injection of FoxP3-sufficient PD-1–deficient Treg cells prevented the development of the wasting disease in FoxP3-GFPcreKI/Y PD-1 KO mice (Fig. 3A). Although we could not directly assess the expansion of transferred Treg cells in this particular system, the histological features of the pancreas indicate that PD-1–deficient Treg cells had probably enhanced suppressive activity compared with WT Treg cells even 6 mo after transfer (Fig. 3B). Indeed, although both transfers associated with a significant decrease of CD4+ and CD8+ T cells, including the CD44+ effector/memory T cells in the SPL and LNs of the recipient mice, such reduction was much more pronounced in mice that received PD-1–deficient Treg cells (Fig. 3C and Fig. S3A). The suppressive function of PD-1–deficient Treg cells might be augmented by their accelerated expansion and/or due to their increased FoxP3 and CTLA-4 expression (Fig. S3B). Altogether the results suggest that Treg cells exert a dominant protection and that PD-1 expression is not necessary for this protection as long as they maintain FoxP3 expression at normal or higher levels.
Fig. 3.
PD-1–deficient Tregs efficiently rescue FoxP3-GFPKI/Y PD-1 KO mice from lethal autoimmunity. (A) Tregs (CD4+CD25+) were sorted from C57BL/6 PD-1 WT or PD-1 KO mice and injected into 3-d-old mice as indicated (GFPcreKI/Y PD-1 KO + WT-Treg: n = 9; GFPcreKI/Y PD-1 KO + PD-1 KO-Treg: n = 9). Mice that did not receive Treg cells (GFPcreKI/Y PD-1 WT: n = 6; GFPcreKI/Y PD-1 KO: n = 5) served as controls. (B) H&E staining of the pancreas from the mice in A. (C) The FACS analysis of the SPL from 12- to ∼16-wk-old mice in A. (B and C) Note that the data from untreated GFPcreKI/Y PD-1 KO are collected at 3- to ∼10-wk-old due to early death in this group. Data are representative of 4 to ∼6 mice per group. Bars represent the means (±SEM). *P < 0.05, **P < 0.01; ns, not significant.
Fig. S3.
PD-1–deficient Treg cells showed increased CTLA-4 expression and suppressive activity in vivo. (A) The number of CD4+, CD8+, CD44+CD4+, and CD44+CD8+ T cells in LNs from indicated mice as in Fig. 3C. (B) FACS analysis of FoxP3 and CTLA-4 expression gated on CD4+ T cells from the SPL and LNs of 2-mo-old PD-1 WT or PD-1 KO mice on the C57BL/6 background. Numbers in plots indicate percentage of cells in each gate. Data are representative of 3 to ∼6 mice per group. Bars represent the means (±SEM). *P < 0.05, **P < 0.01, ***P < 0.001; ns, not significant.
PD-1 Deficiency Promotes the Generation of Effector T Cells with a History of FoxP3 Expression.
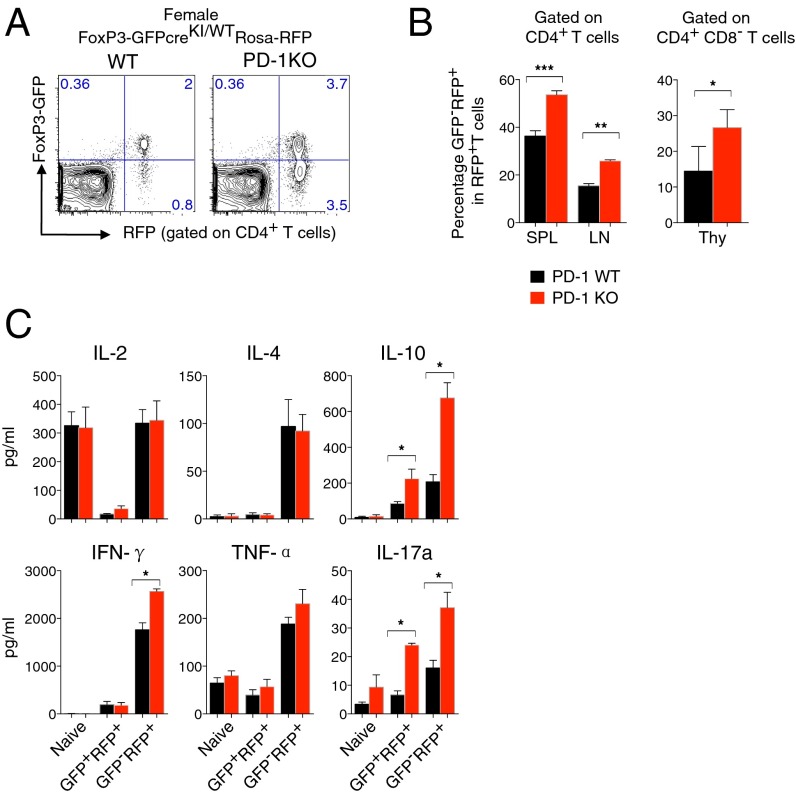
The above conclusion raises the question as to why PD-1 deficiency causes severe autoimmunity in FoxP3-GFPcreKI/Y PD-1 KO mice, despite generation of Treg cells with increased function. We hypothesized that some Treg cells may contribute to the enrichment of effector/memory T-cell compartment with autoimmune potentials after losing their FoxP3 expression. The breeding of FoxP3-GFPcreKI with Rosa26-YFP mice, a CRE-reporter strain, allows stable in vivo labeling of the cells that once expressed GFP (20). Thus, the GFP−YFP+ cells reporting the previous expression of FoxP3 are designated as ex-FoxP3 (20). We took advantage of this system and bred FoxP3-GFPcreKI PD-1 KO mice with the Rosa26 red fluorescent protein (RFP) strain, instead of Rosa26-YFP (25), to monitor the development of ex-FoxP3 cells in mice with PD-1 deficiency (Fig. S1B). We first compared the effect of PD-1 on Treg cells in healthy female FoxP3-GFPcreKI/WT PD-1 KO Rosa-RFP mice. Consistent with a PD-1–deficient phenotype, we observed expansion of Treg cells in FoxP3-GFPcreKI/WT Rosa-RFP mice in the absence of PD-1 (Fig. 4A). Because the homeostatic control of Treg cell expansion is normally quite solid, such significant changes in the frequency of Treg cells suggest the existence of a powerful regulatory mechanism of Treg cell homeostasis by PD-1.
Fig. 4.
The increase of ex-FoxP3 T cells in female FoxP3-GFPcreKI/WT PD-1 KO mice. (A) GFP and RFP expression from SPL of 4- to ∼8-wk-old FoxP3-GFPcreKI/WT Rosa-RFP PD-1 KO mice. (B) Percentage of GFP−RFP+ (ex-FoxP3) T cells within RFP+ T cells (Treg plus ex-FoxP3) of CD4+ T cells or CD4−CD8+ thymocytes (Thy). (C) The same number of naïve, GFP+RFP+, and GFP−RFP+ of CD4+ T cells was sorted from mice in A and stimulated with phorbol 12-myristate 13-acetate (PMA) and ionomycin; the level of cytokine was measured. Data are shown from 3 to ∼6 mice per group. Bars represent the means (±SEM). *P < 0.05, **P < 0.01, ***P < 0.001,.
Interestingly, there was a significant increase of CD4+GFP−RFP+ cells (ex-FoxP3) in the peripheral lymphoid organs as well as the thymus of heterozygous female FoxP3-GFPcreKI/WT mice bearing the Rosa26-RFP transgene and the deletion of PD-1 compared with the same mice with the WT PD-1 allele (Fig. 4 A and B). When activated in vitro, sorted GFP−RFP+ex-FoxP3 T cells showed increased production of various cytokines compared with GFP+RFP+T cells, confirming previous observations of their effector potentials (20) (Fig. 4C). PD-1–deficient ex-FoxP3 secreted higher levels of proinflammatory (IFN-γ, IL-17A) as well as anti-inflammatory (IL-10) cytokines than PD-1–sufficient ex-FoxP3 cells (Fig. 4C). These data clearly indicate that in noninflammatory conditions, PD-1 expression restricts the expansion of Treg cells, contributes to maintenance of FoxP3 expression, and prevents the generation of ex-FoxP3 cells with the powerful effector function.
Ex-FoxP3 Cells in PD-1 KO FoxP3-GFPcreKI/Y Rosa-RFP Mice Contain Autoreactive Cells.
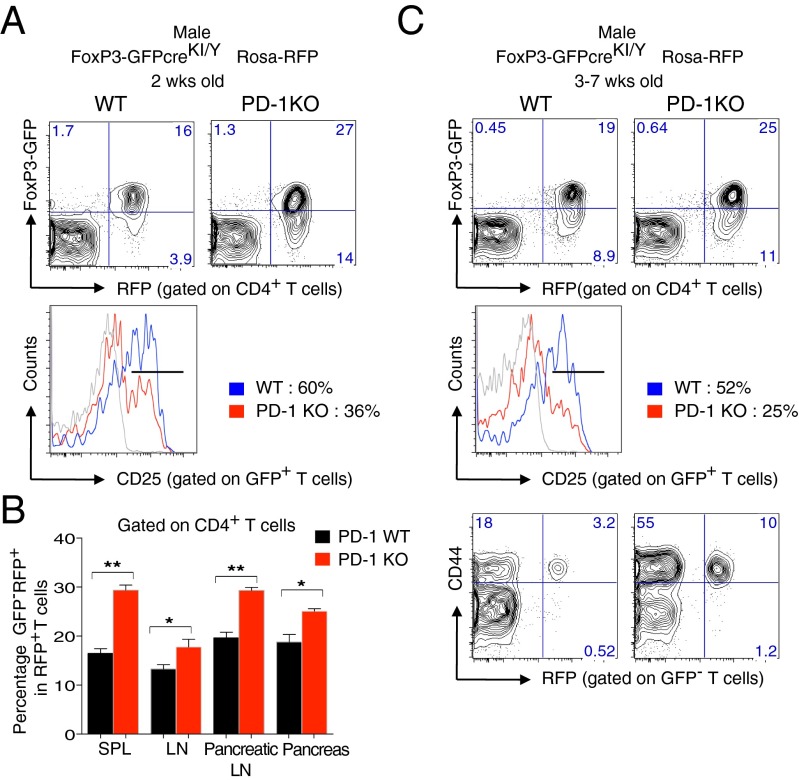
We next evaluated the characteristics of Treg cells including the generation and effector function of ex-FoxP3 T cells in inflammatory autoimmune settings by examining male PD-1 KO FoxP3-GFPcreKI/Y Rosa-RFP mice. Remarkably, before the onset of lympho-proliferation, the 2-wk-old PD-1–deficient fate-mapped mice showed a significant increase in ex-FoxP3 cells compared with their PD-1 WT counterparts not only in the SPL and LNs but also in the pancreatic LNs and pancreas (Fig. 5 A and B). In addition, the frequency of GFP+ cells was increased, but these cells may be of a different nature, as many of them did not express CD25 (Fig. 5A).
Fig. 5.
ex-FoxP3 T cells in autoimmune FoxP3-GFPcreKI/Y PD-1 KO mice. (A) FACS analysis of Tregs, ex-FoxP3 T cells, and CD25+ T cells from the SPL of 2-wk-old male FoxP3-GFPcreKI/Y PD-1 KO mice. (B) Statistical analysis of the ex-FoxP3 (GFP-RFP+) cells within RFP+ T cells in A. (C) FACS analysis of SPL cells from 3- to ∼7-wk-old male FoxP3-GFPcreKI/Y Rosa-RFP PD-1 KO mice. Data are from 3 to ∼6 mice per group. Bars represent the means (±SEM). *P < 0.05, **P < 0.01.
Interestingly, after the onset of CD4+ T-cell expansion and of the autoimmune phenotypes, the frequency of ex-FoxP3 T cells became closer to the controls by unknown reasons (Fig. 5C). However, the frequency of CD44+GFP−RPF+ ex-FoxP3 T cells with effector/memory phenotype was significantly increased in lymphoid tissues of PD-1–deficient fate-mapped mice (Fig. 5C). This result clearly shows an increased flow of cells that once expressed FoxP3 into the effector/memory T-cell compartment.
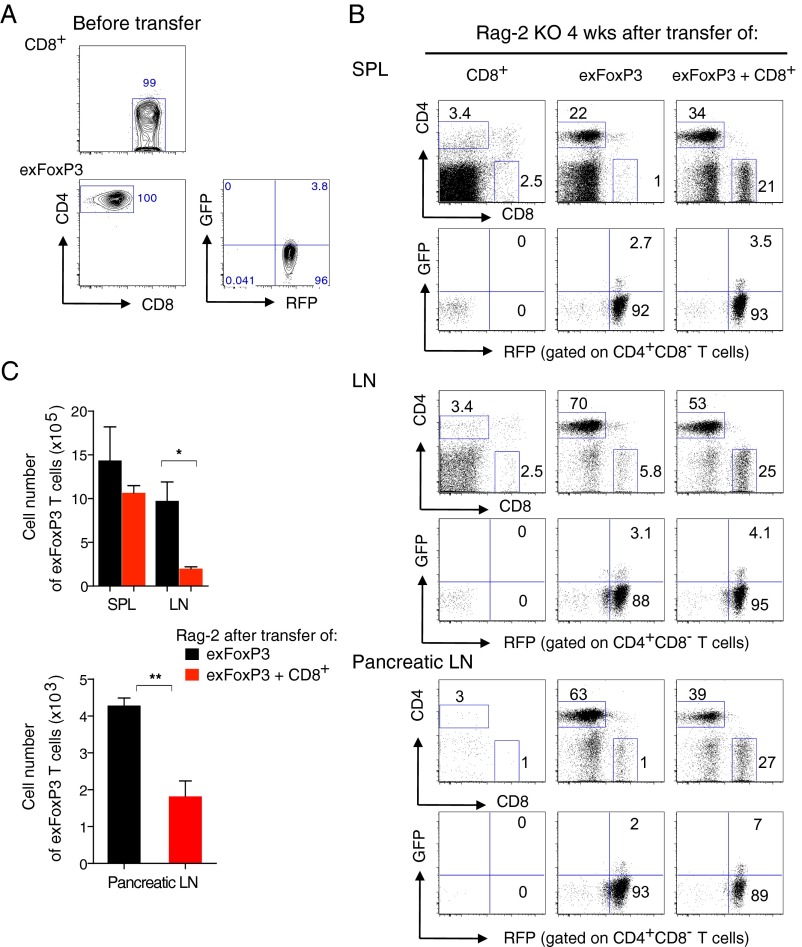
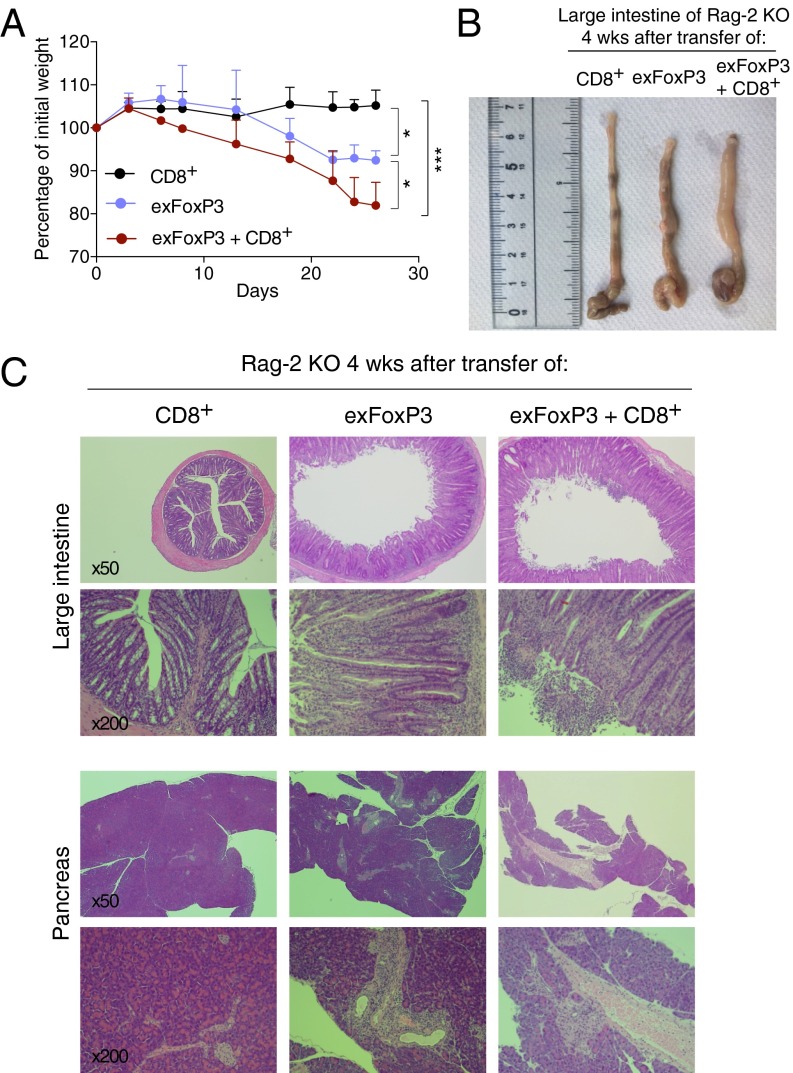
We next tested the pathogenic potential of ex-FoxP3 T cells from the pancreas and pancreatic LNs of male PD-1 KO FoxP3-GFPcreKI/Y Rosa-RFP in vivo by transferring them with or without CD8+ T cells into Rag-2 KO mice. Because only a small number of ex-FoxP3 T cells can be isolated from these tissues, we first expanded them in vitro. Then, we resorted CD4+GFP−RFP+ cells before the transfer, as some of the expanded ex-FoxP3 reexpressed FoxP3, as previously reported (21) (Fig. S4A). Interestingly, 2 wk after transfer, the mice that received ex-FoxP3 T cells, and ex-FoxP3 T cells together with CD8+ T cells but not CD8+ T cells alone, began to lose weight and had severe diarrhea (Fig. 6A). Mice were examined 4 wk after the transfer, revealing that the large intestine was significantly shorter and swollen in Rag-2 KO mice that received ex-FoxP3 T cells or ex-FoxP3 together with CD8+ T cells but not CD8+ T cells only (Fig. 6B). Histological analysis confirmed the presence of severe colitis, with huge infiltrates of mononuclear cells and disruption of colonic structures only in mice receiving ex-FoxP3 T cells alone or the combination of ex-FoxP3 and CD8+ T cells (Fig. 6C and Table S2). Similar mononuclear infiltrates were observed in the pancreas, especially around the pancreatic duct and vessels (Fig. 6C, Lower). Unexpectedly, the more pronounced infiltrates were detected in Rag-2 KO mice transferred with ex-FoxP3 T cells only (Fig. 6C, Lower and Table S2). This could be due to better expansion of ex-FoxP3 T cells by more abundant IL-2 in the absence of competition with CD8+ T cells, as suggested by the increased numbers of ex-FoxP3 (CD4+) T cells in LNs and pancreatic LNs in these mice compared with those receiving the combination of ex-FoxP3 T cells together with CD8+ T cells (Fig. S4 B and C). These results clearly indicate that ex-FoxP3 T cells have pathogenic potential and contribute to pathology either directly or indirectly by helping other effector T populations, like cytotoxic CD8+ T cells.
Fig. S4.
PD-1–deficient CD8 and ex-FoxP3 transferred Rag-2 KO mice. (A) Before transfer, CD8+ and ex-FoxP3 T cells as in Fig. 6A were resorted and analyzed for FACS. (B) FACS analysis of CD8 and ex-FoxP3 expression in the SPL, LNs, and pancreatic LNs of Rag-2 KO mice 4 wk after transfer of each indicated cell. (C) The absolute number of ex-FoxP3 T cells in the SPL, LNs, and pancreatic LNs of mice as in B. Numbers in plots indicate percentage of cells in each gate. Representative data of 3 to ∼4 mice for each group are shown. Bars represent the means (±SEM). *P < 0.05, **P < 0.01.
Fig. 6.
ex-FoxP3 T cells contain autoreactive cells with pathogenic potential. (A) CD8+, ex-FoxP3, or the combination of CD8+ and ex-FoxP3 (1:1) T cells from pancreatic LNs and the pancreas of FoxP3-GFPcreKI/Y Rosa-RFP PD-1 KO mice were transferred into Rag-2 KO mice (SI Materials and Methods). Body weight was monitored for 4 wk. The data are shown as a ratio of weight before injection. Statistical analysis was performed at 4 wk. (B) large intestine of the recipients at 4 wk. (C) H&E staining of the large intestine and pancreas of mice in B (magnification, 50× and 200×). Representative data of 3 to ∼4 mice per each group are shown. Bars represent the means (± SD). *P < 0.05, ***P < 0.001.
Table S2.
Histological examination of Rag-2 KO mice with adoptive transfer
| Organ | Donor cells | Score | Inflammatory cell infiltration in the exocrine pancreas | Insulitis |
| Large intestine | CD8+ | 0 to ∼1 | ||
| ex-FoxP3 | 2 to ∼3 | |||
| ex-FoxP3 + CD8+ | 3 | |||
| CD44+RFP− | 3 | |||
| CD44+RFP− + CD8+ | 4 | |||
| Pancreas | CD8+ | 0 to ∼1 | 0 | |
| ex-FoxP3 | 2 | 0 to ∼1 | ||
| ex-FoxP3 + CD8+ | 1 | 0 to ∼1 | ||
| CD44+RFP− | 3 | 1 | ||
| CD44+RFP− + CD8+ | 1 to ∼2 | 0 to ∼1 |
The table summarizes the score of inflammation of the large intestine and pancreas from Rag-2 KO mice 3 wk after transfer of the combination of CD44+RFP− + CD8+ or 4 wk after transfer of other indicated T cells from pancreatic LNs and the pancreas of male FoxP3-GFPcreKI/Y Rosa-RFP PD-1 KO mice. Score 0, normal colon mucosa or absent of lymphocytic cell infiltration; score 1, mild mucosal changes or mild infiltrates; score 2, mucosal abrasion or moderate infiltrates; score 3, mucosal erosion, ulceration, or marked infiltrates; score 4, mucosa atrophy and few mitosis in crypt, or almost complete destruction of organs.
Discussion
We found that the “genetic surgery” of the FoxP3 locus fortuitously resulted in mildly reduced expression of endogenous FoxP3 without obvious functional consequences in FoxP3-GFPcreKI mice. However, when crossed with PD-1–deficient mice, the FoxP3-GFPcreKI male mice developed acute and lethal autoimmunity. These mice provided a useful model to address how PD-1 modulates the Treg cell biology in autoimmune settings. The early death was prevented by the transfer of FoxP3-sufficient Treg cells, irrespective of whether they were from WT or PD-1–deficient donors. It should be noted that the Treg cells from PD-1 KO mice provided even better rescue compared with Treg cells from WT mice, by causing a statistically significant reduction of effector/memory CD4+ and CD8+ T cells. Sage et al. have demonstrated that PD-1 restricts the number and the function of follicular Tregs (Tfr) (26). Our study expands this finding to conventional Treg cells. Both FoxP3 expression and Treg function require TCR recognition of self-antigens (27, 28). We speculate that, as PD-1 attenuates TCR downstream signaling, PD-1 deficiency may enhance TCR signaling in Treg cells, which induces their proliferation and in turn strengthens their regulatory function in vivo.
We demonstrated that PD-1 negatively regulates the appearance of ex-FoxP3 cells. Previous studies reported the appearance of ex-FoxP3 cells, especially at the inflammatory sites such as the pancreatic LNs and islets of NOD mice (20), the joints in a collagen-induced arthritis mouse model (29), and CNS in an experimental autoimmune encephalomyelitis (EAE) model (30). It was proposed that the ex-FoxP3 cells derive from genetic reprogramming of committed Treg cells (20, 31). On the other hand, Rubtsov et al. showed that FoxP3+ Treg cells are stable (32). Beside the two opposing models, Miyao et al. proposed that ex-FoxP3 cells did not come from the “genuine” Treg cells but rather came from conventional CD4+ T cells that transiently expressed FoxP3 as a consequence of strong self-interaction in vivo (21). We found the increase of ex-FoxP3 cells in PD-1 KO mice in the C57BL/6 background, before onset of nephritis or arthritis was reported in these mice (22). As PD-1 is indisputably an attenuator for antigen receptor signaling, it is possible that PD-1–deficient Tregs would receive stronger TCR stimulation in vivo and could convert into FoxP3-negative cells with strong self-reactivity. It is also possible that “promiscuous expression” of FoxP3 in conventional T cells is augmented in the absence of PD-1, resulting in an increase of cells with a history of transient FoxP3 expression. We cannot exclude either possibility at this stage.
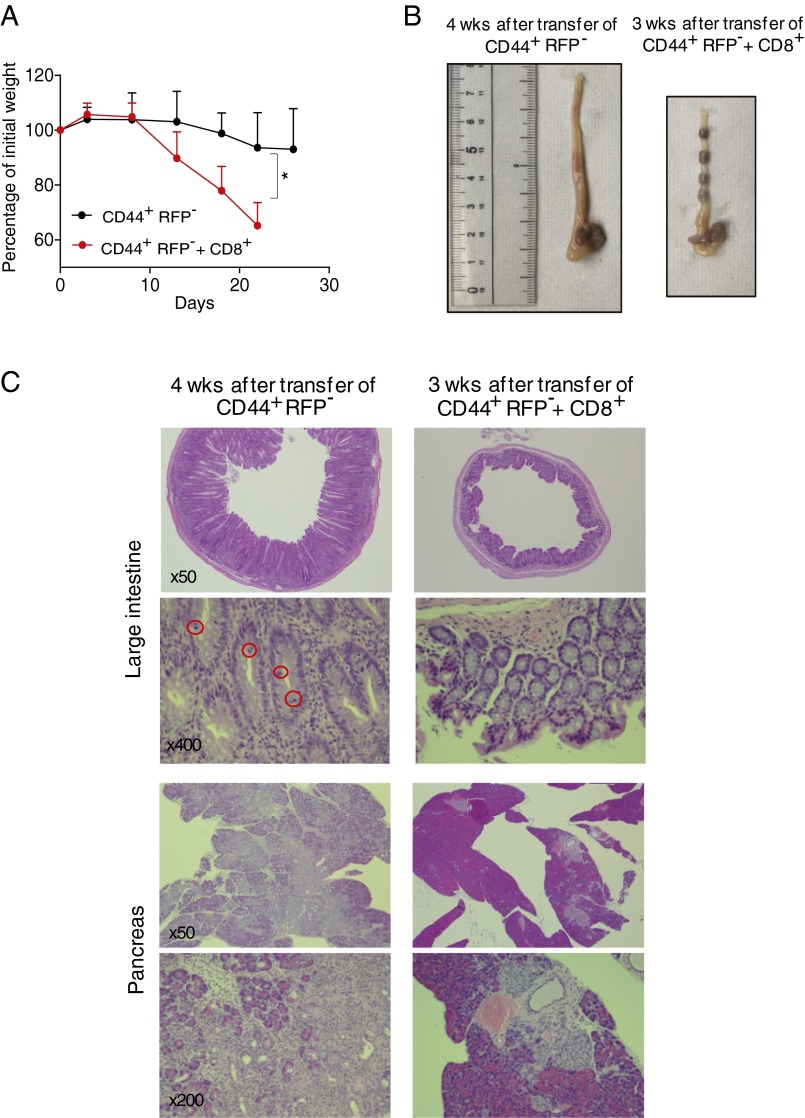
In the diseased FoxP3-GFPcreKI PD-1 KO, we initially thought it unlikely that the ex-FoxP3 T cells could directly cause autoimmunity. However, at least in the Rag-2 transfer system, ex-FoxP3 T cells clearly induced autoimmune destruction in the pancreas and also in the colon, which was as severe as non-FoxP3–experienced CD44+ effector/memory T cells (Fig. S5 and Table S2). The presence of CD8+ T cells aggravated the autoimmune phenotype in the colon. The targeting of the colon in the Rag-2 KO mice but not in the FoxP3-GFPcreKI PD-1 KO mice could be due to a repertoire shift of the ex-FoxP3 cells after their activation and skewed expansion in vitro, among other possibilities. Taken together, our results indicate that PD-1 signaling maintains homeostasis of the Treg cells and the fine-tuned balance between the regulatory and effector T-cell compartment. Stronger TCR signaling may induce FoxP3 expression but could also cause additional transcriptional modifications leading to down-regulation and eventually loss of FoxP3 expression and acquisition of effector functions (i.e., cytokine production) by ex-FoxP3 T cells. Such regulation of Treg homeostasis is consistent with the feedback control perspective rather than the lineage perspective (33).
Fig. S5.
Proinflamatoy activities of PD-1–deficient CD44+RFP− T cells in Rag-2 KO mice. (A) CD8+ and CD44+RFP−GFP−CD4+ (CD44+RFP−) T cells were sorted from pancreatic LNs and the pancreas of male FoxP3-GFPcreKI/Y Rosa-RFP PD-1 KO mice and expanded in vitro by CD3/CD28 beads in the presence of IL-2 for 10 d; each group of cells was resorted and CD44+RFP− or the combination of CD8+ and CD44+RFP− (1:1) T cells were respectively transferred into Rag-2 KO mice. Body weight was monitored during the 3 to ∼4 wk for each group of mice. The mean weight is shown as a ratio of weight before injection. Statistical analysis was performed between each group after 3 wk of injection. (B) Picture of large intestine of Rag-2 KO mice transferred with indicated cells for 3 or 4 wk. (C) H&E staining of the large intestine and pancreas of mice as in B (magnification, 50×, 200×, and 400×). Mitosis in crypt is marked by a red circle. Representative data of 3 to ∼4 mice for each group are shown. Data are shown as the means (±SD). *P < 0.05.
It is interesting that even a modest deficiency of FoxP3 expression by Treg cells in FoxP3-GFPcreKI mice results in a spontaneous and accelerated autoimmune phenotype with a fatal outcome when combined with PD-1 deficiency. PD-1–deficient mice developed autoimmune phenotypes, which were strain-specific (12, 22, 34, 35). In the C57BL/6 background, PD-1 deficiency induced arthritis and nephritis (22), whereas in the BALB/c background, deficiency induced mostly myocarditis and gastritis (12, 34). Neonatal thymectomy in PD-1 KO mice on the BALB/c background was shown to cause lethal autoimmune hepatitis, which was attributed to combined deficiency of Treg cells and PD-1 (34). However, thymectomy can cause other effects such as severe lymphopenia, which can support autoimmunity. The PD-1–deficient MRL strain of mice showed rapid and fatal autoimmune myocarditis for undefined reasons (35). A mild functional deficiency of Treg cells reported in this strain (36) might be synergizing with PD-1 deficiency for the development of a lethal phenotype. Besides Treg instability, reduced FoxP3 expression on Tregs might have caused excessive activation of conventional T cells. Under such conditions, self-reactive T cells may develop into the effector population. This could be an additive, Treg-nonautonomous effect of PD-1. In any case, we now show that, indeed, deficiency of PD-1 combined with even a mild insufficiency of FoxP3+ Treg cells results in an unexpectedly strong phenotype. In humans, polymorphysms of both FoxP3 and PD-1 associate with autoimmunity. Although the mutations that affect the exon of FoxP3 results in immune dysregulation, polyendocrinopathy, enteropathy, X-linked (IPEX) by itself, others mutations affecting intronic or noncoding regions that might alter the expression levels are relatively mild (6, 37). The lessons from our mice show that even such mild SNPs, if both molecules are affected, can provoke severe autoimmunity. It also suggests the requirement of careful immunological monitoring of cancer patients who are treated with both anti-CTLA4 and anti–PD-1 antibodies.
Taken together, our data suggest that PD-1 and FoxP3 work together for maintenance of peripheral tolerance but mostly through different pathways. PD-1 is involved in rheostatic modulation of the threshold of TCR signaling that prevents the development of autoreactive effector T cells and the following tissue destruction, whereas FoxP3 is sufficient for dominant regulation through maintaining the integrity of Treg function. Accumulative defects in these independent genetic factors can cause life-threatening autoimmune diseases in humans.
Materials and Methods
All of the experiments were carried out using the mice in the C57BL/6 background. The PD-1 KO, Rosa-RFPKI/WT, and FoxP3-GFPcreKI/Y mice were as described previously (21, 25, 38). PD-1 KO mice were initially crossed with reporter strains, and resulting F1 generation was extensively intercrossed to obtain PD-1 KO in reporter strains. Littermate or the appropriate age/sex-matched mice were used as control. All mice were housed in a specific pathogen-free facility, and all procedures followed protocols approved by the Animal Research Committee, Graduate School of Medicine, Kyoto University. All of the other methods and materials are described in figure legends or SI Materials and Methods.
SI Materials and Methods
Antibodies and Reagents.
The antibodies conjugated with various fluorophores for flow cytometry included CD4 (clone: GK1.5), CD8 (53-6.7), CD25 (PC61.5), and CD44 (1M7). The intracellular staining for CTLA-4 (UC10-4B9) and FoxP3 (FJK-16s) was performed by the FoxP3 intracellular staining kit (e-Bioscience). For cytokine detection, cells were stimulated with 50 ng/mL PMA and 500 ng/mL ionomycin for 3 d, and the supernatant was measured by the mouse Th1/Th2/Th17 Cytokine Kit (BD Biosciences).
Quantitative RT-PCR.
Total RNA was extracted by RNeasy Mini Kit (QIAGEN) and reverse-transcribed using reagents included in the QuantiTect SYBR Green RT-PCR Master Mix (QIAGEN). The 7500 Fast Real-Time PCR system (Applied Biosystems) was used for real-time PCR. Gene expression was normalized to the Gapdh expression. The following primers were used: FoxP3, forward 5′-GGCCCTTCTCCAGGACAGA-3′, reverse 5′-GCTGATCATGGCTGGGTTGT-3′ (39).
Adoptive Transfer.
The SPL and LN cells were isolated from PD-1 WT or PD-1 KO mice, CD4+ T cells were enriched by CD4 microbeads and autoMACS (Miltenyibiotec), and then 1 × 10⁶ Treg (CD4+CD25+) cells were further sorted on FACSAriaII (BD Sciences) and injected intraperitoneally into FoxP3-GFPcreKI/Y PD-1 KO male mice at day 3 after birth. For the Rag-2 KO mice transfer experiment, CD8 T cells and ex-FoxP3 (GFP−RFP+) cells were sorted from pancreatic LNs and the pancreas of male FoxP3-GFPcreKI/Y Rosa-RFPKI/WT PD-1 KO mice and expanded in vitro by Dynabeads mouse T-Activator CD3/CD28 (VERITAS) in the presence of recombinant human IL-2 (PEPROTECH). After 10 d of culture, each group of cells was sorted again, and then 1 × 10⁶ CD8+, ex-FoxP3, or the combination of CD8+ and ex-FoxP3 (1:1) T cells were transferred i.v. into Rag-2 KO mice.
Preparation of Mononuclear Cells from the Pancreas.
The tissue was cut into about 3–5-mm-thick pieces and incubated 30 min in RPMI medium 1640 (Life Technologies, serum free) with 0.25 mg/mL DNase I (Roche) and 2 mg/mL collagenase D (Roche) at 37 °C on a rotator. The tissue was dissociated with a P1000 by pipetting 20 times (need to cut tip) and incubated 10 min at 37 °C on a rotator, and then the tissue was further dissociated with a P1000 by pipetting 20 times (uncut tip). Digested tissue was washed twice with RPMI medium 1640 [2% (vol/vol) FBS] and strained through a 70-µm cell strainer (Greiner Bio-One). Cells were analyzed in a flow cytometer (FACSCantoII, BD Biosciences).
Statistical Analysis.
The survival curves were compared using a log-rank test, and means of groups were analyzed by two-tailed Student’s t test or one-way ANOVA. P < 0.05 was considered significant.
Acknowledgments
We thank Drs. Tadahisa Mashita (MAIZURU Animal Medical Center) and Hiroshi Hiai (Kyoto University) for their generous help on animal pathology and Matteo Guerrini (RIKEN Center for Integrative Medical Sciences) for critically reading the manuscript. The research was supported by KAKENHI Grants 25460363 (to S.C.) and 22000015 (to T.H.), the Mochida Foundation (S.C.), and the Takeda Foundation (S.C.).
Footnotes
The authors declare no conflict of interest.
This article contains supporting information online at www.pnas.org/lookup/suppl/doi:10.1073/pnas.1608873113/-/DCSupplemental.
References
- 1.Wu Y, et al. FOXP3 controls regulatory T cell function through cooperation with NFAT. Cell. 2006;126(2):375–387. doi: 10.1016/j.cell.2006.05.042. [DOI] [PubMed] [Google Scholar]
- 2.Ono M, et al. Foxp3 controls regulatory T-cell function by interacting with AML1/Runx1. Nature. 2007;446(7136):685–689. doi: 10.1038/nature05673. [DOI] [PubMed] [Google Scholar]
- 3.Wing K, et al. CTLA-4 control over Foxp3+ regulatory T cell function. Science. 2008;322(5899):271–275. doi: 10.1126/science.1160062. [DOI] [PubMed] [Google Scholar]
- 4.Rudd CE, Taylor A, Schneider H. CD28 and CTLA-4 coreceptor expression and signal transduction. Immunol Rev. 2009;229(1):12–26. doi: 10.1111/j.1600-065X.2009.00770.x. [DOI] [PMC free article] [PubMed] [Google Scholar]
- 5.Gough SC, Walker LS, Sansom DM. CTLA4 gene polymorphism and autoimmunity. Immunol Rev. 2005;204:102–115. doi: 10.1111/j.0105-2896.2005.00249.x. [DOI] [PubMed] [Google Scholar]
- 6.Oda JM, Hirata BK, Guembarovski RL, Watanabe MA. Genetic polymorphism in FOXP3 gene: Imbalance in regulatory T-cell role and development of human diseases. J Genet. 2013;92(1):163–171. doi: 10.1007/s12041-013-0213-7. [DOI] [PubMed] [Google Scholar]
- 7.Chikuma S, Bluestone JA. Expression of CTLA-4 and FOXP3 in cis protects from lethal lymphoproliferative disease. Eur J Immunol. 2007;37(5):1285–1289. doi: 10.1002/eji.200737159. [DOI] [PubMed] [Google Scholar]
- 8.Vivier E, Daëron M. Immunoreceptor tyrosine-based inhibition motifs. Immunol Today. 1997;18(6):286–291. doi: 10.1016/s0167-5699(97)80025-4. [DOI] [PubMed] [Google Scholar]
- 9.Parry RV, et al. CTLA-4 and PD-1 receptors inhibit T-cell activation by distinct mechanisms. Mol Cell Biol. 2005;25(21):9543–9553. doi: 10.1128/MCB.25.21.9543-9553.2005. [DOI] [PMC free article] [PubMed] [Google Scholar]
- 10.Okazaki T, Maeda A, Nishimura H, Kurosaki T, Honjo T. PD-1 immunoreceptor inhibits B cell receptor-mediated signaling by recruiting src homology 2-domain-containing tyrosine phosphatase 2 to phosphotyrosine. Proc Natl Acad Sci USA. 2001;98(24):13866–13871. doi: 10.1073/pnas.231486598. [DOI] [PMC free article] [PubMed] [Google Scholar]
- 11.Iwai Y, Terawaki S, Honjo T. PD-1 blockade inhibits hematogenous spread of poorly immunogenic tumor cells by enhanced recruitment of effector T cells. Int Immunol. 2005;17(2):133–144. doi: 10.1093/intimm/dxh194. [DOI] [PubMed] [Google Scholar]
- 12.Okazaki T, Chikuma S, Iwai Y, Fagarasan S, Honjo T. A rheostat for immune responses: The unique properties of PD-1 and their advantages for clinical application. Nat Immunol. 2013;14(12):1212–1218. doi: 10.1038/ni.2762. [DOI] [PubMed] [Google Scholar]
- 13.Fife BT, et al. Insulin-induced remission in new-onset NOD mice is maintained by the PD-1-PD-L1 pathway. J Exp Med. 2006;203(12):2737–2747. doi: 10.1084/jem.20061577. [DOI] [PMC free article] [PubMed] [Google Scholar]
- 14.Okazaki T, Wang J. PD-1/PD-L pathway and autoimmunity. Autoimmunity. 2005;38(5):353–357. doi: 10.1080/08916930500124072. [DOI] [PubMed] [Google Scholar]
- 15.Chung Y, et al. Follicular regulatory T cells expressing Foxp3 and Bcl-6 suppress germinal center reactions. Nat Med. 2011;17(8):983–988. doi: 10.1038/nm.2426. [DOI] [PMC free article] [PubMed] [Google Scholar]
- 16.Franceschini D, et al. PD-L1 negatively regulates CD4+CD25+Foxp3+ Tregs by limiting STAT-5 phosphorylation in patients chronically infected with HCV. J Clin Invest. 2009;119(3):551–564. doi: 10.1172/JCI36604. [DOI] [PMC free article] [PubMed] [Google Scholar]
- 17.Jie HB, et al. Intratumoral regulatory T cells upregulate immunosuppressive molecules in head and neck cancer patients. Br J Cancer. 2013;109(10):2629–2635. doi: 10.1038/bjc.2013.645. [DOI] [PMC free article] [PubMed] [Google Scholar]
- 18.Chikuma S, et al. PD-1-mediated suppression of IL-2 production induces CD8+ T cell anergy in vivo. J Immunol. 2009;182(11):6682–6689. doi: 10.4049/jimmunol.0900080. [DOI] [PubMed] [Google Scholar]
- 19.DuPage M, Bluestone JA. Harnessing the plasticity of CD4 T cells to treat immune-mediated disease. Nat Rev Immunol. 2016;16(3):149–163. doi: 10.1038/nri.2015.18. [DOI] [PubMed] [Google Scholar]
- 20.Zhou X, et al. Instability of the transcription factor Foxp3 leads to the generation of pathogenic memory T cells in vivo. Nat Immunol. 2009;10(9):1000–1007. doi: 10.1038/ni.1774. [DOI] [PMC free article] [PubMed] [Google Scholar]
- 21.Miyao T, et al. Plasticity of Foxp3(+) T cells reflects promiscuous Foxp3 expression in conventional T cells but not reprogramming of regulatory T cells. Immunity. 2012;36(2):262–275. doi: 10.1016/j.immuni.2011.12.012. [DOI] [PubMed] [Google Scholar]
- 22.Nishimura H, Nose M, Hiai H, Minato N, Honjo T. Development of lupus-like autoimmune diseases by disruption of the PD-1 gene encoding an ITIM motif-carrying immunoreceptor. Immunity. 1999;11(2):141–151. doi: 10.1016/s1074-7613(00)80089-8. [DOI] [PubMed] [Google Scholar]
- 23.Bettini ML, et al. Loss of epigenetic modification driven by the Foxp3 transcription factor leads to regulatory T cell insufficiency. Immunity. 2012;36(5):717–730. doi: 10.1016/j.immuni.2012.03.020. [DOI] [PMC free article] [PubMed] [Google Scholar]
- 24.Darce J, et al. An N-terminal mutation of the Foxp3 transcription factor alleviates arthritis but exacerbates diabetes. Immunity. 2012;36(5):731–741. doi: 10.1016/j.immuni.2012.04.007. [DOI] [PMC free article] [PubMed] [Google Scholar]
- 25.Luche H, Weber O, Nageswara Rao T, Blum C, Fehling HJ. Faithful activation of an extra-bright red fluorescent protein in “knock-in” Cre-reporter mice ideally suited for lineage tracing studies. Eur J Immunol. 2007;37(1):43–53. doi: 10.1002/eji.200636745. [DOI] [PubMed] [Google Scholar]
- 26.Sage PT, Francisco LM, Carman CV, Sharpe AH. The receptor PD-1 controls follicular regulatory T cells in the lymph nodes and blood. Nat Immunol. 2013;14(2):152–161. doi: 10.1038/ni.2496. [DOI] [PMC free article] [PubMed] [Google Scholar]
- 27.Killebrew JR, et al. A self-reactive TCR drives the development of Foxp3+ regulatory T cells that prevent autoimmune disease. J Immunol. 2011;187(2):861–869. doi: 10.4049/jimmunol.1004009. [DOI] [PMC free article] [PubMed] [Google Scholar]
- 28.Levine AG, Arvey A, Jin W, Rudensky AY. Continuous requirement for the TCR in regulatory T cell function. Nat Immunol. 2014;15(11):1070–1078. doi: 10.1038/ni.3004. [DOI] [PMC free article] [PubMed] [Google Scholar]
- 29.Komatsu N, et al. Pathogenic conversion of Foxp3+ T cells into TH17 cells in autoimmune arthritis. Nat Med. 2014;20(1):62–68. doi: 10.1038/nm.3432. [DOI] [PubMed] [Google Scholar]
- 30.Bailey-Bucktrout SL, et al. Self-antigen-driven activation induces instability of regulatory T cells during an inflammatory autoimmune response. Immunity. 2013;39(5):949–962. doi: 10.1016/j.immuni.2013.10.016. [DOI] [PMC free article] [PubMed] [Google Scholar]
- 31.Bailey-Bucktrout SL, Bluestone JA. Regulatory T cells: Stability revisited. Trends Immunol. 2011;32(7):301–306. doi: 10.1016/j.it.2011.04.002. [DOI] [PMC free article] [PubMed] [Google Scholar]
- 32.Rubtsov YP, et al. Stability of the regulatory T cell lineage in vivo. Science. 2010;329(5999):1667–1671. doi: 10.1126/science.1191996. [DOI] [PMC free article] [PubMed] [Google Scholar]
- 33.Ono M, Tanaka RJ. Controversies concerning thymus-derived regulatory T cells: Fundamental issues and a new perspective. Immunol Cell Biol. 2016;94(1):3–10. doi: 10.1038/icb.2015.65. [DOI] [PMC free article] [PubMed] [Google Scholar]
- 34.Kido M, et al. Fatal autoimmune hepatitis induced by concurrent loss of naturally arising regulatory T cells and PD-1-mediated signaling. Gastroenterology. 2008;135(4):1333–1343. doi: 10.1053/j.gastro.2008.06.042. [DOI] [PubMed] [Google Scholar]
- 35.Wang J, et al. PD-1 deficiency results in the development of fatal myocarditis in MRL mice. Int Immunol. 2010;22(6):443–452. doi: 10.1093/intimm/dxq026. [DOI] [PubMed] [Google Scholar]
- 36.Parietti V, Monneaux F, Décossas M, Muller S. Function of CD4+,CD25+ Treg cells in MRL/lpr mice is compromised by intrinsic defects in antigen-presenting cells and effector T cells. Arthritis Rheum. 2008;58(6):1751–1761. doi: 10.1002/art.23464. [DOI] [PubMed] [Google Scholar]
- 37.Bertsias GK, et al. Genetic, immunologic, and immunohistochemical analysis of the programmed death 1/programmed death ligand 1 pathway in human systemic lupus erythematosus. Arthritis Rheum. 2009;60(1):207–218. doi: 10.1002/art.24227. [DOI] [PubMed] [Google Scholar]
- 38.Nishimura H, Minato N, Nakano T, Honjo T. Immunological studies on PD-1 deficient mice: Implication of PD-1 as a negative regulator for B cell responses. Int Immunol. 1998;10(10):1563–1572. doi: 10.1093/intimm/10.10.1563. [DOI] [PubMed] [Google Scholar]
- 39.Molinero LL, Miller ML, Evaristo C, Alegre ML. High TCR stimuli prevent induced regulatory T cell differentiation in a NF-κB-dependent manner. J Immunol. 2011;186(8):4609–4617. doi: 10.4049/jimmunol.1002361. [DOI] [PMC free article] [PubMed] [Google Scholar]


