Significance
The structure of mitochondrial cristae in different species and tissues is highly variable. The molecular basis of these variations and their effect on mitochondrial function is not understood. Dimers of ATP synthase, the essential membrane protein complex that produces most of the ATP in the cell, are thought to shape lamellar cristae, for example in humans or yeasts. Here, we present the ATP synthase dimer structure from the ciliate Paramecium tetraurelia, which assembles into helical arrays around the outer perimeter of twisted tubular cristae. The similarities between the morphology of the helical arrays and the tubular cristae indicate that ATP synthase dimers are responsible for shaping the cristae of mitochondria.
Keywords: cryoelectron microscopy, subtomogram averaging, Paramecium, macromolecular organization, serial block face imaging
Abstract
F1Fo-ATP synthases are universal energy-converting membrane protein complexes that synthesize ATP from ADP and inorganic phosphate. In mitochondria of yeast and mammals, the ATP synthase forms V-shaped dimers, which assemble into rows along the highly curved ridges of lamellar cristae. Using electron cryotomography and subtomogram averaging, we have determined the in situ structure and organization of the mitochondrial ATP synthase dimer of the ciliate Paramecium tetraurelia. The ATP synthase forms U-shaped dimers with parallel monomers. Each complex has a prominent intracrista domain, which links the c-ring of one monomer to the peripheral stalk of the other. Close interaction of intracrista domains in adjacent dimers results in the formation of helical ATP synthase dimer arrays, which differ from the loose dimer rows in all other organisms observed so far. The parameters of the helical arrays match those of the cristae tubes, suggesting the unique features of the P. tetraurelia ATP synthase are directly responsible for generating the helical tubular cristae. We conclude that despite major structural differences between ATP synthase dimers of ciliates and other eukaryotes, the formation of ATP synthase dimer rows is a universal feature of mitochondria and a fundamental determinant of cristae morphology.
F1Fo-ATP synthases are ubiquitous, highly conserved energy-converting membrane protein complexes. ATP synthases produce ATP from ADP and inorganic phosphate (Pi) by rotary catalysis (1, 2) using the energy stored in a transmembrane electrochemical gradient. The ∼600-kDa monomer of the mitochondrial ATP synthase is composed of a soluble F1 subcomplex and a membrane-bound Fo subcomplex (3). The main components of the F1 subcomplex are the (αβ)3 hexamer and the central stalk (4). The Fo subcomplex includes a rotor ring of 8–15 hydrophobic c subunits (5), the peripheral stalk, and several small hydrophobic stator subunits. Protons flowing through the membrane part of the Fo subcomplex drive the rotation of the c-ring (6–9). The central stalk transmits the torque generated by c-ring rotation to the catalytic head of the F1 subcomplex, where it induces conformational changes of the α and β subunits that result in phosphate bond formation and the generation of ATP. The catalytic (αβ)3 hexamer is held stationary relative to the membrane region by the peripheral stalk (10, 11). Several high-resolution structures of the F1/rotor ring complexes have been solved by X-ray crystallography (12–16), and the structure of the complete assembly has been determined by cryoelectron microscopy (cryo-EM) (10, 17–20).
In mitochondria, the ATP synthase forms dimers in the inner membrane. In fungi, plants, and metazoans, the dimers are V-shaped and associate into rows along the highly curved ridges of lamellar cristae (19–22). Fo subcomplexes of the two monomers in the dimer interact in the lipid bilayer via a number of hydrophobic stator subunits (20, 23–25). Coarse-grained molecular dynamics simulations have suggested that the V-shape of the ATP synthase dimers induces local membrane curvature, which in turn drives the association of ATP synthase dimers into rows (20). The exact role of the dimer rows is unclear, however rows of ATP synthase dimers have been proposed to promote the formation of lamellar cristae in yeast (20, 26).
So far, all rows of ATP synthase dimers observed by electron cryotomography have been more or less straight (19–22, 27). However, an earlier deep-etch freeze-fracture study of mitochondria from the ciliate Paramecium multimicronucleatum revealed double rows of interdigitating 10-nm particles on helical tubular cristae (28). These particles were interpreted as ATP synthases, which, if correct, would suggest that the mitochondrial ATP synthase can assemble into rows that differ significantly from the standard geometry found in lamellar cristae (19, 21, 22).
To investigate the helical rows in more detail, we performed electron cryotomography of isolated mitochondrial membranes from Paramecium tetraurelia. Using subtomogram averaging, we show that these helical rows do indeed consist of ATP synthase molecules, as suggested by Allen et al. (28). However, unlike the V-shaped dimers of metazoans, the ATP synthase of this species forms U-shaped dimers, which have new and unusual structural features. When assembled into the helical rows, the ATP synthase monomers interdigitate, whereas the U-shaped dimers align side by side. Thus, rows of ATP synthase dimers seem to be a universal feature of all mitochondria. We propose that the particular shape of the P. tetraurelia ATP synthase dimer induces its assembly into helical rows, which in turn cause the formation of the helical tubular cristae of ciliates.
Results
ATP Synthase Dimers of P. tetraurelia Are U-Shaped.
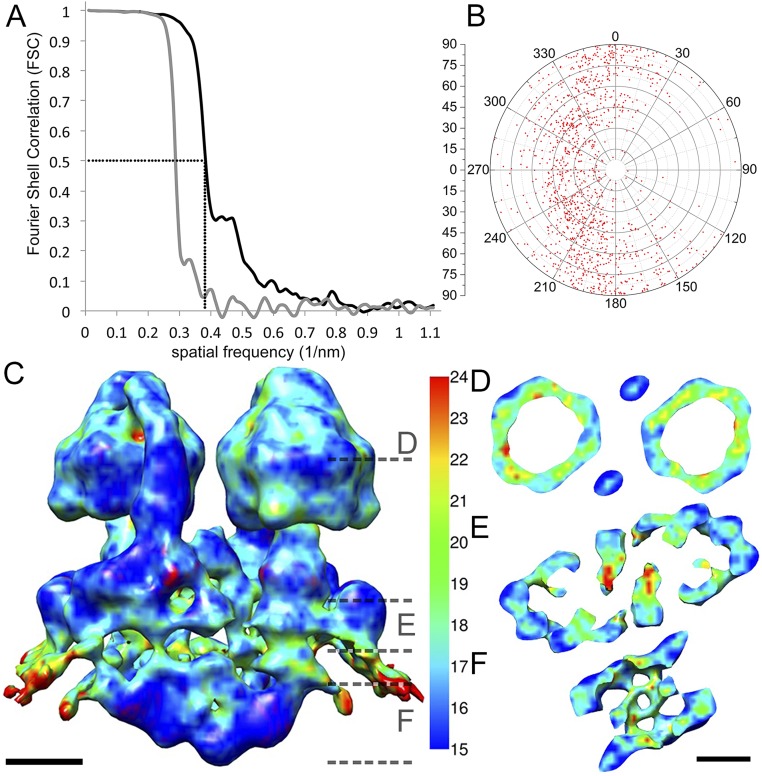
Electron cryotomograms of mitochondrial fragments from P. tetraurelia revealed helical tubular membrane vesicles with double rows of 10-nm particles protruding 18 nm from the membrane surface. The particles formed interdigitated arrays along the outer perimeter of the helical tubular vesicles, which have a cross-section of ∼40 nm. The 10-nm particles were identified as ATP synthases by subtomogram averaging. A total of 1,244 subvolumes, each containing a pair of 10-nm particles, were extracted and aligned to create a final average at a resolution of 26 Å (Fig. S1).
Fig. S1.
Resolution estimate and angular distribution of subvolumes. (A) FSC curves of two maps generated by randomly dividing the dataset into two halves after alignment. Black curve, original dataset; gray curve, dataset with phases randomized beyond 40 Å. Using the 0.5 criterion, the resolution of the U-shaped dimer is 26 Å (crosshairs). (B) Polar plot showing the angular distribution of subvolume z axes. (C–F) Local resolution of the unfiltered map estimated with the program Resmap (51). (C) Side view and (D–F) horizontal slices through the ATP synthase dimer as indicated by dashed lines in C. The peripheral stalk and intracrista region (blue to cyan) are more highly ordered than the F1 domain (cyan to green). (Scale bar, 5 nm.)
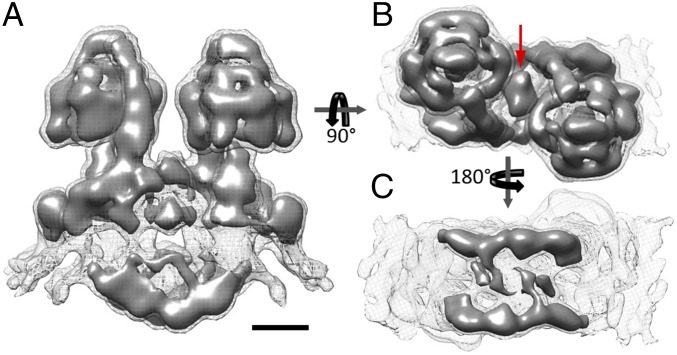
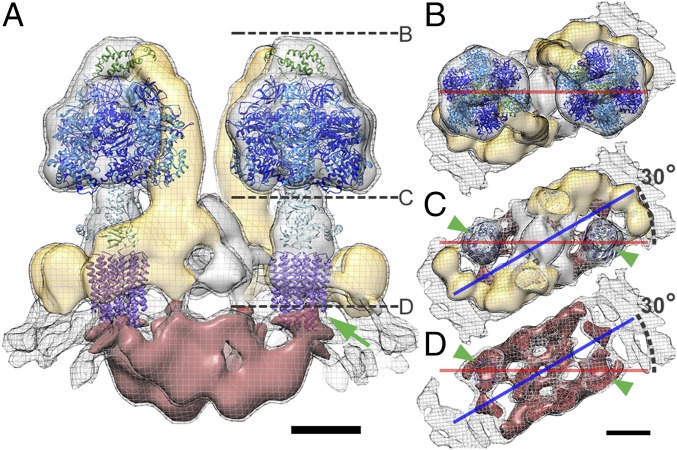
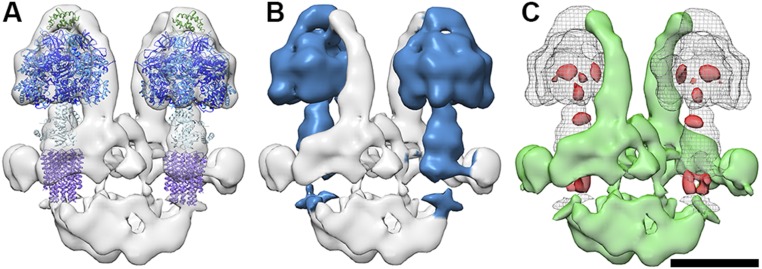
The resulting subtomogram average has twofold symmetry and reveals a pair of large protein complexes with parallel long axes (Fig. 1A and Movie S1). The complexes display the characteristic features of an F-type ATP synthase with a 10-nm F1 head connected to the membrane by a central and a peripheral stalk. The two ATP synthase monomers are ∼14.5 nm apart and form a U-shaped dimer with twofold symmetry. The peripheral stalk has a length of 30 nm and is offset by 45° from the axis connecting the F1 subcomplexes (Fig. 1B). From the apex of the F1 subcomplex, the peripheral stalk extends toward the membrane, where it forms an arc with a right-handed twist around the base of the central stalk, subtending an angle of 110° (Fig. 2C, yellow density).
Fig. 1.
Subtomogram average of the mitochondrial ATP synthase dimer from P. tetraurelia. (A) Side view, (B) matrix view, and (C) luminal view. The complex forms a U-shaped dimer with a bulky intracrista region. The red arrow indicates matrix density connecting the two monomers. The average was calculated from 1,244 subvolumes. Threshold levels: mesh, 2 σ; solid, 3.5 σ. (Scale bar, 5 nm.) See Movie S1.
Fig. 2.
Domain organization of the mitochondrial ATP synthase dimer with fitted atomic models. (A) Side view and (B–D) matrix view of ATP synthase dimer clipped as indicated by dashed lines in A. The peripheral stalk density is yellow, and the intracrista region is red. Threshold levels: mesh, 2 σ; solid, 3.25 σ. Atomic models are the F1c10 subcomplex (PDB ID code 3ZRY) (16) with the OSCP atomic model (green) taken from the fit of the F1/stator subcomplex (PDB ID code 2WSS) (13). The axis connecting the two F1 subcomplexes (red line) is rotated by 30° with respect to the long axis of the intracrista region (blue line). Green arrow (A) and arrowheads (C and D) indicate connection between the c10-ring and intracrista region. Color of subunits: α, blue; β, dark blue; γδε, light blue; c10-ring, purple; and OSCP, green. (Scale bars, 5 nm.) See Movie S1.
The Paramecium ATP synthase monomers share an extensive dimer interface, with protein densities connecting the two monomers on both sides of the membrane. On the matrix side, a globular density on the symmetry axis connects the two peripheral stalks (red arrow, Fig. 1B) and extends ∼5 nm into the matrix. On the luminal side, two parallel crescent-shaped densities extend from beneath the central stalk of one monomer to the peripheral stalk of the other (Fig. 1 A and C). These densities form a structure we refer to as the intracrista region of the complex (Fig. 2 A and D). Local resolution estimation indicated that this region and the peripheral stalk are the best-resolved features of the subtomogram average and thus the most rigid parts of the F-type ATP synthase in P. tetraurelia (Fig. S1 C–F).
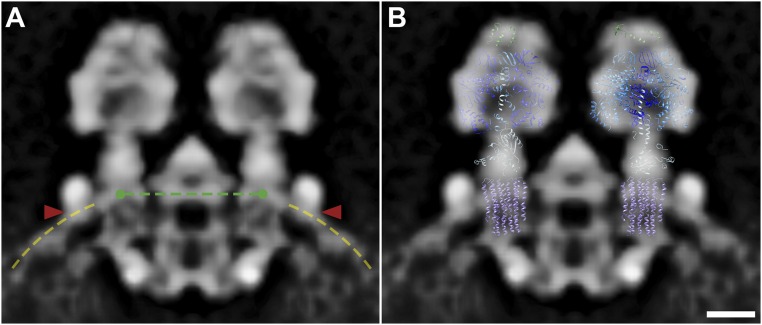
The two membrane leaflets of the lipid bilayer are well resolved in the subtomogram average (Figs. 1A and 2A). The membrane is flat between the two monomers but curves toward the intracrista region on either side of the dimer (Fig. S2A). This curvature appears to be imposed by the base of the peripheral stalk, which arcs around the central stalk and ends 2 nm below the point where the peripheral stalk first contacts the membrane (Fig. 2A and Fig. S2). Within the membrane, several densities link the intracrista region with the peripheral and central stalk. The largest of these forms a cylinder directly beneath the central stalk (Fig. S2A and Movie S2). The weaker density of the membrane-intrinsic regions is typical for membrane protein complexes imaged by cryo-EM at this resolution. This is due to contrast matching by the membrane phospholipid, which has a density in between that of the protein and the surrounding aqueous buffer (29).
Fig. S2.
Membrane curvature in the U-shaped ATP synthase dimer. (A) Longitudinal section through the P. tetraurelia ATP synthase dimer. The membrane is flat between the F1 subcomplexes (green dashed line) but curved on either side of the dimer (yellow dashed lines). The basal ends of the peripheral stalks (red arrowheads) are located 2 nm below the membrane interface of the central stalk (green circles). (B) Same as A but with the atomic models of the yeast F1c10 subcomplex (PDB ID code 3ZRY16) and OSCP from the bovine F1/stator subcomplex (PDB ID code 2WSS13). The atomic models are clipped to show only the central plane for clarity. Color of subunits: α, blue; β, dark blue; γδε, light blue; c10-ring, purple; and OSCP, green. The c-ring fits the cylindrical density in the membrane. (Scale bar, 5 nm.)
Fitting of Atomic Structures.
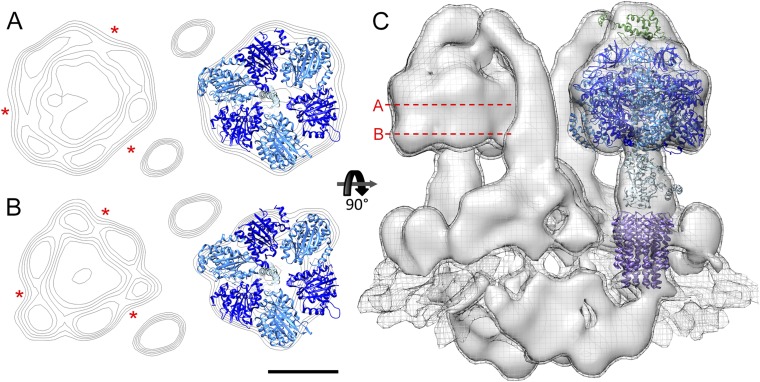
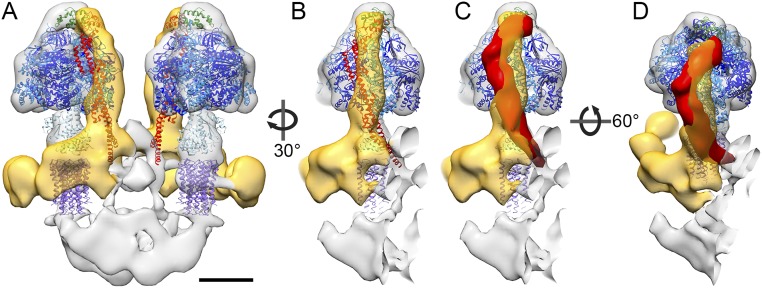
The atomic models of the yeast F1c10 subcomplex [Protein Data Bank (PDB) ID code 3ZRY] (16), the bovine F1/stator subcomplex (PDB ID code 2WSS) (13), and the bovine peripheral stalk subcomplex (PDB ID code 2CLY) (11) were placed into the subtomogram average volume. The catalytic (αβ)3 hexamer, the N-terminal domain of the oligomycin sensitivity-conferring protein (OSCP), and the central stalk fit the density well and together occupied 55% of the volume (Fig. 2, Fig. S3, and Movie S1). Cross-sections through the catalytic heads in the EM map indicate a hexamer of near-sixfold symmetry with alternating short and long sides (Fig. S4). The differences in the length of the sides allowed us to unambiguously assign the α and β subunits and hence the catalytic and noncatalytic αβ interfaces (4). As in the yeast and bovine complex (10, 13, 17, 20, 30) the peripheral stalk extends along a noncatalytic interface. The bovine peripheral stalk did not fit the P. tetraurelia subtomogram average well, as it curves in the opposite direction (Fig. S5).
Fig. S3.
The structure of the F1/c-ring subcomplex is conserved in the ATP synthase dimer of P. tetraurelia. (A) ATP synthase dimer of P. tetraurelia fitted with the atomic models of the yeast F1c10 subcomplex (PDB ID code 3ZRY16) and OSCP (green) from the fit of the bovine F1/stator subcomplex (PDB ID code 2WSS13). Color of subunits: α, blue; β, dark blue; γδε, light blue; c10-ring, purple; and OSCP, green. (B) As in A but with density of the subtogram average occupied by the atomic models colored blue. The (F1/c10/OSCP) occupies ∼55% of the protein density in the subtomogram average. (C) Difference maps between atomic models filtered to 20 Å and the subtomogram average of the P. tetraurelia ATP synthase dimer. Green, densities present in subtomogram average but not in the filtered atomic model; red, vice versa. (Scale bar, 10 nm.)
Fig. S4.
Pseudosixfold symmetry of the F1 domain. (A and B) Contour plots of cross-sections through the (αβ)3 hexamer of the P. tetraurelia ATP synthase dimer with fitted atomic model (PDB ID code 2WSS13). Cross-sections reveal the long (red asterisks) and short faces of the hexamer, allowing the unambiguous assignment of the noncatalytic (βα) and catalytic (αβ) interfaces to the map. The peripheral stalk runs along a noncatalytic interface; α subunit, light blue; and β subunit, dark blue. (C) Side view of the ATP synthase dimer with position of cross-sections indicated by red dashed lines. (Scale bar, 5 nm.)
Fig. S5.
The P. tetraurelia ATP synthase dimer has a unique curved peripheral stalk. (A) P. tetraurelia ATP synthase dimer with the available atomic models of the bovine ATP synthase (PDB ID codes 2WSS13, 2XND14, and 2CLY11). Side views (B and C) and tilted view (D) of the left monomer in A reveal that the bovine peripheral stalk (red) and the P. tetraurelia peripheral stalk (yellow) exhibit opposite curvatures. (C and D) The bovine peripheral stalk was filtered to 20 Å for better comparison. (Scale bar, 50 nm.)
The fit of the F1c10 subcomplex to the subtomogram average positions the c10-ring in the conspicuous cylindrical density in the membrane (Fig. S2B), indicating that the rotor ring is in direct contact with the intracrista region (green arrowhead, Fig. 2). Because the intracrista region links the c-ring of one monomer to the peripheral stalk of the other, the F1 sectors are offset by 30° to the long axis of the intracrista region (Fig. 2 B–D).
U-Shaped ATP Synthase Dimers Form Helical Arrays.
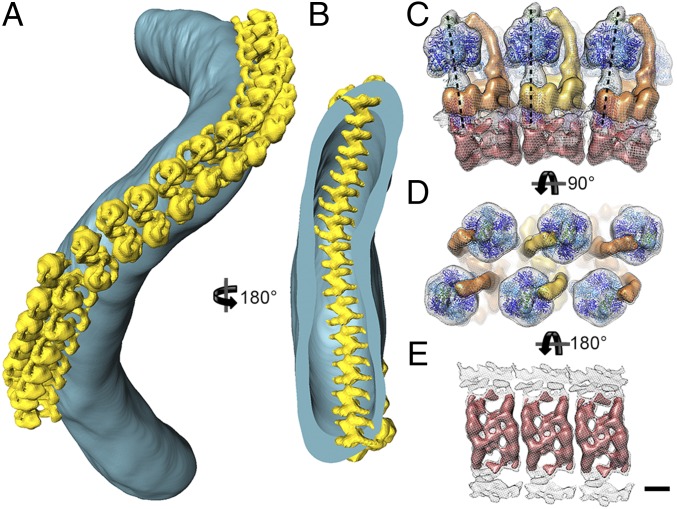
To determine the in situ arrangement of ATP synthase dimers in the membrane, the subtomogram average was positioned into the original tomograms using the orientations determined during particle alignment (Fig. 3 A and B and Movie S3). ATP synthase dimers form a long right-handed helix around the outer perimeter of isolated tubular membranes. Particle orientations and distances in the helical array vary only slightly. The center-to-center distance between dimers in the row measured 14 ± 1 nm (mean ± SD; Fig. S6A). In the helical array, the F1 subcomplexes are arranged in a zigzag pattern (Fig. 3A), whereas on the luminal side, the intracrista regions form a ribbed array (Fig. 3B).
Fig. 3.
Macromolecular organization of ATP synthase dimers in P. tetraurelia cristae. (A) Surface representation of an isolated crista tube (blue) showing the in situ organization of ATP synthase dimers (yellow). The ATP synthase dimers form helical arrays around the outer perimeter of the coiled tubular crista. (B) Rotated clipped view of A showing the ribbed arrangement of ATP synthase dimers on the luminal membrane surface. The location of the ATP synthase dimers was determined by positioning the subtomogram average into the tomographic volume using the positions and orientations determined during alignment. (C) Side view, (D) matrix view, and (E) luminal view of three ATP synthase dimers in the helical array. The F1 subcomplexes form a zigzag pattern (D), whereas the intracrista regions give the luminal view a ribbed appearance (E). Neighboring dimers are rotated by 8° in the direction of the row (black dashed lines, C). C–E were generated by fitting the central dimer density into the neighboring dimer densities present in the subtomogram average (see Fig. S6). (Scale bar, 5 nm.) See Movie S3.
Fig. S6.
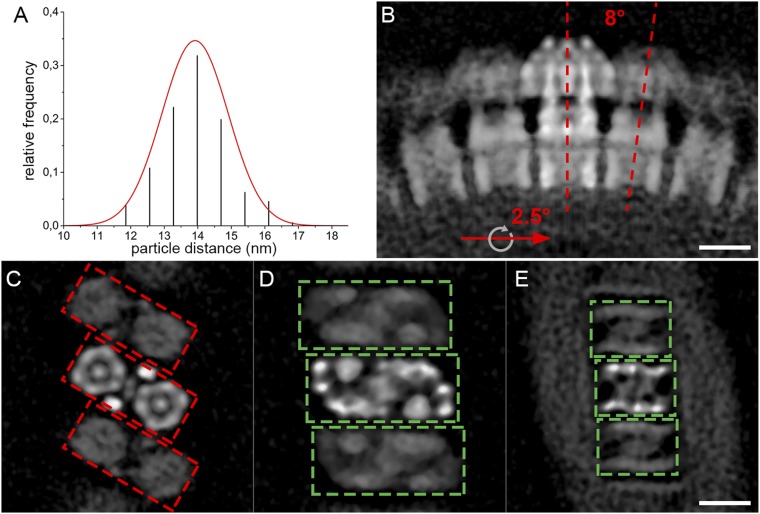
Macromolecular organization of the mitochondrial ATP synthase in P. tetraurelia. (A) Center-to-center distances between neighboring ATP synthase dimers (n = 176) in mitochondrial membranes. The mean distance, fitted with a Gaussian distribution, is 14 ± 1 nm (SD). (B) Side view and (C–E) cross-sections through the subtomogram average showing the average position of neighboring dimers. Neighboring dimers are related by a 2.5° rotation around the axis of the row and an 8° rotation around a perpendicular axis (red lines, B). (C) F1 heads, (D) central stalk and basal end of peripheral stalk, and (E) intracrista domain. The 30° offset in the positioning of the F1 subcomplexes (red boxes, C) relative to the intracrista region (green boxes, D and E) in the U-shaped dimer results in a zigzag arrangement of the catalytic domain, whereas the intracrista region forms a ribbed array. The weaker density of the peripheral dimers relative to the central dimer reflects the positional variability of ATP synthase dimers within the helical arrays. (Scale bars, 10 nm.)
The arrangement of monomers in the helical array becomes apparent in the subtomogram average when the box size is extended to include neighboring dimers (Fig. S6 B–E). The spatial arrangement of neighboring particles within the array was estimated by fitting the central dimer average into the density of the nearest neighboring dimers in the subtomogram average (Fig. 3 C–E). On the matrix side of the dimer row, the peripheral stalks separate the F1 heads of neighboring dimers, placing them farther apart than the intracrista region (Fig. 3 C and D). Thus, the F1 subcomplex and peripheral stalk together are wider than the intracrista region, resulting in a wedge-shaped dimer (Fig. 3C and Fig. S6B).
Calculating the transformation matrix between neighboring dimers in the subtomogram average, we found that the U-shaped dimers are related by an average 8° rotation around the axis connecting the two F1 subcomplexes of a dimer and a 2.5° clockwise rotation around the axis of the dimer row, resulting in a right-handed helical array (Fig. 3 C–E and Figs. S6B and S7A). Propagation of the U-shaped dimer according to this transformation matrix generates an idealized crista with a helix twist of 9°, a pitch of 220 nm, and a helix diameter of 120 nm. Each helix turn has ∼40 ATP synthase dimers. Shape and dimensions of the resulting idealized crista tube are similar to those of isolated P. tetraurelia cristae (Fig. S7 A and B), suggesting that the macromolecular association of ATP synthase dimers into rows does indeed shape the tubular vesicles.
Fig. S7.
Crista morphology. (A) Model of a P. tetraurelia crista generated using the transformation matrix that relates neighboring ATP synthase dimers in the subtomogram average. Dimers (yellow) are positioned 14 nm apart and rotated by 2.5° around the circumference of the crista and 8° in the direction of the row. The resulting crista (blue) forms a right-handed helix with a pitch of 220 nm and a diameter of 120 nm. The diameter of the crista tube is ∼40 nm. (B) Segmented tomographic volume of an isolated mitochondrial membrane tube (blue) showing the in situ distribution of ATP synthase dimers (yellow) (Fig. 3A). The subtomogram average was repositioned into the membrane using the positional and orientation parameters determined during alignment. (C) Selection of tubular cristae from whole mitochondria. Each crista is connected to the inner boundary membrane at two circular cristae junctions. The morphology of the in situ cristae and the isolated mitochondrial membrane with repositioned ATP synthases match the model well.
Mitochondria of P. tetraurelia Are Packed with Helical Tubular Cristae.
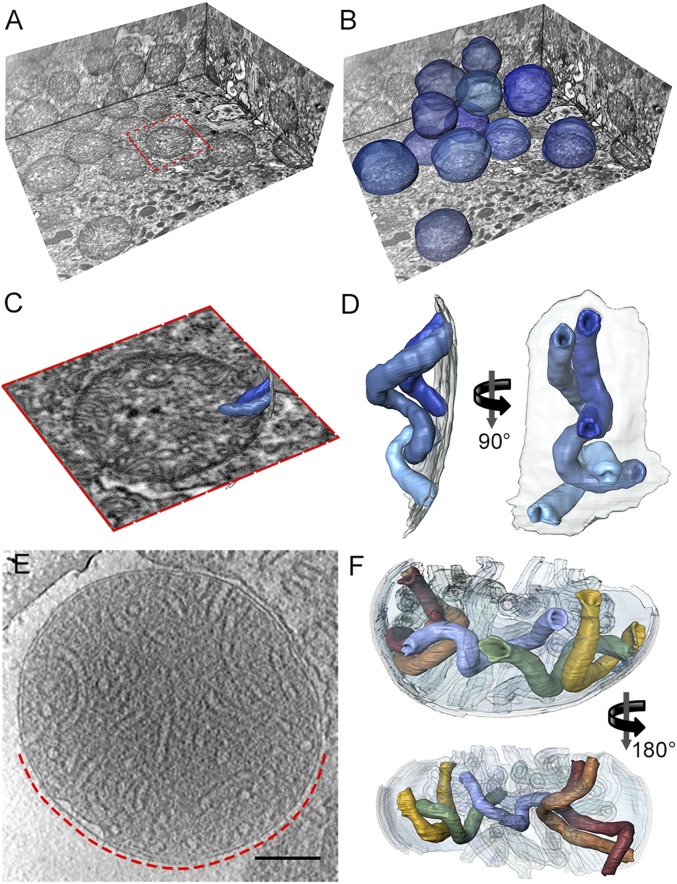
To find out whether the isolated helical vesicles are representative of cristae in whole mitochondria, we performed serial block face imaging of fixed and plastic-embedded whole cells using focused ion beam scanning electron microscopy (FIB-SEM) and electron cryotomography of rapidly frozen isolated mitochondria using a transmission electron microscope (TEM) (Fig. 4). Tomographic FIB-SEM stacks of whole P. tetraurelia cells revealed discrete spherical mitochondria (Fig. 4 A and B) with an average volume of 0.73 ± 0.21 µm3 (mean ± SD, n = 12). The mitochondria were densely packed with helical, tubular cristae of ∼40 nm diameter. Both ends of each crista were connected to the inner boundary membrane by circular crista junctions, which had the same diameter as the tubular cristae (Fig. 4D and Movie S4).
Fig. 4.
In situ morphology of mitochondria and mitochondrial cristae from P. tetraurelia. (A) Orthogonal slices through the tomographic volume of part of a P. tetraurelia cell generated by serial block face imaging with a focused ion-beam scanning electron microscope. (B) As A but with mitochondria segmented (blue). P. tetraurelia mitochondria are visible as discrete spheres. (C) Close-up view of the mitochondrion highlighted in A (red box) with segmented cristae (blue). (D) Surface representation of the cristae segmented in C. Transparent gray, inner membrane. See Movie S4. (E) Slice through an electron cryotomogram of an isolated plunge-frozen P. tetraurelia mitochondrion. (F) Surface representation of cristae in the region of the mitochondrion indicated by the dashed red line in E. Cristae of P. tetraurelia mitochondria are right-handed helical tubes of 40 nm diameter. The tubes are connected to the inner boundary membrane at both ends by circular cristae junctions. See Movie S5. The crista morphology in whole cells and in isolated mitochondria is indistinguishable. (E scale bar, 200 nm.) (C) Length of red box is ∼1.4 µm.
Electron cryotomograms of plunge-frozen isolated mitochondria likewise revealed densely packed tubular cristae (Fig. 4 E and F and Movie S5). As in the tomographic stacks, the helical twist of the tubular cristae was right-handed and the cristae were connected to the inner boundary membrane at both ends by circular crista junctions (Fig. 4 E and F). Both the diameter (∼40 nm) and helix pitch of cristae in whole mitochondria were similar to those of the isolated tubular membranes, indicating that the isolation procedure did not disrupt the native morphology of the cristae (Fig. S7 B and C).
U-Shaped ATP Synthase Dimers Form Helical Arrays in Situ.
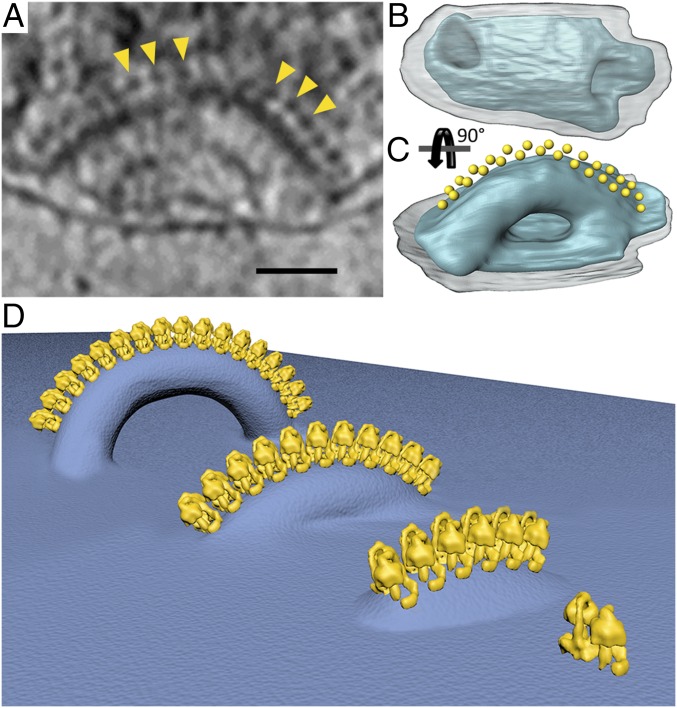
To determine whether the helical arrays of ATP synthase dimers are also present on cristae in whole organelles, we collected electron cryotomograms of mitochondria that had lost some of the matrix proteins but still contained helical tubular cristae as observed in the whole-cell mitochondria. The more translucent matrix enabled us to visualize protein complexes attached to membranes in organello that are usually obscured by the dense matrix. Double rows of 10-nm particles were again found on the tubular helical cristae. The particles were best observed at the periphery of the mitochondria. A short crista, 169 nm in length with crista junctions 140 nm apart, formed an arc that protruded ∼90 nm into matrix (Fig. 5 A–C). The entire outer perimeter of the arc was decorated with a double row of interdigitated 10-nm particles, which formed a right-handed helical array as seen in the isolated cristae (Figs. 3A and 5C). We conclude that the helical arrays of U-shaped ATP synthase dimers are a characteristic feature of cristae in whole P. tetraurelia mitochondria.
Fig. 5.
Formation of cristae. (A) Tomographic slice through a mitochondrion showing a short tubular crista decorated with ATP synthase dimers (yellow arrowheads). (B and C) Segmented surface-rendered representation of the crista shown in A (blue) with ATP synthase monomers represented by yellow spheres. The tubular crista forms a twisted arc with a right-handed helical array of interdigitated ATP synthases along its outer perimeter. Transparent gray, outer membrane. (D) Schematic of crista formation in P. tetraurelia. ATP synthase dimers associate into a helical array that deforms the membrane locally. The deformation becomes more pronounced as the length of the array increases, until the membrane below the row ruptures, forming a twisted tube with a crista junction at each end and a flat inner boundary membrane in between. (A scale bar, 50 nm.)
Discussion
Structure of Mitochondrial ATP Synthases.
We report the in situ structure of the mitochondrial F-type ATP synthase from the cilitate P. tetraurelia. As suggested by Allen et al. (28), the ciliate F-type ATP synthases form interdigitated arrays around the outer edge of helical cristae tubes. These arrays are formed by the linear association of ATP synthase dimers as observed in other species (19–22, 27). However, in contrast to the previously reported in situ structures of mitochondrial ATP synthase dimers from seven other species, which were all V-shaped (19–22, 27), the ATP synthase from P. tetraurelia forms a U-shaped dimer with a promiment intracrista region. This was unexpected, as the F-type ATP synthase is an ancient, highly conserved complex with little structural diversity between the monomeric ATP synthases of bacteria, cyanobacteria, and chloroplasts (5, 31). In contrast, the mitochondrial complex appears to have undergone major structural changes in the course of evolution. These changes are most obvious in the Fo part of the complex, which mediates the formation of the ATP synthase dimers, whereas the F1 subcomplex and rotor-ring assemblies that produce ATP by rotary catalysis are largely conserved. Of the eight mitochondrial ATP synthase dimers studied so far, two do not conform to the yeast or metazoan architecture (19–22): the green algae represented by Polytomella sp. (18, 27) and the cilitate complex in this study. Both species belong to different phylogenetic groups than yeast and metazoa (32) and show remarkable differences in the structure and subunit composition of their Fo subcomplexes, which are evolutionarily unrelated (33–37). Despite these differences, the mitochondrial ATP synthase in all eukaryotes studied so far is dimeric, even though the dimers themselves differ substantially between phyla. Furthermore, all mitochondrial ATP synthase dimers assemble into rows, suggesting that this form of macromolecular organization provides an important evolutionary advantage to eukaryotes.
Functional Significance of ATP Synthase Dimer Rows.
The formation of ATP synthase dimers and dimer rows, which are both specific for mitochondria, have been suggested to enhance the efficiency of ATP synthesis (19, 21). The regions of high membrane curvature caused by the rows of ATP synthase were proposed to act as proton traps that increase the contribution of ΔpH to the proton motive force and hence the rate of ATP synthesis (21). In P. tetraurelia mitochondria, the cristae have a circular cross-section and are connected to the inner boundary membrane at both ends. Thus, in P. tetraurelia, there are no regions of higher membrane curvature that could act as proton traps as in the lamellar cristae. However, in a more recent study that describes the in situ separation of respiratory chain complexes and ATP synthase dimers, it was suggested that protons travel from source to sink along a pH gradient (19). Using ratiometric GFP constructs, it was shown that in actively respiring mitochondria of HeLa cells, the pH on the luminal side of the cytochrome c oxidase (a proton source that pumps protons into the cristae space) is 0.3 units lower than at the ATP synthase dimer (the proton sink) (38). In P. tetraurelia, the formation of helical arrays of ATP synthase dimers would also separate proton sources and sinks and hence result in the formation of a local pH gradient, as reported for HeLa cells.
ATP Synthase and Membrane Deformation.
The V-shaped structure of the ATP synthase dimers has been proposed to impose curvature on the lipid bilayer, which drives the subsequent self-association of dimers into rows along the edges of lamellar cristae (20, 39–41). In the structure of V-shaped dimers, as determined by subtomogram averaging, the species-specific angle between the membrane subcomplexes is always within a range of 56° and 120°. In these species, the dimer angle induces a sharp curvature in the membrane at the dimer interface that is sufficient to drive row formation (18–22, 27, 41–43). In the U-shaped dimer of P. tetraurelia, the dimer angle is close to 0°, and the ATP synthase monomers are parallel. Thus, row formation and membrane deformation must be due to a different mechanism, which does not depend on V-shaped dimers.
In the P. tetraurelia ATP synthase dimer, the offset positions of the F1 subcomplexes relative to the intracrista domains render the dimer wedge-shaped, as the matrix-exposed region is wider than the membrane region. Close association of the wedge-shaped dimers into rows causes the ATP synthase dimers to form a helix, where neighboring dimers are rotated 8° in the direction of the row (Fig. S6B). The curvature of the helix closely matches the membrane curvature of the twisted P. tetraurelia tubular cristae (Fig. S7). Thus, in P. tetraurelia, the curvature of the inner membrane tubular cristae is not simply a consequence of dimer formation in the membrane, as with V-shaped ATP synthase dimers (20, 41), but the result of the tight and specific interaction between the U-shaped dimers as they assemble into rows.
Based on these findings, we propose a model for cristae formation in P. tetraurelia (Fig. 5D). This model resembles an earlier model (44) but is modified to account for the two crista junctions located at either end of the tubular cristae. According to our model, the ATP synthase assembles into dimers in the inner boundary membrane. The peripheral stalks of the dimer bend the inner membrane, driving the association of ATP synthase dimers into rows. The wedge-shaped ATP synthase dimers and interdigitating F1 heads result in the formation of a helical array that induces strong local membrane curvature. As the row grows, membrane deformation builds up. At a critical length, the membrane ruptures and reseals, forming a twisted tube with a circular junction at either end.
Conclusion
Electron cryotomography and subtomogram averaging revealed the in situ structure of the mitochondrial F1Fo-ATP synthase from the ciliate P. tetraurelia at 2.6 nm resolution. The ATP synthase forms a twofold symmetrical U-shaped dimer with, so far, unique structural features that include a curved peripheral stalk and a bulky intracrista region, which links the F1 subcomplex of one monomer in the dimer to the peripheral stalk of the other. The parallel arrangement of ATP synthase monomers within the ciliate dimer reveals that there is no membrane curvature at the dimer interface. The overall structure of the U-shaped dimer is wedge-shaped, causing the dimers to form a helix upon assembly into rows. The helix parameters closely match the morphology of the helical tubular cristae, suggesting that the assembly of ATP synthase dimers into rows is the immediate cause of crista formation in P. tetraurelia.
Materials and Methods
Culture and Isolation of Mitochondria.
P. tetraurelia strain d4-2 (ATCC 30759) was obtained from ATCC and cultured in bacterized Sonneborn’s Paramecium medium according to the distributer’s instructions. One liter of culture was harvested by centrifugation (2,500 × g, 4 °C, 15 min), and cell pellets were resuspended in 5 mL of 250 mM sucrose and 20 mM Tris, pH 7.4. Cells were disrupted with a ball-bearing homogenizer (isobiotec) with an 8-µm clearance for preparation of mitochondrial membranes or a 24-µm clearance for preparation of whole mitochondria. Cell lysis was checked by light microscopy during homogenization. In most cases, 20–30 passages were necessary to achieve adequate lysis. The lysate was then centrifuged at 1,500 × g, 4 °C, for 5 min. The supernatant was collected and centrifuged at 8,000 × g, 4 °C, for 15 min. The resulting pellet was resuspended in 100 µL of 250 mM trehalose and 20 mM Tris, pH 7.4.
Electron Cryotomography.
We applied 3 µL of a 1:1 mixture of membrane or mitochondrial suspension and 6 nm colloidal gold conjugated to protein A (Aurion) to a glow-discharged Quantifoil grid (R2/2, 300 Cu mesh), blotted them to remove excess liquid (#4 Whatmann paper), and plunge-froze them in liquid ethane using a home-built guillotine. Tilt series were collected from ±60° with 2° increments with the software Latitude (Gatan) on a Titan Krios (FEI) operating at 300 kV and equipped with a postcolumn energy filter (GIF Quantum, Gatan) operated with a slit width of 20 eV and a K2 direct detector (Gatan). Images were recorded in counting mode at a nominal magnification of 64,000× (specimen pixel size, 2.23 Å) and a defocus of 2.5–4 µm. The total dose of a tilt series was limited to 100 electrons per Å2. Tilt series were aligned using colloidal gold as fiducial markers, and tomographic volumes were reconstructed using the program IMOD (45). Contrast transfer function (CTF) estimation and correction were performed using the program “ctf phase flip” implemented in IMOD (46). The true handedness of the tomographic volumes was determined by evaluating the angle of the tilt axis using samples of known handedness (20). For visualization, tomograms were contrast-enhanced using nonlinear anisotropic diffusion filtering (47) and segmented manually using the software Amira (FEI). Placement of the subtomogram averages into tomograms was performed using the EMPackage plugin (48) for AMIRA (FEI).
Subtomogram Averaging.
Subtomogram averaging of ATP synthase dimers was performed as previously described (20). ATP synthase dimers were identified within tomographic volumes as 10-nm particles on tubular membrane vesicles. Initial particle orientations were assigned according to the position of the F1 heads relative to the membrane. The extracted particles were rotated accordingly and averaged to generate an initial reference. Particle alignment was optimized using the software package PEET (49) using a restricted search range. During the final iteration, subvolumes were duplicated and rotated 180° to make use of the inherent twofold symmetry. Fourier shell correlation (FSC) was used to estimate resolution: Two maps, each created from randomly selected subvolumes after alignment, were multiplied with a Gaussian filtered mask and compared in Fourier space using the program EMAN2 (50). To guard against mask bias, the FSC calculation was repeated with half maps generated from tomograms that were phase-randomized beyond 40 Å (randomizePhaseAbove, PEET). Local resolution estimates were performed with Resmap (51) (Fig. S1C). 3D visualizations and rigid body fitting were carried out using the program UCSF Chimera (52). To assess the angular distribution of the subvolumes contributing to the average, the orientation of their initial z axis relative to the final average was determined (Matlab, Mathworks).
Focused Ion Beam Scanning Electron Microscopy.
Room temperature fixation, staining, and embedding of whole P. tetraurelia cells were performed according to established protocols (53). Preparation of sample blocks for imaging by FIB-SEM were performed as previously described (54) (see SI Materials and Methods for details).
SI Materials and Methods
Room Temperature Fixation and Resin Embedding.
One liter of P. tetraurelia culture was harvested by centrifugation at 2,500 × g, 4 °C, for 15 min. The resulting pellet was resuspended in fixation buffer [2.5% (vol/vol) glutaraldehyde in 0.1 M sodium cacodylate buffer, pH 7.2] and incubated for 2 h at room temperature. Samples were postfixed in 0.1 M sodium cacodylate buffer, pH 7.2, containing 1% (wt/vol) OsO4 for 1 h at room temperature and en bloc stained with 1% (wt/vol) uranyl acetate overnight at 4 °C. Sample dehydration was performed by five successive ethanol steps (30–100%), each for 30 min at room temperature, followed by a solvent exchange to 100% propylene oxide (3× 20 min). For epoxy resin infiltration, samples were incubated with increasing resin concentration [30–100% (vol/vol) epoxy resin in propylene oxide, Low Viscosity Premix Kit Hard, Agar Scientific] for 30 min at room temperature and finally overnight. Samples were then polymerized at 65 °C for 16 h.
Serial Block Face Imaging.
Sample blocks were trimmed into pyramids with a diamond knife, mounted onto specimen holders, and covered with liquid silver adhesive. An additional gold layer of ∼20 nm was deposited in a sputter coater (Agar Scientific), and samples were loaded into a Helios Nanolab 660i dual beam microscope (FEI Company). Surplus block material around the area of interest was removed using a high ion beam current (30 keV, 6.5 nA). To reduce streaking artifacts, a sacrificial platinum layer (300 nm) was deposited on the top surface using the gas injection system. For final surface polishing and milling, a reduced ion current (30 keV, 2.8 nA) was used. For imaging, the Auto Slice and View G3 software (FEI Company) was used with an electron beam current of 1.4 nA to acquire an image stack of 275 images (pixel size: x = 3.3794 nm, y = 4.288 nm, and z = 10 nm). Raw images were aligned in IMOD (45) and segmented manually in Amira (FEI Company).
Supplementary Material
Acknowledgments
We thank Deryck Mills for maintenance of electron microscopes and Özkan Yildiz and Juan Francisco Castillo Hernandez for computer support. The work was supported by the Max Planck Society, the Cluster of Excellence Frankfurt “Macromolecular Complexes” funded by the Deutsche Forschungsgemeinschaft (K.M.D. and W.K.), and C.W. was supported by a European research council starting grant (to A.S.F.).
Footnotes
The authors declare no conflict of interest.
This article is a PNAS Direct Submission.
Data deposition: The data reported in this paper have been deposited in EMdatabank (accession no. 3441).
This article contains supporting information online at www.pnas.org/lookup/suppl/doi:10.1073/pnas.1525430113/-/DCSupplemental.
References
- 1.Boyer PD. The binding change mechanism for ATP synthase--Some probabilities and possibilities. Biochim Biophys Acta. 1993;1140(3):215–250. doi: 10.1016/0005-2728(93)90063-l. [DOI] [PubMed] [Google Scholar]
- 2.Noji H, Yasuda R, Yoshida M, Kinosita K., Jr Direct observation of the rotation of F1-ATPase. Nature. 1997;386(6622):299–302. doi: 10.1038/386299a0. [DOI] [PubMed] [Google Scholar]
- 3.Collinson IR, et al. ATP synthase from bovine heart mitochondria. In vitro assembly of a stalk complex in the presence of F1-ATPase and in its absence. J Mol Biol. 1994;242(4):408–421. doi: 10.1006/jmbi.1994.1591. [DOI] [PubMed] [Google Scholar]
- 4.Abrahams JP, Leslie AG, Lutter R, Walker JE. Structure at 2.8 A resolution of F1-ATPase from bovine heart mitochondria. Nature. 1994;370(6491):621–628. doi: 10.1038/370621a0. [DOI] [PubMed] [Google Scholar]
- 5.Meier T, Faraldo-Gomez J, Börsch M. ATP Synthase—A paradigmatic molecular machine. In: Frank J, editor. Molecular Machines in Biology. 1st Ed. Cambridge Univ Press; Cambridge, UK: 2011. pp. 208–238. [Google Scholar]
- 6.Sambongi Y, et al. Mechanical rotation of the c subunit oligomer in ATP synthase (F0F1): Direct observation. Science. 1999;286(5445):1722–1724. doi: 10.1126/science.286.5445.1722. [DOI] [PubMed] [Google Scholar]
- 7.Pänke O, Gumbiowski K, Junge W, Engelbrecht S. F-ATPase: Specific observation of the rotating c subunit oligomer of EF(o)EF(1) FEBS Lett. 2000;472(1):34–38. doi: 10.1016/s0014-5793(00)01436-8. [DOI] [PubMed] [Google Scholar]
- 8.Tanabe M, et al. Rotation of a complex of the gamma subunit and c ring of Escherichia coli ATP synthase. The rotor and stator are interchangeable. J Biol Chem. 2001;276(18):15269–15274. doi: 10.1074/jbc.M100289200. [DOI] [PubMed] [Google Scholar]
- 9.Tsunoda SP, Aggeler R, Yoshida M, Capaldi RA. Rotation of the c subunit oligomer in fully functional F1Fo ATP synthase. Proc Natl Acad Sci USA. 2001;98(3):898–902. doi: 10.1073/pnas.031564198. [DOI] [PMC free article] [PubMed] [Google Scholar]
- 10.Rubinstein JL, Walker JE, Henderson R. Structure of the mitochondrial ATP synthase by electron cryomicroscopy. EMBO J. 2003;22(23):6182–6192. doi: 10.1093/emboj/cdg608. [DOI] [PMC free article] [PubMed] [Google Scholar]
- 11.Dickson VK, Silvester JA, Fearnley IM, Leslie AG, Walker JE. On the structure of the stator of the mitochondrial ATP synthase. EMBO J. 2006;25(12):2911–2918. doi: 10.1038/sj.emboj.7601177. [DOI] [PMC free article] [PubMed] [Google Scholar]
- 12.Stock D, Leslie AG, Walker JE. Molecular architecture of the rotary motor in ATP synthase. Science. 1999;286(5445):1700–1705. doi: 10.1126/science.286.5445.1700. [DOI] [PubMed] [Google Scholar]
- 13.Rees DM, Leslie AG, Walker JE. The structure of the membrane extrinsic region of bovine ATP synthase. Proc Natl Acad Sci USA. 2009;106(51):21597–21601. doi: 10.1073/pnas.0910365106. [DOI] [PMC free article] [PubMed] [Google Scholar]
- 14.Watt IN, Montgomery MG, Runswick MJ, Leslie AG, Walker JE. Bioenergetic cost of making an adenosine triphosphate molecule in animal mitochondria. Proc Natl Acad Sci USA. 2010;107(39):16823–16827. doi: 10.1073/pnas.1011099107. [DOI] [PMC free article] [PubMed] [Google Scholar]
- 15.Dautant A, Velours J, Giraud MF. Crystal structure of the Mg·ADP-inhibited state of the yeast F1c10-ATP synthase. J Biol Chem. 2010;285(38):29502–29510. doi: 10.1074/jbc.M110.124529. [DOI] [PMC free article] [PubMed] [Google Scholar]
- 16.Giraud MF, et al. Rotor architecture in the yeast and bovine F1-c-ring complexes of F-ATP synthase. J Struct Biol. 2012;177(2):490–497. doi: 10.1016/j.jsb.2011.10.015. [DOI] [PubMed] [Google Scholar]
- 17.Baker LA, Watt IN, Runswick MJ, Walker JE, Rubinstein JL. Arrangement of subunits in intact mammalian mitochondrial ATP synthase determined by cryo-EM. Proc Natl Acad Sci USA. 2012;109(29):11675–11680. doi: 10.1073/pnas.1204935109. [DOI] [PMC free article] [PubMed] [Google Scholar]
- 18.Allegretti M, et al. Horizontal membrane-intrinsic α-helices in the stator a-subunit of an F-type ATP synthase. Nature. 2015;521(7551):237–240. doi: 10.1038/nature14185. [DOI] [PubMed] [Google Scholar]
- 19.Davies KM, et al. Macromolecular organization of ATP synthase and complex I in whole mitochondria. Proc Natl Acad Sci USA. 2011;108(34):14121–14126. doi: 10.1073/pnas.1103621108. [DOI] [PMC free article] [PubMed] [Google Scholar]
- 20.Davies KM, Anselmi C, Wittig I, Faraldo-Gómez JD, Kühlbrandt W. Structure of the yeast F1Fo-ATP synthase dimer and its role in shaping the mitochondrial cristae. Proc Natl Acad Sci USA. 2012;109(34):13602–13607. doi: 10.1073/pnas.1204593109. [DOI] [PMC free article] [PubMed] [Google Scholar]
- 21.Strauss M, Hofhaus G, Schröder RR, Kühlbrandt W. Dimer ribbons of ATP synthase shape the inner mitochondrial membrane. EMBO J. 2008;27(7):1154–1160. doi: 10.1038/emboj.2008.35. [DOI] [PMC free article] [PubMed] [Google Scholar]
- 22.Daum B, Walter A, Horst A, Osiewacz HD, Kühlbrandt W. Age-dependent dissociation of ATP synthase dimers and loss of inner-membrane cristae in mitochondria. Proc Natl Acad Sci USA. 2013;110(38):15301–15306. doi: 10.1073/pnas.1305462110. [DOI] [PMC free article] [PubMed] [Google Scholar]
- 23.Arnold I, Pfeiffer K, Neupert W, Stuart RA, Schägger H. Yeast mitochondrial F1F0-ATP synthase exists as a dimer: Identification of three dimer-specific subunits. EMBO J. 1998;17(24):7170–7178. doi: 10.1093/emboj/17.24.7170. [DOI] [PMC free article] [PubMed] [Google Scholar]
- 24.Brunner S, Everard-Gigot V, Stuart RA. Su e of the yeast F1Fo-ATP synthase forms homodimers. J Biol Chem. 2002;277(50):48484–48489. doi: 10.1074/jbc.M209382200. [DOI] [PubMed] [Google Scholar]
- 25.Soubannier V, et al. In the absence of the first membrane-spanning segment of subunit 4(b), the yeast ATP synthase is functional but does not dimerize or oligomerize. J Biol Chem. 2002;277(12):10739–10745. doi: 10.1074/jbc.M111882200. [DOI] [PubMed] [Google Scholar]
- 26.Paumard P, et al. The ATP synthase is involved in generating mitochondrial cristae morphology. EMBO J. 2002;21(3):221–230. doi: 10.1093/emboj/21.3.221. [DOI] [PMC free article] [PubMed] [Google Scholar]
- 27.Dudkina NV, Oostergetel GT, Lewejohann D, Braun HP, Boekema EJ. Row-like organization of ATP synthase in intact mitochondria determined by cryo-electron tomography. Biochim Biophys Acta. 2010;1797(2):272–277. doi: 10.1016/j.bbabio.2009.11.004. [DOI] [PubMed] [Google Scholar]
- 28.Allen RD, Schroeder CC, Fok AK. An investigation of mitochondrial inner membranes by rapid-freeze deep-etch techniques. J Cell Biol. 1989;108(6):2233–2240. doi: 10.1083/jcb.108.6.2233. [DOI] [PMC free article] [PubMed] [Google Scholar]
- 29.Kühlbrandt W. Discrimination of protein and nucleic acids by electron microscopy using contrast variation. Ultramicroscopy. 1982;7(3):221–232. doi: 10.1016/0304-3991(82)90169-3. [DOI] [PubMed] [Google Scholar]
- 30.Jiko C, et al. Bovine F1Fo ATP synthase monomers bend the lipid bilayer in 2D membrane crystals. eLife. 2015;4:e06119. doi: 10.7554/eLife.06119. [DOI] [PMC free article] [PubMed] [Google Scholar]
- 31.Walker JE, Cozens AL. Evolution of Atp synthase. Chem Scr. 1986;26(B):263–272. [Google Scholar]
- 32.Gray MW, Lang BF, Burger G. Mitochondria of protists. Annu Rev Genet. 2004;38:477–524. doi: 10.1146/annurev.genet.37.110801.142526. [DOI] [PubMed] [Google Scholar]
- 33.Balabaskaran Nina P, et al. Highly divergent mitochondrial ATP synthase complexes in Tetrahymena thermophila. PLoS Biol. 2010;8(7):e1000418. doi: 10.1371/journal.pbio.1000418. [DOI] [PMC free article] [PubMed] [Google Scholar]
- 34.Chaban Y, Boekema EJ, Dudkina NV. Structures of mitochondrial oxidative phosphorylation supercomplexes and mechanisms for their stabilisation. Biochim Biophys Acta. 2014;1837(4):418–426. doi: 10.1016/j.bbabio.2013.10.004. [DOI] [PubMed] [Google Scholar]
- 35.Wittig I, Schägger H. Structural organization of mitochondrial ATP synthase. Biochim Biophys Acta. 2008;1777(7-8):592–598. doi: 10.1016/j.bbabio.2008.04.027. [DOI] [PubMed] [Google Scholar]
- 36.Vázquez-Acevedo M, et al. The mitochondrial ATP synthase of chlorophycean algae contains eight subunits of unknown origin involved in the formation of an atypical stator-stalk and in the dimerization of the complex. J Bioenerg Biomembr. 2006;38(5-6):271–282. doi: 10.1007/s10863-006-9046-x. [DOI] [PubMed] [Google Scholar]
- 37.Lapaille M, et al. Atypical subunit composition of the chlorophycean mitochondrial F1FO-ATP synthase and role of Asa7 protein in stability and oligomycin resistance of the enzyme. Mol Biol Evol. 2010;27(7):1630–1644. doi: 10.1093/molbev/msq049. [DOI] [PubMed] [Google Scholar]
- 38.Rieger B, Junge W, Busch KB. Lateral pH gradient between OXPHOS complex IV and F(0)F(1) ATP-synthase in folded mitochondrial membranes. Nat Commun. 2014;5:3103. doi: 10.1038/ncomms4103. [DOI] [PubMed] [Google Scholar]
- 39.Minauro-Sanmiguel F, Wilkens S, García JJ. Structure of dimeric mitochondrial ATP synthase: Novel F0 bridging features and the structural basis of mitochondrial cristae biogenesis. Proc Natl Acad Sci USA. 2005;102(35):12356–12358. doi: 10.1073/pnas.0503893102. [DOI] [PMC free article] [PubMed] [Google Scholar]
- 40.Gavin PD, Prescott M, Luff SE, Devenish RJ. Cross-linking ATP synthase complexes in vivo eliminates mitochondrial cristae. J Cell Sci. 2004;117(Pt 11):2333–2343. doi: 10.1242/jcs.01074. [DOI] [PubMed] [Google Scholar]
- 41.Dudkina NV, Heinemeyer J, Keegstra W, Boekema EJ, Braun HP. Structure of dimeric ATP synthase from mitochondria: An angular association of monomers induces the strong curvature of the inner membrane. FEBS Lett. 2005;579(25):5769–5772. doi: 10.1016/j.febslet.2005.09.065. [DOI] [PubMed] [Google Scholar]
- 42.Dudkina NV, Sunderhaus S, Braun HP, Boekema EJ. Characterization of dimeric ATP synthase and cristae membrane ultrastructure from Saccharomyces and Polytomella mitochondria. FEBS Lett. 2006;580(14):3427–3432. doi: 10.1016/j.febslet.2006.04.097. [DOI] [PubMed] [Google Scholar]
- 43.Thomas D, et al. Supramolecular organization of the yeast F1Fo-ATP synthase. Biol Cell. 2008;100(10):591–601. doi: 10.1042/BC20080022. [DOI] [PubMed] [Google Scholar]
- 44.Allen RD. Membrane tubulation and proton pumps. Protoplasma. 1995;189(1-2):1–8. [Google Scholar]
- 45.Kremer JR, Mastronarde DN, McIntosh JR. Computer visualization of three-dimensional image data using IMOD. J Struct Biol. 1996;116(1):71–76. doi: 10.1006/jsbi.1996.0013. [DOI] [PubMed] [Google Scholar]
- 46.Xiong Q, Morphew MK, Schwartz CL, Hoenger AH, Mastronarde DN. CTF determination and correction for low dose tomographic tilt series. J Struct Biol. 2009;168(3):378–387. doi: 10.1016/j.jsb.2009.08.016. [DOI] [PMC free article] [PubMed] [Google Scholar]
- 47.Frangakis AS, Hegerl R. Noise reduction in electron tomographic reconstructions using nonlinear anisotropic diffusion. J Struct Biol. 2001;135(3):239–250. doi: 10.1006/jsbi.2001.4406. [DOI] [PubMed] [Google Scholar]
- 48.Pruggnaller S, Mayr M, Frangakis AS. A visualization and segmentation toolbox for electron microscopy. J Struct Biol. 2008;164(1):161–165. doi: 10.1016/j.jsb.2008.05.003. [DOI] [PubMed] [Google Scholar]
- 49.Nicastro D, et al. The molecular architecture of axonemes revealed by cryoelectron tomography. Science. 2006;313(5789):944–948. doi: 10.1126/science.1128618. [DOI] [PubMed] [Google Scholar]
- 50.Tang G, et al. EMAN2: An extensible image processing suite for electron microscopy. J Struct Biol. 2007;157(1):38–46. doi: 10.1016/j.jsb.2006.05.009. [DOI] [PubMed] [Google Scholar]
- 51.Kucukelbir A, Sigworth FJ, Tagare HD. Quantifying the local resolution of cryo-EM density maps. Nat Methods. 2014;11(1):63–65. doi: 10.1038/nmeth.2727. [DOI] [PMC free article] [PubMed] [Google Scholar]
- 52.Pettersen EF, et al. UCSF Chimera--A visualization system for exploratory research and analysis. J Comput Chem. 2004;25(13):1605–1612. doi: 10.1002/jcc.20084. [DOI] [PubMed] [Google Scholar]
- 53.Jendrach M, et al. Morpho-dynamic changes of mitochondria during ageing of human endothelial cells. Mech Ageing Dev. 2005;126(6-7):813–821. doi: 10.1016/j.mad.2005.03.002. [DOI] [PubMed] [Google Scholar]
- 54.Perkovic M, et al. Correlative light- and electron microscopy with chemical tags. J Struct Biol. 2014;186(2):205–213. doi: 10.1016/j.jsb.2014.03.018. [DOI] [PMC free article] [PubMed] [Google Scholar]
Associated Data
This section collects any data citations, data availability statements, or supplementary materials included in this article.


