Abstract
Purpose
To investigate the relationship between retinal perfusion and retinal thickness in the peripapillary and macular areas of healthy subjects.
Methods
Using spectral-domain optic coherence tomography and split-spectrum amplitude decorrelation angiography (SSADA) algorithm, retinal perfusion and retinal thicknesses in the macular and peripapillary areas were measured in healthy volunteers, and correlations among these variables were analyzed.
Results
Overall, 64 subjects (121 eyes) including 28 males and 36 females with a mean ± SD age of 38 ± 13 years participated. Linear mixed-models showed that vessel area density was significantly correlated with the inner retinal thickness (from the inner limiting membrane to the outer border of the inner nucleus layer; P < 0.05), but not with the thickness of the full retina (P > 0.05) in the parafoveal area. The area of the foveal capillary-free zone was negatively correlated with the inner and full foveal thicknesses (all P < 0.001). In the peripapillary area, the vessel area density was positively correlated with the thickness of the retinal nerve fiber layer (P < 0.001).
Conclusions
In healthy subjects, retinal perfusion in small vessels was closely correlated with the thickness of the inner retinal layers in both the macular and peripapillary areas.
Keywords: optical coherence tomography (OCT) angiogram, split-spectrum amplitude decorrelation angiography (SSADA) algorithm, macular perfusion, capillary-free zone (CFZ), retinal thickness
The retina, which is essential for visual function, was reported to have the greatest energy demand per gram of tissue of all tissues in the human body.1 Many studies had revealed that ocular or disc perfusion is reduced in many ocular disorders, and the extent of the reduction is correlated to the severity of entities or damage to the neural structure.2–6 This correlation between perfusion and neural structure was also found in physiological conditions.7,8 Using fundus photography, Zheng et al.7 reported that narrower retinal vessels were associated with reduced retinal nerve fiber layer (RNFL) thickness in an Asian population. Cheung et al.8 also found that a smaller optic disc, thinner macula, and thinner RNFL were associated with narrower retinal vessels in children. However, partly due to technical limitations, these studies focused on large vessels surrounding the optic disc.4,7,8 The remainder of the retina is highly capillarized,9 and in many retinal vascular diseases, pathologic changes affected the small vessels and capillaries first.10–12 In addition, the macula, which is crucial for fine and color vision, has unique neural and vascular structures compared with other parts of the retina.13
Optical coherence tomography (OCT) has been available to ophthalmologists for many years.14 It provides detailed structural information of the retina and has greatly improved our understanding of many ocular diseases, especially macular diseases.15–17 The recent introduction of OCT angiography using the split-spectrum amplitude decorrelation angiography (SSADA) algorithm has allowed ophthalmologists to create a fine map of the ocular circulation at the capillary level with a good repeatability and reproducibility.18–21
Based on this background, the objective of our study was to investigate the relationship between retinal structure and retinal blood flow, focusing on the small vessels and capillaries in the macular and peripapillary areas.
Methods
Subjects
Healthy volunteers were enrolled between January and April 2015. All of the subjects underwent a comprehensive ophthalmologic examination, which included best-corrected visual acuity (BCVA); slit-lamp biomicroscopy; refraction measurement using auto refraction, calculation of the spherical equivalence (SE) based on the spherical diopter (D) plus one-half of the cylindrical dioptric power; dilated fundus examination; and measurement of IOP using a noncontact tonometer. The subjects' heart rate and blood pressure were also recorded at the time of OCT imaging. The mean arterial pressure (MAP) was calculated as the diastolic blood pressure plus one-third of the difference between the diastolic blood pressure and the systolic blood pressure. The ocular perfusion pressure (OPP) was determined by subtracting the IOP from the two-thirds MAP. The medical and family histories of the subjects were also collected.
Subjects were included in the study if their BCVA was 16/20 or better and SE was between +1 and −3 D. Subjects with any of the following were excluded: history of ocular surgery or trauma; BCVA less than 16/20; IOP greater than 21 mm Hg; family history of glaucoma in a first-degree relative; signs of myopic degeneration or a pathologic form of myopia; other ophthalmic diseases; or the presence of any systemic disease that might affect blood flow, such as diabetes mellitus, hypertension, and migraine.
The study was approved by the institutional review board of the Eye and ENT Hospital of Fudan University (Shanghai, China), and conformed to the tenets of the Declaration of Helsinki. All of the subjects signed informed consent forms.
OCT Acquisition and Processing
Optical coherence tomography angiography scans were obtained using a spectral-domain (SD) system (RTVue-XR Avanti; Optovue, Fremont, CA, USA). This system has an A-scan rate of 70 kHz with a light source centered at a wavelength of 840 nm and a bandwidth of 45 nm. Both eyes were assessed in each subject. Optic disc (4.5 × 4.5 mm) and macular (6 × 6 mm) OCT angiography scans were acquired by two repeated B-scans at 304 raster positions, and each B-scan consisted of 304 A-scans. Two volumetric raster scans were taken consecutively, with one in the horizontal priority (x-fast) and one in the vertical priority (y-fast). Motion artifacts were removed by three-dimensional (3D) orthogonal registration and by merging the pair of scans. En face retinal angiograms were created by projecting the flow signal internal to the retinal pigment epithelium. All of these procedures were achieved using the RTVue-XR Avanti software.
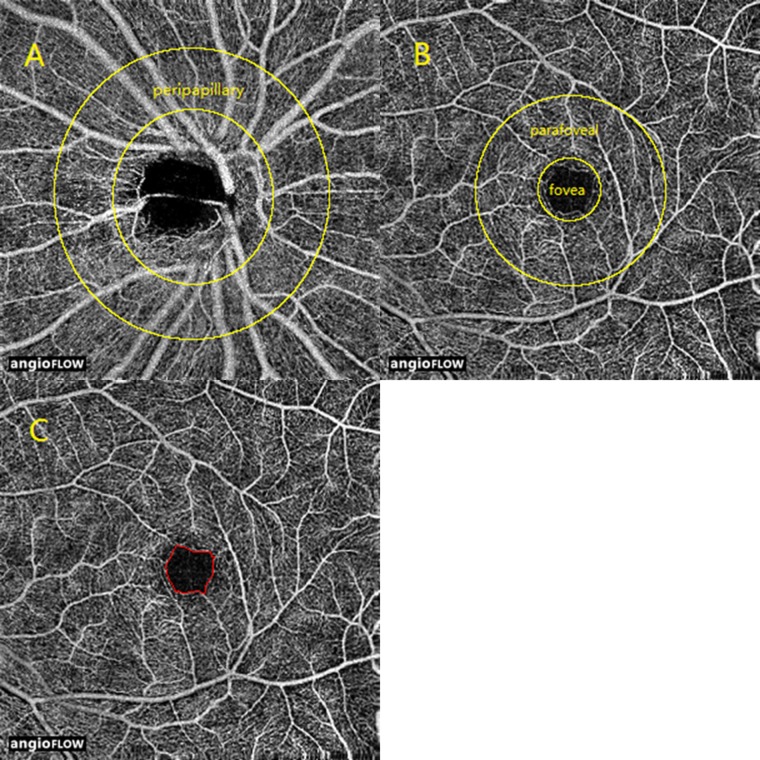
In this study, the vessel area density was measured for two retinal regions: the peripapillary and parafoveal areas (Fig. 1). The peripapillary region was defined as a 700-μm wide elliptical annulus extending outward from the optic disc boundary (Fig. 1A). The parafoveal region was defined as an annulus with an outer diameter of 3 mm and an inner diameter of 1 mm (Fig. 1B) centered at the fovea. The vessel area density was calculated as previously described.18–25 The capillary-free zone (CFZ) was outlined and measured in images taken at a magnification of ×4, as previously described,18 using ImageJ software (http://imagej.nih.gov/ij/; provided in the public domain by the National Institutes of Health, Bethesda, MD, USA; Fig. 1C).
Figure 1.
En face OCT angiograms of (A) the peripapillary region; (B) fovea and parafoveal regions; and (C) CFZ.
The retinal thickness at the macula and RNFL thickness at the peripapillary was also measured in all subjects. The RNFL thickness was obtained along a 3.45-mm diameter circle centered on the optic disc using the same RTVue-XR Avanti system used to measure retinal perfusion. Retinal nerve fiber layer thickness was automatically calculated using the built-in software as the mean thicknesses of the whole circle. The retinal thickness of the macular area was measured using the Spectralis SD-OCT (Heidelberg Engineering, Vista, CA, USA) with a posterior pole volume scan with 97 raster lines. Each line comprised 30 averaged scans, covering an area of 30° × 25°. The foveal region refers to a circular region with a diameter of 1 mm centered on the fovea. The parafoveal region was defined as the same region as in the OCT angiogram. Full retinal thickness was measured from the internal limiting membrane (ILM) to the outer boundary of the retinal pigment epithelium (RPE; Supplementary Fig. S1A). The inner retinal thickness was measured from the ILM to the outer boundary of the inner nuclear layer (INL; Supplementary Fig. S1B). The Spectralis software automatically calculates the full retinal thickness and the thicknesses of each retinal layer (11 different layers). The inner retinal thicknesses of the foveal and parafoveal regions were calculated by summing the RNFL, ganglion cell layer (GCL), inner plexiform layer (IPL), and INL thicknesses.
Statistical Analyses
Statistical analyses were performed using SPSS software version 20.0 (SPSS, Inc., Chicago, IL, USA). Pearson's correlation test and linear mixed-models were used to determine the relationships of IOP, SE, OPP, heart rate, age, and retinal thickness (RNFL and inner/full retinal thicknesses of the fovea/parafovea) with the vessel area density of the relevant regions. Linear mixed-models were used to estimate the changes in vessel area density, and CFZ as dependent variables, for each 1 SD change in retinal thickness as the independent variable. The analyses were adjusted for IOP, SE, OPP, heart rate, and age. For all tests, values of P less than 0.05 were considered statistically significant.
Results
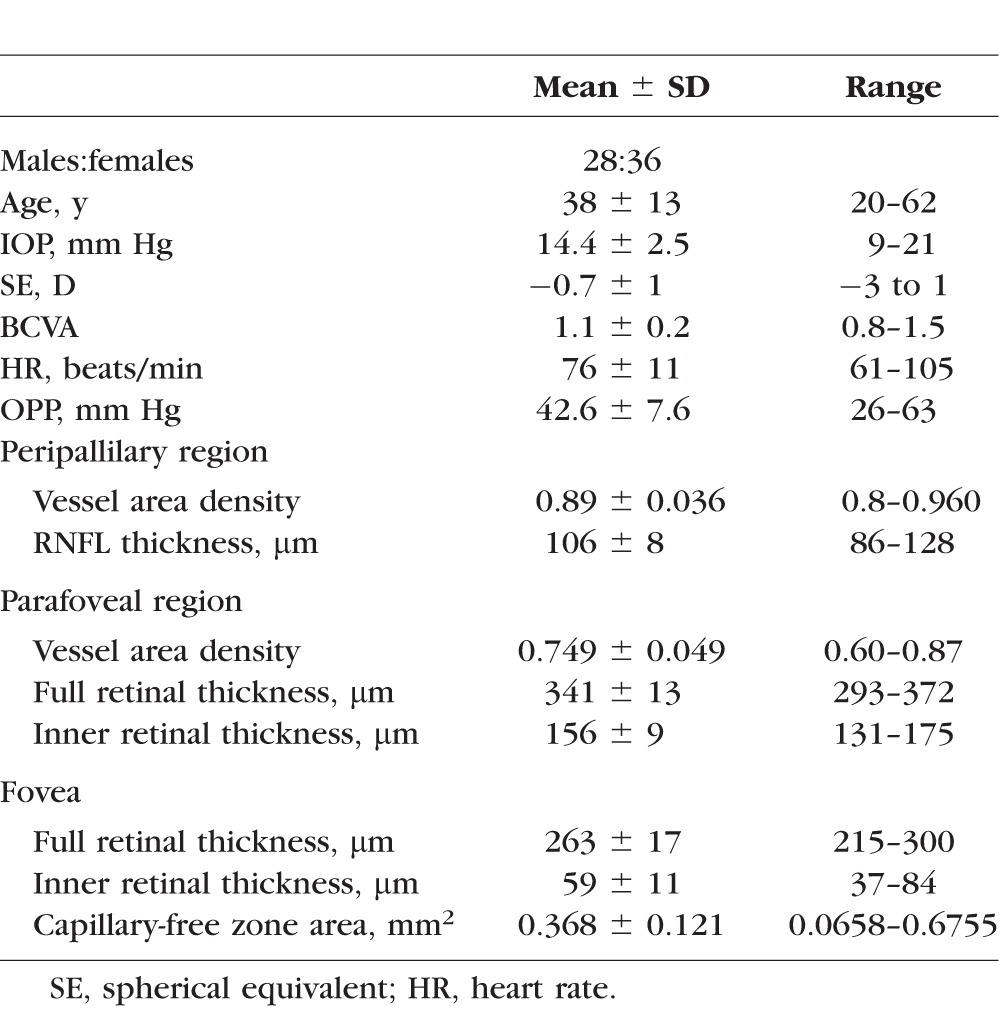
A total of 121 eyes in 64 healthy Chinese subjects were included in this study. The subjects (Table 1) included 28 males (53 eyes) and 36 females (68 eyes). The mean age was 38 ± 13 years (range, 20–62 years). The mean IOP was 14.4 ± 2.5 mm Hg (range, 9–21 mm Hg), and the mean SE was −0.7 ± 1 D (range, −3 to 1 D). The retinal perfusion and retinal thickness were successfully measured by OCT in all subjects. The vessel area density of the parafoveal and peripapillary regions are listed in Table 1.
Table 1.
Clinical Characteristics of the Study Population and Optic Coherence Tomography Measurements of Retinal Thickness/Perfusion
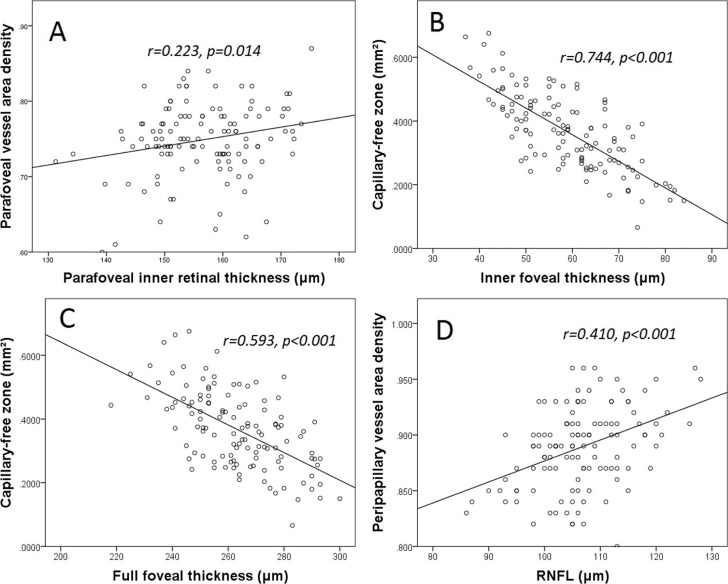
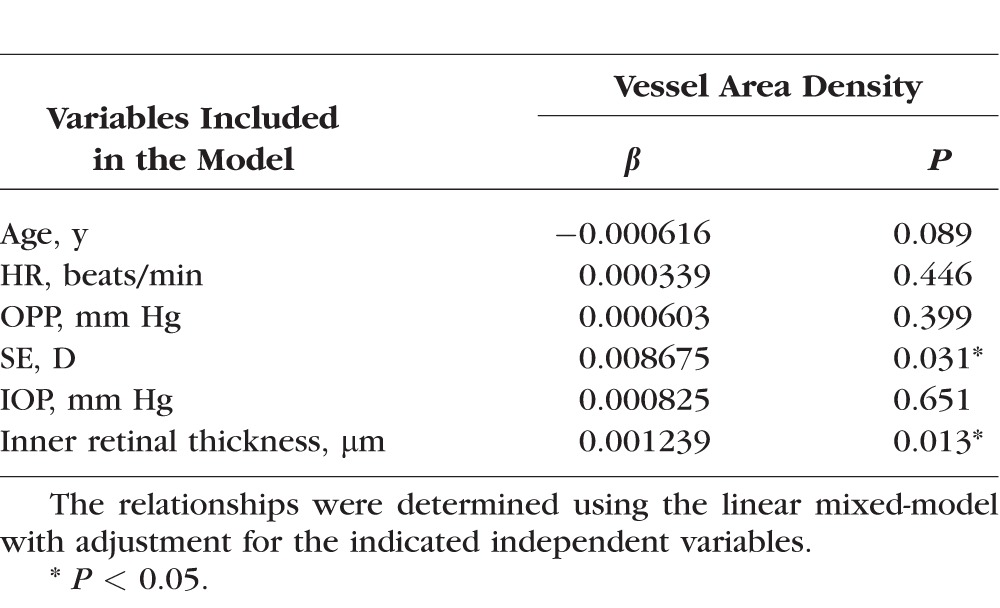
In the parafoveal region, vessel area density was significantly and positively correlated with the inner retinal thickness (P < 0.05, Fig. 2A). This correlation remained statistically significant after adjusting for other factors, including age, SE, HR, OPP, and IOP in the linear mixed-models (P < 0.05; Table 2), and the vessel area density was weakly correlated with SE (P = 0.031, Table 2). By contrast, the vessel area density was not significantly correlated with the thickness of the full retina in the parafoveal region (P > 0.05, Supplementary Table S1). The linear mixed-models revealed that each 1 × SD decrease in the inner retinal thickness was associated with a 1.3% decrease in vessel area density in the parafoveal region.
Figure 2.
Correlations between retinal perfusion and retinal thickness in the macular and peripapillary areas. (A) The vessel area density was positivity correlated with inner retinal thickness in the parafoveal region. (B, C) The CFZ area was negatively correlated with the inner retinal thickness and the full retinal thickness in the fovea. (D) The peripapillary vessel area density was positivity correlated with the RNFL thickness.
Table 2.
Relationship Between Retinal Perfusion and the Inner Retinal Thickness in the Parafoveal Region
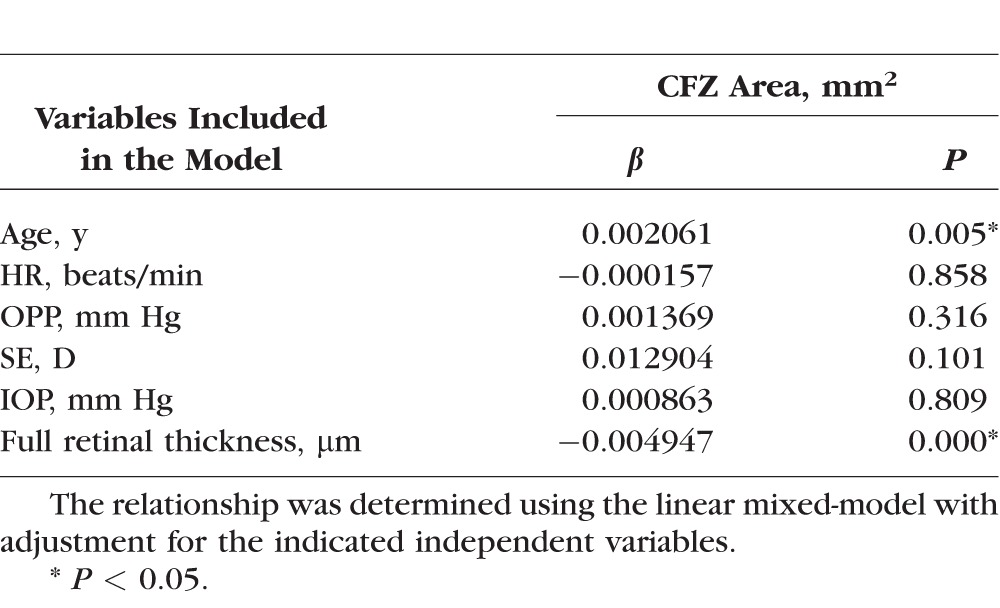
The CFZ area was negatively correlated with the inner thickness and the full thickness of the fovea (both P < 0.001, Figs. 2B, 2C), and these correlations remained significant in the linear mixed-models (both P < 0.001, Tables 3 and 4). The CFZ area was positively correlated with age (P < 0.05, Table 4), but not with the other variables (Tables 3 and 4). Each 1 × SD decrease in the inner thickness and full thickness of the retina was associated with an increase in the CFZ area of 146% and 128%, respectively.
Table 3.
Relationships Between the Capillary-Free Zone Area and the Inner Retinal Thickness in the Fovea
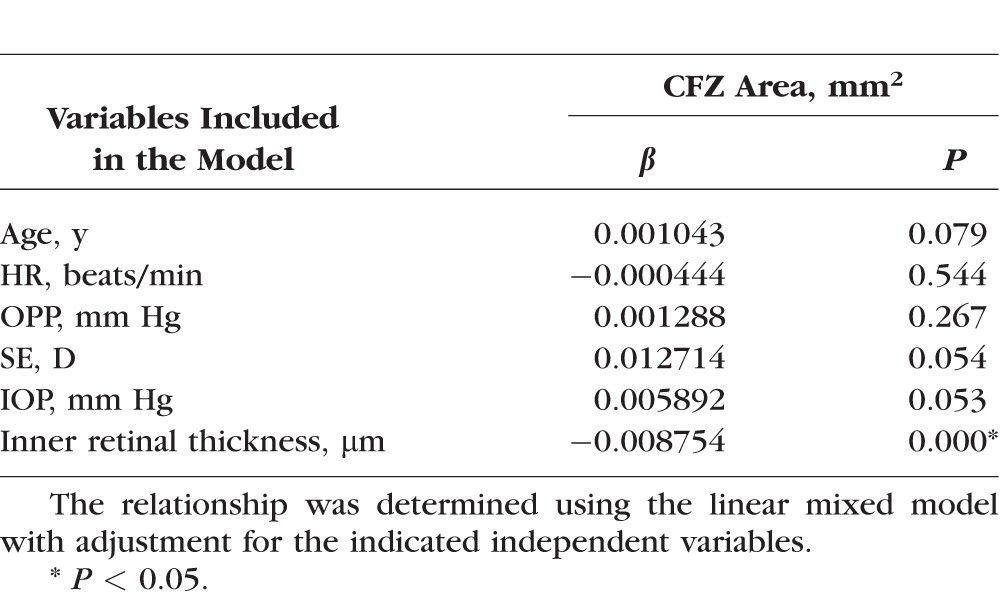
Table 4.
Relationship Between the Capillary-Free Zone Area and the Full Retinal Thickness in the Fovea
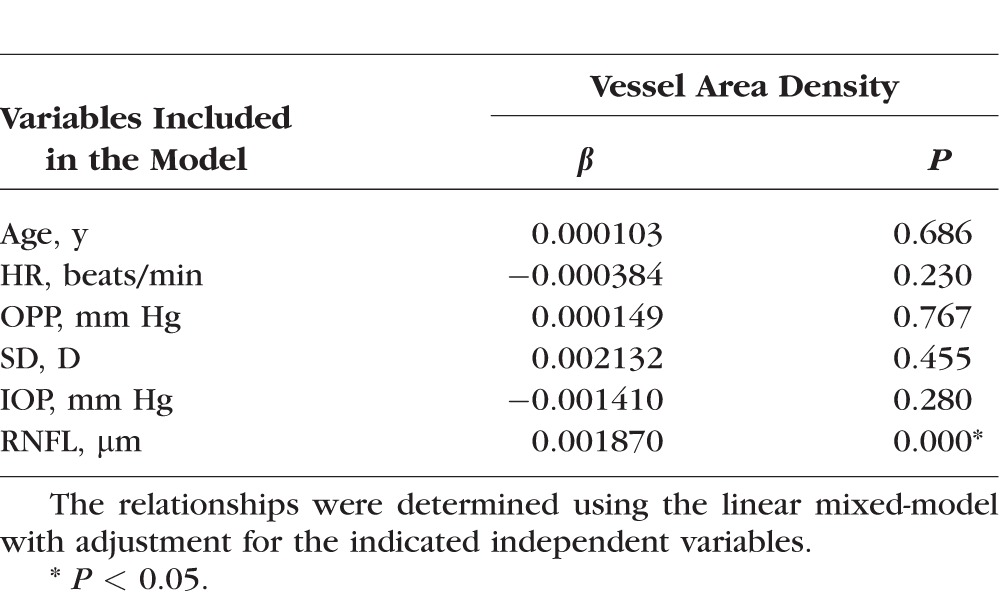
The vessel area density of the parapapillary region was positively correlated with the RNFL thickness (P < 0.001, Fig. 2D). These correlations remained statistically significant after the analysis was adjusted for other variables, including age, SE, HR, OPP, and IOP in linear mixed-models (P < 0.001, Table 5). Vessel area density was not correlated with any of the other variables (all P > 0.05, Table 4). Each 1 × SD decrease in RNFL was associated with a 1.6% decrease in the vessel area density.
Table 5.
Relationship Between Retinal Perfusion and the Retinal Nerve Fiber Layer Thickness in the Peripapillary Region
Discussion
In this study, we used OCT to examine whether retinal perfusion was correlated with the retinal thickness of the peripapillary and macular regions in a group of healthy Chinese subjects. Of note, we found that the blood supply from the central retinal artery system was closely correlated with the thickness of the inner neural retina.
Recently, OCT angiography was shown to be an effective, noninvasive tool for monitoring blood flow in small retinal vessels.18–24 This technique is based on an efficient algorithm known as SSADA.26 Amplitude-decorrelation angiography is an amplitude-based OCT angiography algorithm, which is based on variations in the reflectance amplitude. Decorrelation of the OCT signal amplitude between B-scans taken at the same nominal position could be caused by several sources: (1) regional blood flow, (2) bulk tissue motion or scanner position error, and (3) background noise. A signal corresponding to the true blood flow can be detected by suppressing decorrelation caused by (2) and (3). The split-spectrum technique greatly reduces the scan time and improves the signal-to-noise ratio of flow detection, and makes it possible to obtain high-quality angiograms using a commercial OCT system. In our study, noncontact OCT system was used to record retinal perfusion and retinal thickness. This approach is convenient for both clinical research and practice, especially for examining retinal diseases characterized by vascular pathologies. However, the OCT angiogram provided the macular perfusion of a 5 × 5 area and, although this system also determined the retinal thickness in the same dimension, it defined the inner retinal thickness as the thickness of retinal tissue from the ILM to the outer boundary of the IPL. Notably, Chan et al.27 reported that, in the posterior pole, the deepest capillaries were found in the deepest part of the INL. Therefore, we used another SD-OCT system (Spectralis), which could measure the thicknesses of 11 different layers of retina, and the retinal thickness between the ILM and the outer boundary of the INL could be calculated. Unfortunately, the Spectralis defines the perifovea as an annulus with an outer diameter of 6 mm and an inner diameter of 3 mm, whereas the OCT angiogram defines the perifovea as smaller annulus with an outer diameter of 5 mm and inner diameter of 3 mm. Therefore, only the foveal and parafoveal regions were examined.
Using OCT, we found a strong correlation between the inner thickness and the perfusion of the retina. The close correlation between peripapillary blood flow and RNFL thickness observed in our study is consistent with the results reported by Tham et al.28 and Yu et al.29 We then studied the correlation between retinal perfusion and inner retinal thickness in the macular region in detail. Our finding that retinal perfusion was correlated with the inner retinal thickness but not with the full retinal thickness is consistent with the understanding that oxygen and nutrition demands of the inner retina are met by the central retinal artery system, while those of the outer retina are met by the choroidal vascular system.30 This might also prove the reliability of OCT angiograms in another way. Formerly, Burgansky-Eliash et al.31 failed to find a correlation between blood flow velocity in retinal vessels and retinal thickness. By contrast, Landa et al.32 reported that retinal volume was strongly correlated with the blood flow velocity in retinal vessels. The different parameters and techniques used in those studies could explain the differences in their results. However, the vessel area density is actually the mean value of a specific region; accordingly, we used the mean thickness of that region, rather than the volume, which was not determined as the mean. This increased the reliability of our analyses. It is possible that an increase in the retinal thickness might lead to an increase in oxygen and nutrient demands, and hence increase retinal perfusion. But, conversely, an increase in vessel volume might also translate into an increase in retinal thickness.
The analyses showed that each 1 × SD decrease in the inner retinal thickness was associated with a 1.3% to 1.6% decrease in the vessel area density. Cheung et al.8 reported that each 1 × SD decrease in the RNFL thickness was associated with a decrease in the arteriole and venule diameters by 0.62 pixels (P < 0.01) and 0.99 pixels (P < 0.01), respectively. In that study, the mean arteriole and venule diameters were approximately 27 to 30 pixels and 38 to 41 pixels, respectively. Therefore, the reductions in diameters were approximately 2.1% to 2.6%, similar to our results.
Garhofer et al.33 reported marked variability in blood flow in the optic nerve head (largest/smallest: 3.5) among individuals. This variability was greater than the variability in RNFL thickness (largest/smallest: 2.2–2.3) in another study.34,35 The reason for this is not fully clear. In our study, we found much smaller variability in perfusion parameters (1.2–1.5), consistent with the small variability in retinal thickness (1.2–2.3; Supplementary Table S2). The earlier studies measured blood flow in large vessels surrounding the disc. By contrast, we measured blood flow in the large vessels and in the small blood vessels, including capillaries. Retinal tissue is directly supplied by small capillaries, and this might explain the consistent variability in our study.
Capillary-free zone area was negatively correlated with the inner fovea thickness. This finding agrees with those of the studies by Chui et al.36 and Tick et al.37 These findings are also consistent with the concept that the inner retina is supplied by the central retinal vasculature. But, the CFZ area was also significantly and negatively correlated with the full retinal thickness of the fovea. Although the reason for this is not fully clear, the strong correlation between the inner retinal thickness and the full retinal thickness of the fovea (r = 0.815, P < 0.001) might explain this finding. A strong correlation between the inner retinal thickness and the full retinal thickness was also found in the parafoveal (r = 0.792, P < 0.001) region, where perfusion was not correlated with full retinal thickness. Scarinci et al.38 recently reported that macular ischemia is often associated with photoreceptor damage in patients with diabetes. These findings suggest that future studies might be required to improve our understanding of the retinal perfusion at the fovea.
A correlation between macular perfusion and age, which was observed in our prior study,18 was not apparent in the present study, possibly because many of the subjects (18/64) were younger than 25-years old. When we limited the analysis to subjects aged older than 35 years, we observed significant correlations between macular perfusion and age, and between macular perfusion and inner retinal thickness (Supplementary Table S3). These findings agree with those of other studies. In particular, Burgansky-Eliash et al.31 reported a negative correlation between age and blood flow velocity in venules in subjects aged over 40 years, while Kimura et al.39 found no correlation between blood flow and age in subjects aged less than 42 years. Therefore, the reduction in macular perfusion might be more prominent in older subjects, particularly those aged more than 35 to 40 years.
Although we examined correlations between retinal perfusion and retinal structure in this study, we did not assess the possible correlations with visual function, such as retinal sensitivity determined using a microperimeter. Future studies on this aspect or development of OCT angiogram might further improve our knowledge of retinal perfusion.
In conclusion, we observed strong correlations between the perfusion parameters obtained by OCT angiography and the inner retinal thicknesses in the macular and parapapillary regions. The techniques used here might be helpful in future studies of retinal diseases associated with vascular disorders.
Supplementary Material
Acknowledgments
Supported in part by grants from the National Major Scientific Equipment Program (2012YQ12008003; Beijing, Beijing, China), the Shanghai Committee of Science and Technology (13430710500 and 15DZ1942204; Shanghai, Shanghai, China), National Institutes of Health (Bethesda, MD, USA) Grants R01 EY023285, UL1TR000128, DP3 DK104397, R01 EY024544, and an unrestricted grant from Research to Prevent Blindness (New York, NY, USA).
Disclosure: J. Yu, None; R. Gu, None; Y. Zong, None; H. Xu, None; X. Wang, None; X. Sun, None; C. Jiang, None; B. Xie, None; Y. Jia, Optovue (F); D. Huang, Optovue (F), Carl Zeiss Meditec (F)
References
- 1. Yu DY,, Cringle SJ. Oxygen distribution and consumption within the retina in vascularised and avascular retinas and in animal models of retinal disease. Prog Retin Eye Res. 2001; 20: 175–208. [DOI] [PubMed] [Google Scholar]
- 2. Zhu W,, Cui M,, Yao F,, Liao R,, Liu L. Retrobulbar and common carotid artery haemodynamics and carotid wall thickness in patients with non-arteritic anterior ischaemic optic neuropathy. Graefes Arch Clin Exp Ophthalmol. 2014; 252: 1141–1146. [DOI] [PubMed] [Google Scholar]
- 3. Costa VP,, Lanzl I,, Gugleta K,, et al. Ocular perfusion pressure in glaucoma. Acta Ophthalmol. 2014; 92: e252–e266. [DOI] [PubMed] [Google Scholar]
- 4. Sehi M,, Goharian I,, Konduru R,, et al. Retinal blood flow in glaucomatous eyes with single-hemifield damage. Ophthalmology. 2014; 121: 750–758. [DOI] [PMC free article] [PubMed] [Google Scholar]
- 5. Falsini B,, Anselmi GM,, Marangoni D,, et al. Subfoveal choroidal blood flow and central retinal function in retinitis pigmentosa. Invest Ophthalmol Vis Sci. 2011; 52: 1064–1069. [DOI] [PubMed] [Google Scholar]
- 6. Zeitz O,, Galambos P,, Wagenfeld L,, et al. Glaucoma progression is associated with decreased blood flow velocities in the short posterior ciliary artery. Br J Ophthalmol. 2006; 90: 1245–1248. [DOI] [PMC free article] [PubMed] [Google Scholar]
- 7. Zheng Y,, Cheung N,, Aung T,, Mitchell P,, He M,, Wong TY. Relationship of retinal vascular caliber with retinal nerve fiber layer thickness: the Singapore Malay Eye Study. Invest Ophthalmol Vis Sci. 2009; 50: 4091–4096. [DOI] [PubMed] [Google Scholar]
- 8. Cheung N,, Huynh S,, Wang JJ,, et al. Relationships of retinal vessel diameters with optic disc, macular and retinal nerve fiber layer parameters in 6-year-old children. Invest Ophthalmol Vis Sci. 2008; 49: 2403–2408. [DOI] [PubMed] [Google Scholar]
- 9. Østergaard L,, Finnerup NB,, Terkelsen AJ,, et al. The effects of capillary dysfunction on oxygen and glucose extraction in diabetic neuropathy. Diabetologia. 2015; 58: 666–677. [DOI] [PMC free article] [PubMed] [Google Scholar]
- 10. Alterman M,, Henkind P. Radial peripapillary capillaries of the retina. II. Possible role in Bjerrum scotoma. Br J Ophthalmol. 1968; 52: 26–31. [DOI] [PMC free article] [PubMed] [Google Scholar]
- 11. Ashton N. Pathophysiology of retinal cotton-wool spots. Br Med Bull. 1970; 26: 143–150. [DOI] [PubMed] [Google Scholar]
- 12. Daicker B. Selective atrophy of the radial peripapillary capillaries and visual field defects in glaucoma [in German]. Albrecht Von Graefes Arch Klin Exp Ophthalmol. 1975; 195: 27–32. [DOI] [PubMed] [Google Scholar]
- 13. Agarwal A. Gass' Atlas of Macular Diseases. 5th ed. Philadelphia: Saunders; 2011: 1–10. [Google Scholar]
- 14. Huang D,, Swanson EA,, Lin CP,, et al. Optical coherence tomography. Science. 1991; 254: 1178–1181. [DOI] [PMC free article] [PubMed] [Google Scholar]
- 15. Wolf S,, Wolf-Schnurrbusch U. Spectral-domain optical coherence tomography use in macular diseases: a review. Ophthalmologica. 2010; 224: 333–340. [DOI] [PubMed] [Google Scholar]
- 16. Yu J,, Ni Y,, Keane PA,, Jiang C,, Wang W,, Xu G. Foveomacular schisis in juvenile X-linked retinoschisis: an optical coherence tomography study. Am J Ophthalmol. 2010; 149: 973–978. [DOI] [PubMed] [Google Scholar]
- 17. Strom C,, Sander B,, Larsen N,, Larsen M,, Lund-Andersen H. Diabetic macular edema assessed with optical coherence tomography and stereo fundus photography. Invest Ophthalmol Vis Sci. 2002; 43: 241–245. [PubMed] [Google Scholar]
- 18. Yu J,, Jiang C,, Wang X,, et al. Macular perfusion in healthy Chinese: an optical coherence tomography angiogram study. Invest Ophthalmol Vis Sci. 2015; 56: 3212–3217. [DOI] [PMC free article] [PubMed] [Google Scholar]
- 19. Jia Y,, Wei E,, Wang X,, et al. Optical coherence tomography angiography of optic disc perfusion in glaucoma. Ophthalmology. 2014; 121: 1322–1332. [DOI] [PMC free article] [PubMed] [Google Scholar]
- 20. Wang X,, Jia Y, Spain R, et al. Optical coherence tomography angiography of optic nerve head and parafovea in multiple sclerosis. Br J Ophthalmol. 2014; 98: 1368–1373. [DOI] [PMC free article] [PubMed] [Google Scholar]
- 21. Wei E,, Jia Y,, Tan O,, et al. Parafoveal retinal vascular response to pattern visual stimulation assessed with OCT angiography. PLoS One. 2013; 8: e81343. [DOI] [PMC free article] [PubMed] [Google Scholar]
- 22. Pechauer AD,, Jia Y,, Liu L,, Gao SS,, Jiang C,, Huang D. Optical coherence tomography angiography of peripapillary retinal blood flow response to hyperoxia. Invest Ophthalmol Vis Sci. 2015; 56: 3287–3291. [DOI] [PMC free article] [PubMed] [Google Scholar]
- 23. Jia Y,, Morrison JC,, Tokayer J,, et al. Quantitative OCT angiography of optic nerve head blood flow. Biomed Opt Express. 2012; 3: 3127–3137. [DOI] [PMC free article] [PubMed] [Google Scholar]
- 24. Jia Y,, Bailey ST,, Wilson DJ,, et al. Quantitative optical coherence tomography angiography of choroidal neovascularization in age-related macular degeneration. Ophthalmology. 2014; 12: 1435–1444. [DOI] [PMC free article] [PubMed] [Google Scholar]
- 25. Spaide RF,, Klancnik JM,, Cooney MJ. Retinal vascular layers imaged by fluorescein angiography and optical coherence tomography angiography. JAMA Ophthalmol. 2015; 133: 45. [DOI] [PubMed] [Google Scholar]
- 26. Jia Y,, Tan O,, Tokayer J,, et al. Split-spectrum amplitude-decorrelation angiography with optical coherence tomography. Opt Express. 2012; 20: 4710–4725. [DOI] [PMC free article] [PubMed] [Google Scholar]
- 27. Chan G,, Balaratnasingam C,, Yu PK,, et al. Quantitative morphometry of perifoveal capillary networks in the human retina. Invest Ophthalmol Vis Sci. 2012; 53: 5502–5514. [DOI] [PubMed] [Google Scholar]
- 28. Tham YC,, Cheng CY,, Zheng Y,, Aung T,, Wong TY,, Cheung CY. Relationship between retinal vascular geometry with retinal nerve fiber layer and ganglion cell-inner plexiform layer in nonglaucomatous eyes. Invest Ophthalmol Vis Sci. 2013; 54: 7309–7316. [DOI] [PubMed] [Google Scholar]
- 29. Yu PK,, Cringle SJ,, Yu D. Correlation between the radial peripapillary capillaries and the retinal nerve fibre layer in the normal human retina. Exp Eye Res. 2014; 129: 83–92. [DOI] [PubMed] [Google Scholar]
- 30. Kur J,, Newman EA,, Chan-Ling T. Cellular and physiological mechanisms underlying blood flow regulation in the retina and choroid in health and disease. Prog Retin Eye Res. 2012; 31: 377– 406. [DOI] [PMC free article] [PubMed] [Google Scholar]
- 31. Burgansky-Eliash Z,, Lowenstein A,, Neuderfer M,, et al. The correlation between retinal blood flow velocity measured by the retinal function imager and various physiological parameters. Ophthalmic Surg Lasers Imaging Retina. 2013; 44: 51–58. [DOI] [PubMed] [Google Scholar]
- 32. Landa G,, Garcia PMT,, Rosen RB. Correlation between retina blood flow velocity assessed by retinal function imager and retina thickness estimated by scanning laser ophthalmoscopy/optical coherence tomography. Ophthalmologica. 2009; 223: 155–161. [DOI] [PubMed] [Google Scholar]
- 33. Garhofer G,, Werkmeister R,, Dragostinoff N,, Schmetterer L. Retinal blood flow in healthy young subjects. Invest Ophthalmol Vis Sci. 2012; 53: 698–703. [DOI] [PubMed] [Google Scholar]
- 34. Rougier M,, Korobelnik J,, Malet F,, et al. Retinal nerve fibre layer thickness measured with SD-OCT in a population-based study of French elderly subjects: the Alienor study. Acta Ophthalmologica. 2015; 93: 539–545. [DOI] [PubMed] [Google Scholar]
- 35. Tariq YM,, Li H,, Burlutsky G,, Mitchell P. Retinal nerve fiber layer and optic disc measurements by spectral domain OCT: normative values and associations in young adults. Eye (Lond). 2012; 26: 1563–1570. [DOI] [PMC free article] [PubMed] [Google Scholar]
- 36. Chui TYP,, Zhong Z,, Song H,, Burns SA. Foveal avascular zone and its relationship to foveal pit shape. Optometry Vision Sci. 2012; 89: 602–610. [DOI] [PMC free article] [PubMed] [Google Scholar]
- 37. Tick S,, Rossant F,, Ghorbel I,, et al. Foveal shape and structure in a normal population. Invest Ophthalmol Vis Sci. 2011; 52: 5105–5110. [DOI] [PubMed] [Google Scholar]
- 38. Scarinci F,, Jampol LM,, Linsenmeier RA,, Fawzi AA. Association of diabetic macular nonperfusion with outer retinal disruption on optical coherence tomography. JAMA Ophthalmol. 2015; 133: 1036–1044. [DOI] [PMC free article] [PubMed] [Google Scholar]
- 39. Kimura I,, Shinoda K,, Tanino T,, Ohtake Y,, Mashima Y,, Oguchi Y. Scanning laser Doppler flowmeter study of retinal blood flow in macular area of healthy volunteers. Br J Ophthalmol. 2003; 87: 1469–1473. [DOI] [PMC free article] [PubMed] [Google Scholar]
Associated Data
This section collects any data citations, data availability statements, or supplementary materials included in this article.


