Abstract
Purpose
To quantify changes in retinal microvasculature in diabetic retinopathy (DR) by using spectral-domain optical coherence tomography angiography (SD-OCTA).
Methods
Retrospective, cross-sectional, observational study of healthy and diabetic adult subjects with and without DR. Retinal microvascular changes were assessed by using SD-OCTA images and an intensity-based optical microangiography algorithm. A semiautomated program was used to calculate indices of microvascular density and morphology in nonsegmented and segmented SD-OCTA images. Microvascular density was quantified by using skeleton density (SD) and vessel density (VD), while vessel morphology was quantified as fractal dimension (FD) and vessel diameter index (VDI). Statistical analyses were performed by using the Student's t-test or analysis of variance with post hoc Tukey honest significant difference tests for multiple comparisons.
Results
Eighty-four eyes with DR and 14 healthy eyes were studied. Spearman's rank test demonstrated a negative correlation between DR severity and SD, VD, and FD, and a positive correlation with VDI (ρ = −0.767, −0.7166, −0.768, and +0.5051, respectively; P < 0.0001). All parameters showed high reproducibility between graders (ICC = 0.971, 0.962, 0.937, and 0.994 for SD, VD, FD, and VDI, respectively). Repeatability (κ) was greater than 0.99 for SD, VD, FD, and VDI.
Conclusions
Vascular changes in DR can be objectively and reliably characterized with SD, VD, FD, and VDI. In general, decreasing capillary density (SD and VD), branching complexity (FD), and increasing average vascular caliber (VDI) were associated with worsening DR. Changes in capillary density and morphology were significantly correlated with diabetic macular edema.
Keywords: optical coherence tomography angiography, diabetic retinopathy, quantitative analysis, vessel density, vessel morphology
Diabetic retinopathy (DR) remains a leading cause of visual impairment and blindness in the world.1–3 Spectral-domain optical coherence tomography angiography (SD-OCTA) is a novel modality that safely, quickly, and noninvasively demonstrates the retinal microvasculature with resolution that exceeds fluorescein angiography (FA).4–8 Qualitative assessments of retinal vascular changes in subjects with DR have shown that OCTA can demonstrate impaired capillary perfusion, intraretinal microvascular anomalies, neovascularization, as well as some types of microaneurysms and intraretinal fluid with equal or better resolution than conventional FA.9–14 In addition to these qualitative findings, OCTA offers a significant advantage for quantitative and objective assessments.
Fluorescein angiography or color fundus photographs have been used to establish quantitative indices of perfusion in DR.15–22 However, these imaging modalities do not resolve retinal capillaries reliably7 and cannot detect subtle changes.23 Quantification of retinal perfusion using OCTA has been reported in normal subjects4,24 and retinal vascular disease.9,12,25–32 Various measures of vessel density (VD) in particular have been investigated in several preliminary studies using different OCTA devices and processing algorithms. Matsunaga et al.4 have measured VD parameters in five healthy subjects by using swept-source OCTA (SS-OCTA) and optical microangiography (OMAG) algorithm. Jia et al.26 have used SS-OCTA and split-spectrum amplitude-decorrelation algorithm (SSADA) to localize and quantify the area of choroidal neovascularization in five subjects with age-related macular degeneration. Hwang et al.33 have measured vessel densities within a para- and perifoveal ring in 12 diabetic subjects by using SS-OCTA and SSADA. Finally, Agemy et al.34 have investigated retinal capillary perfusion density in DR with skeletonized SD-OCTA images processed with SSADA.
In addition to these vascular density measurements, other parameters that describe microvascular morphology may also be useful in assessing retinal vascular changes, including fractal dimension (FD) and vessel diameter index (VDI). Fractal dimension was first explored by using OCTA in the study by Reif et al.,35 which investigated the complexity of the vasculature in a mouse ear. These parameters have not been described in applications to the retinal vasculature with OCTA. In this study we used an SD-OCTA device with intensity-based OMAG algorithm to quantify retinal vascular density in healthy and diabetic subjects, as well as FD and VDI by using OCTA imaging of the retina. We showed that these parameters correlate with severity of disease and provide novel and complementary information about the changing status of the microvasculature in DR.
Patients and Methods
The study was conducted by following the principles outlined in the Declaration of Helsinki and approved by the institutional review board of the University of Southern California (USC). Informed consent was obtained from each subject. All eyes were imaged at the USC Eye Institute or affiliated clinics from November 2014 to September 2015. Healthy and diabetic subjects were included in the study if OCT signal was of sufficient quality for analysis. Diabetic retinopathy severity was graded on the basis of clinical examination and categorized into mild nonproliferative diabetic retinopathy (NPDR), moderate NPDR, severe NPDR, and proliferative diabetic retinopathy (PDR) on the basis of the modified Airlie House/Early Treatment Diabetic Retinopathy Study (ETDRS) criteria.36,37 In several cases, DR severity was clinically assessed as mild–moderate or moderate–severe NPDR; in these cases, the subjects were placed in the mild or severe NPDR category, respectively. Patients with other retinal vascular disease were excluded.
Spectral-domain OCTA data was acquired with a Cirrus (Carl Zeiss Meditec, Dublin, CA, USA) prototype with a central wavelength of 840 nm and a scan speed of 68,000 A-scans per second. At least one 3×3-mm scan centered on the fovea was taken in each eye of interest. An OMAG algorithm was used to generate full-thickness en face OCTA images.4,35 An automated segmentation algorithm produced three horizontal depth-resolved slabs consisting of the superficial retinal layer (SRL), encompassing the superficial 60% of retina extending from the inner limiting membrane (ILM) to 110 μm above the retinal pigment epithelium (RPE); the deep retinal layer (DRL), extending through the remaining 40% of the thickness between the ILM and RPE; and the outer retinal layer, extending from 110 μm above the RPE to the external limiting membrane. A full-thickness slab extending from the ILM to the RPE was also used in a single nonsegmented analysis. This segmentation algorithm was based on recent immunohistologic studies of the human retinal vasculature, demonstrating the presence of distinct capillary plexuses that can be divided into superficial and deeper networks.38 The scan location and segmentation scheme have been described before (see Supplementary Fig. S1 for example segmentation).4,14
Evaluation of B-scans and structural en face images was used to determine whether areas of hypo- or hyperreflectivity were artifactual (e.g., due to floaters) or real (e.g., due to intraretinal fluid or hard exudates) (see Supplementary Figs. S2–S6 for the B scans and structural en face images corresponding to representative OCTA images). Any images with significant artifactual components were excluded from the study to avoid confounding of quantitative analysis due to blockage of OCT signal by floaters, eyelashes, motion, or other artifacts. In addition, any images with significant segmentation errors due to pathology were excluded from the study. All images with areas of nonartifactual hypo- or hyperreflectivity on OCTA (i.e., due to pathology such as edema or exudates) remained in the study analysis.
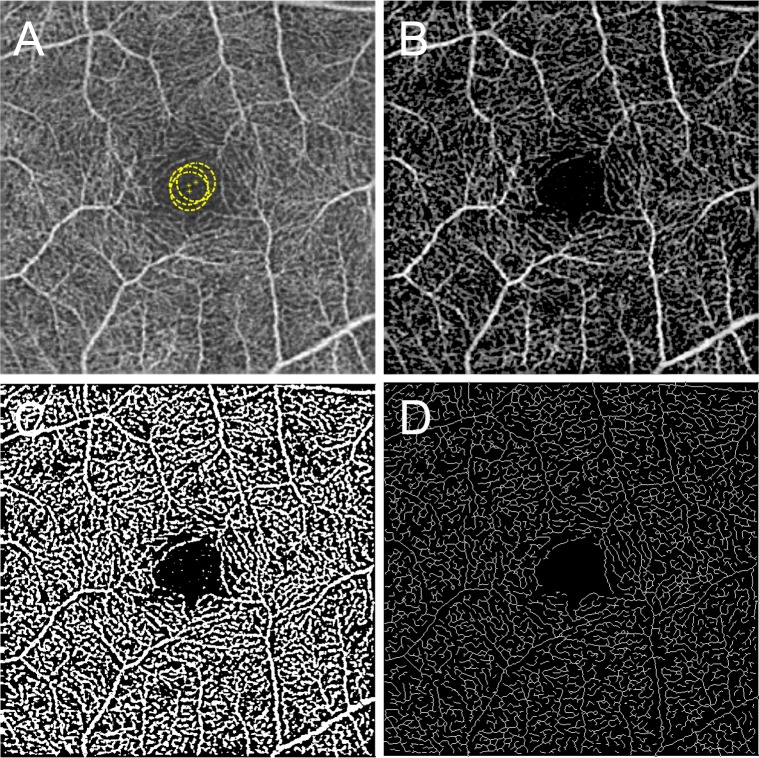
A custom semiautomated algorithm was developed and used to quantify several parameters that describe retinal vascular density and morphology. These parameters are the skeleton density (SD), VD, FD, and VDI. To quantify these parameters, the grayscale 2D en face SD-OCTA image was first converted into an 8-bit image (586 × 585 pixels), encompassing a 3×3-mm area around the fovea (1 pixel ≈ 5.13 × 5.13 μm2). This image was converted into a binary image by using a three-way combined method consisting of a global threshold, hessian filter, and adaptive threshold in MATLAB (R2013b; MathWorks, Inc., Natick, MA, USA). First, an area within the foveal avascular zone was selected three times with a circle of fixed radius (50 pixels) to establish the baseline signal-to-noise ratio for the global thresholding (Fig. 1A). The image was then processed with a top-hat filter with window size of 12 pixels (Fig. 1B). This image was then separately processed to create two distinct binarized images: one created with application of hessian filter, and the other created through median adaptive thresholding. Lastly, the two resulting binarized vessel maps were combined to form the final binarized image (Fig. 1C). Only pixels that were detected on both binarized versions (hessian filter and adaptive threshold) were included in the final binarized image. A similar binarization method has been described by Reif et al.35
Figure 1.
Representative SD-OCTA and postprocessed images illustrating the semiautomated analysis algorithm. (A) Original, nonsegmented SD-OCTA image. Yellow circles demonstrate the manually selected area that was used as global thresholding. (B) Top-hat filtered image. (C) A binarized image was obtained by using combined adaptive threshold and hessian filter. This image was used for quantification of vessel density. (D) A skeletonized image was obtained by iteratively deleting the pixels in the outer boundary of the binarized image until 1 pixel remained along the width direction of the vessels. This image was used for calculation of skeleton density. The yellow scale bar in (A) shows a distance of 500 μm. This scale applies to (A–D).
After acquiring the binary image (Fig. 1C), VD was calculated as a unitless proportion of the total image area occupied by the detected OCTA signal (binarized as white pixels) compared to total area of retina (total number of pixels) depicted in the binarized image as follows:
 ,
,
|
where B(i,j) represents pixels occupied by blood vessels (white pixels in the binarized image) and X(i,j) are all pixels in the binarized image. The pixel coordinates (i,j) in this case refer to the pixels in the binarized OCTA image (assuming an image with N × N pixel array). The summation notations for B(i,j) and X(i,j) are squared because they are two-dimensional areas within the image (occupying both length and width in the image space).
Skeletonized images were created by iteratively deleting the pixels in the outer boundary of the binarized, white-pixelated vasculature until 1 pixel remained along the width direction of the vessels (Fig. 1D). Therefore, SD represents the length of blood vessel (pixels/pixels2) based on the skeletonized SD-OCTA image, calculated as follows:
 ,
,
|
where L(i,j) represents pixels occupied by blood vessel length (white pixels in the skeletonized image) and X(i,j) are all pixels in the skeletonized image (Fig. 1D). The pixel coordinates (i,j) in this case refer to the pixels in the skeletonized OCTA image (assuming an image with N × N pixel array). In this case, the summation notations for L(i,j) is not squared because this is a one-dimensional measurement of only length within the skeletonized image. However, X(i,j) is still squared to account for the two-dimensionality of the skeletonized image as a whole. Fractal dimension of each skeletonized image could then be calculated by using the box-counting method, as described previously.35 Fractal dimension provides an index of the branching complexity of the capillary network.
The VDI was calculated by using the binary blood vessel image and the skeleton image to yield the average vessel caliber in the SD-OCTA image (pixels) as follows:
 ,
,
|
where B(i,j) represents pixels occupied by vessel area (two-dimensional white pixels representing both length and width in the binarized image, Fig. 1C) and L(i,j) are pixels occupied by blood vessel length (one-dimensional white pixels representing length in the skeletonized image, Fig. 1D).
Skeleton density, VD, FD, and VDI were determined for both segmented SD-OCTA images (SRL and DRL) and nonsegmented SD-OCTA images. All images were independently analyzed and compared among healthy and diabetic subjects by two masked graders. All results were compared between investigators by using the intraclass correlation coefficient (ICC). The analysis from one grader was repeated twice to calculate the repeatability (κ). Results from one grader were reported in this study as the mean and standard deviation for all eyes. Statistical analysis was performed by using the Student's t-test or analysis of variance (ANOVA) with post hoc Tukey honest significant difference (HSD) tests for multiple comparisons. A P < 0.05 was accepted as significant. Power analysis was conducted for each group comparison within the nonsegmented image analysis. SPSS software (version 22; IBM Corp., Chicago, IL, USA) and MATLAB software (R2013b) were used for all statistical analyses. Graphs were created by using Microsoft Excel (Microsoft Corp., Seattle, WA, USA).
Results
Of a total of 116 eyes imaged for the study, 14 eyes (12%) were excluded from the final study group owing to poor OCTA image quality. An additional four eyes were excluded owing to presence of other retinal disease. Fifty patients with DR (84 eyes) and eight healthy subjects with no prior ophthalmologic or medical history (14 eyes) were included in this study. Pertinent demographic data are shown in Table 1. Subjects within the healthy and DR-only groups were not significantly different in age and sex distribution.
Table 1.
Demographics of Healthy and Diabetic Subjects
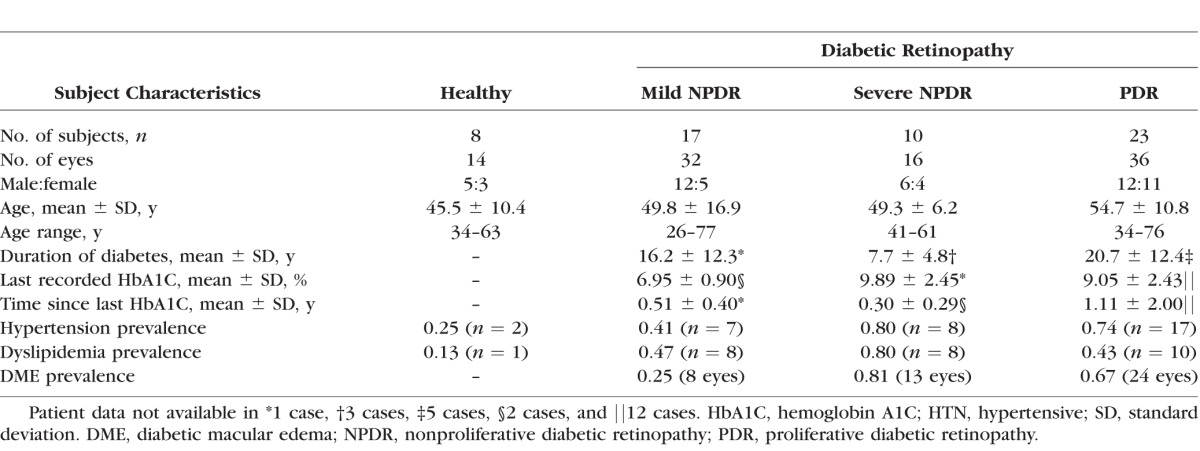
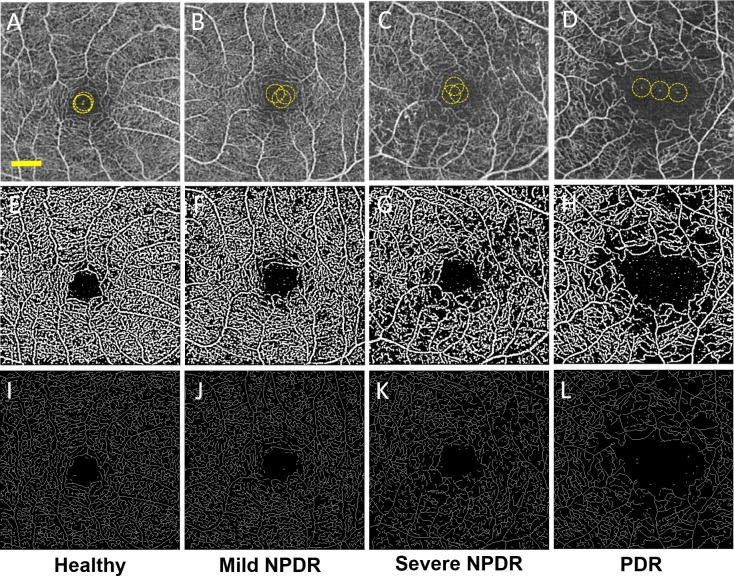
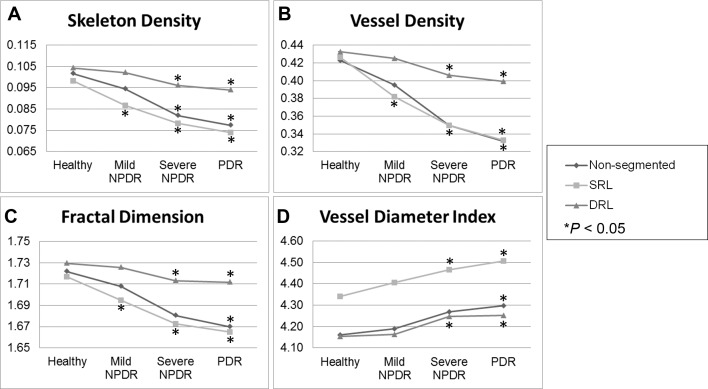
Figure 2 shows representative nonsegmented SD-OCTA images and postprocessed images used for data analysis for a healthy eye and eyes with increasing severity of DR. Higher magnification images are shown in Supplementary Figures 2 through 6 for reference. In general, binarized images and skeletonized images both demonstrated areas of vascular abnormalities more clearly than the raw SD-OCTA images. Gross examination of the skeletonized and binarized images showed progressively more abnormal retinal vasculature with increasing severity of DR, seen as decreased capillary density and decreased branching within the capillary beds (Figs. 2A–L). These qualitative findings were supported by quantitative findings of decreasing SD and VD with increasing severity of DR. In addition, the FD of the images progressively decreased with increasing severity of DR. Vessel diameter index increased with progressively worsening DR. Overall, SD, VD, and FD progressively decreased while VDI progressively increased with increasing DR severity compared to healthy eyes. These comparisons were statistically significant for all parameters when comparing healthy eyes to those with severe NPDR or PDR, and when comparing mild NPDR with severe NPDR or PDR. Data for all eyes from segmented and nonsegmented OCTA images are shown in Table 2 and graphically depicted in Figures 3A through 3D. ANOVA results for each group comparison are shown in Table 3.
Figure 2.
Nonsegmented SD-OCTA images with quantitative image outputs of representative subjects in 3×3-mm areas around the fovea. En face representations of retinal perfusion can be viewed as (A–D) 2D grayscale SD-OCTA images of retinal vasculature, with selection of noise thresholding marked with yellow in the foveal avascular zone. (E–H) Contrast-enhanced binarized and (I–L) skeletonized images of retinal perfusion around the macula corresponding to the group labeled in each column. The yellow scale bar in (A) shows a distance of 500 μm. This scale applies to (A–L).
Table 2.
Quantitative Analysis Results for Each Study Group and Segmentation Scheme
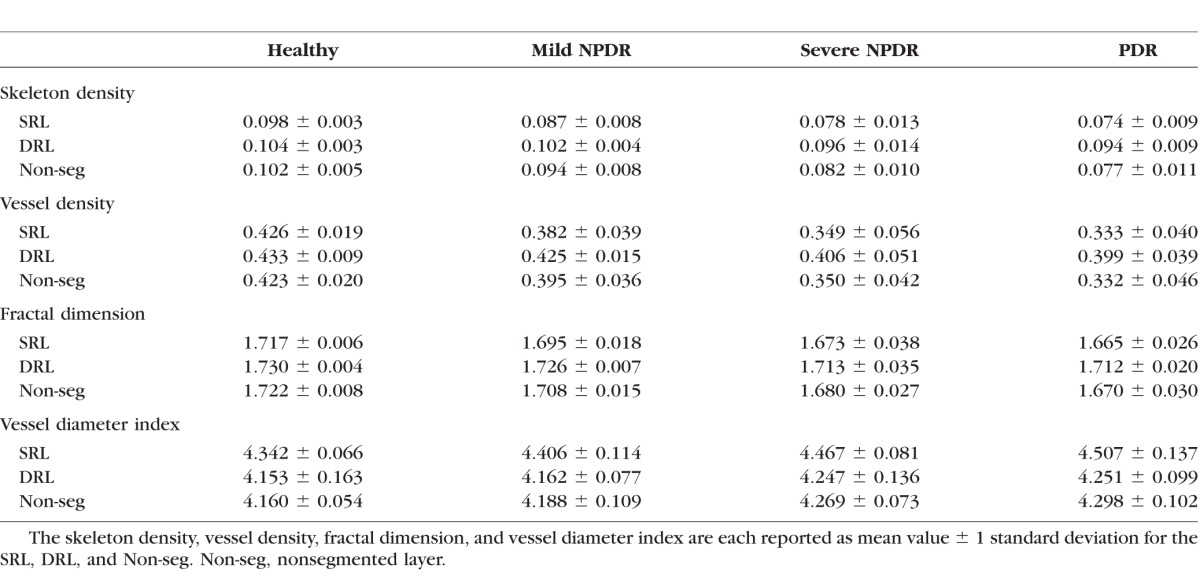
Figure 3.
Quantitative analysis of microvascular density and morphology on SD-OCTA images. Graphs of mean skeleton density (A), vessel density (B), fractal dimension (C), and vessel diameter index (D) of normal eyes and eyes affected by mild NPDR, severe NPDR, and PDR. Retinal perfusion indices were quantified in a 3×3-mm area over the macula by using MATLAB software and a novel quantitative algorithm as described in the Methods. Comparisons of these indices showed decreases in SD, VD, and FD along with increases in VDI in any stage of DR when compared to normal eyes. *P < 0.05.
Table 3.
Results of ANOVA With Post Hoc Tukey HSD Tests
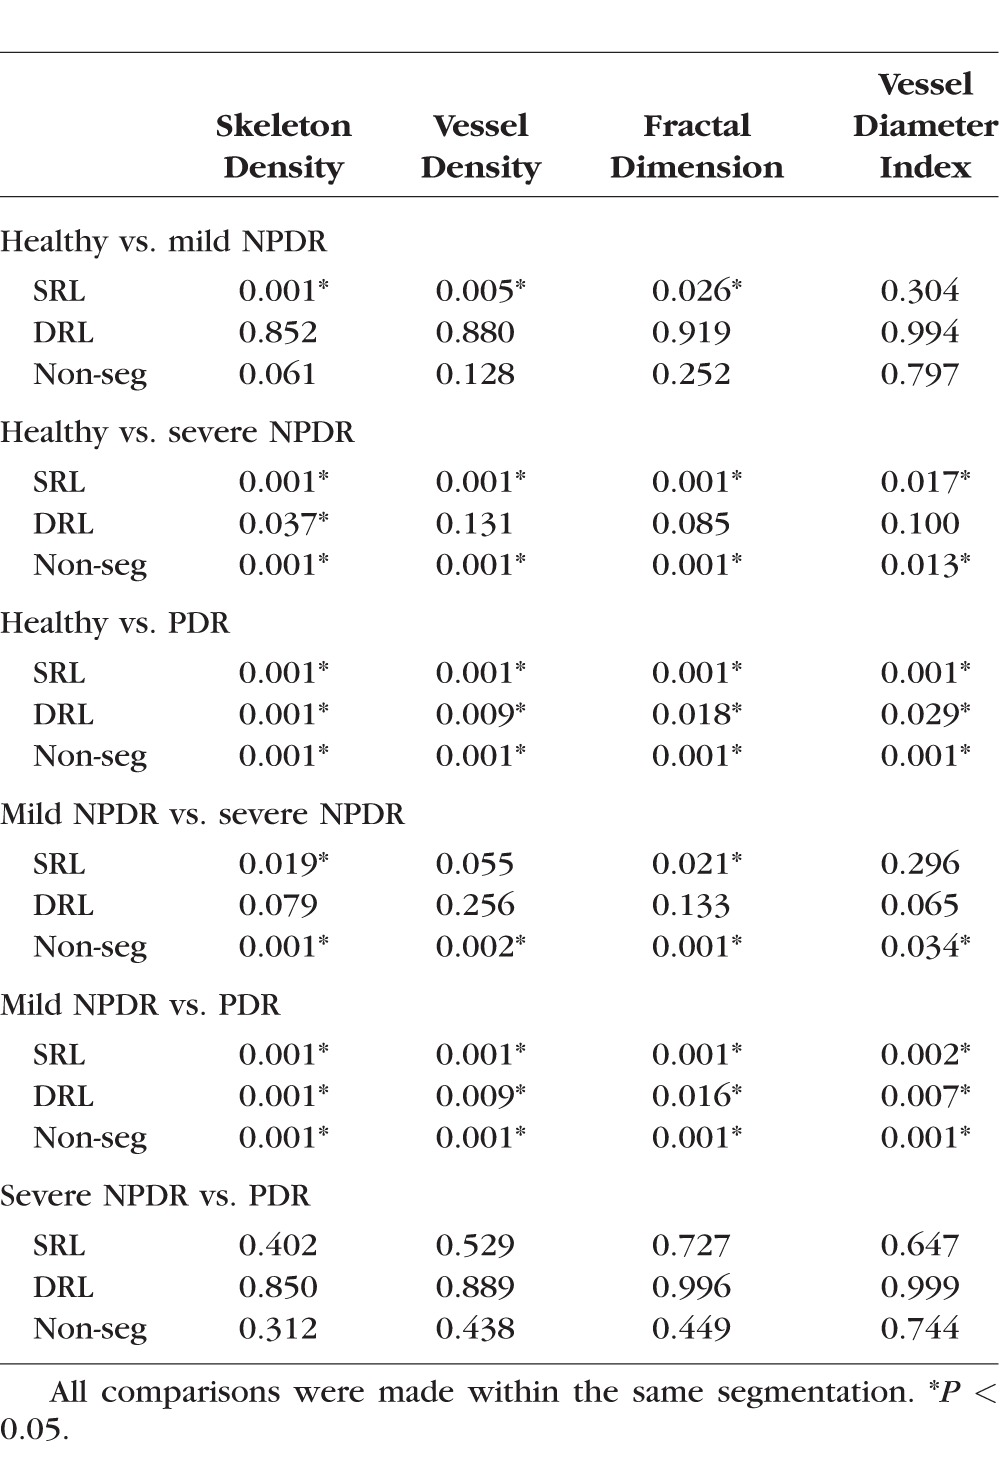
To determine if the findings in SD, VD, FD, and VDI among diabetic subjects were specific to any particular retinal layer, we performed a similar analysis on segmented SD-OCTA. For this analysis, the same parameters were measured on the SRL or DRL rather than on the full-thickness retinal slab. This analysis showed that subjects with mild NPDR had significantly lower SD, VD, and FD in the SRL than those with healthy eyes. The DRL vasculature did not show any significant differences for any of the parameters. Subjects with severe NPDR had significantly lower SD, VD, and FD and significantly higher VDI than those with healthy eyes in the SRL. Within the DRL, only the SD was found to be significantly lower when comparing mild NPDR or PDR to healthy eyes. All subjects with PDR had significantly lower SD, VD, and FD values and significantly higher VDI than those with healthy eyes or mild NPDR eyes regardless of segmentation. Severe NPDR and PDR eyes showed no significant differences in SD, VD, FD, or VDI regardless of segmentation. Figure 3 graphically summarizes the results from all groups.
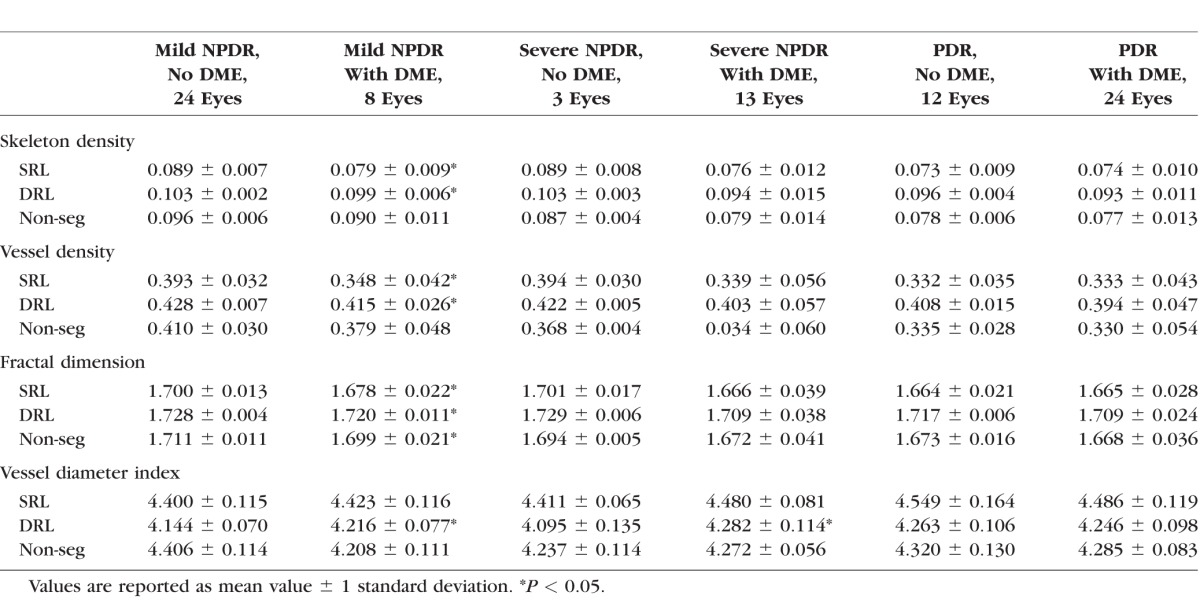
We hypothesized that the changes in some of the vascular parameters may be related to the presence or absence of diabetic macular edema (DME). To determine whether any of the parameters correlate with the presence of DME, we compared eyes with DME and those without DME among subjects with the same DR severity (Table 4). Among eyes with mild NPDR, 25% (8/32) had DME (Table 1) and these showed significantly lower SD, VD, and FD in the SRL and DRL, and significantly higher VDI in the DRL. In the nonsegmented comparison, only the FD was significantly different. In the severe NPDR category, 81% (13/16) of the eyes had DME, and only the VDI in the DRL was significantly greater than that of eyes with severe NPDR without DME. In the PDR group, 67% (24/36) of eyes had DME and these eyes were not significantly different compared to those eyes with PDR without DME regardless of segmentation.
Table 4.
Quantitative Analysis of Eyes With and Without DME
Spearman's rank test was conducted to confirm the correlation of DR severity and the four quantitative indices. Skeleton density, VD, and FD each demonstrated negative correlation, while VDI demonstrated positive correlation with DR severity (ρ = −0.767, −0.7166, −0.768, and +0.5051, respectively; all P < 0.0001). All parameters showed high reproducibility between graders with ICC of 0.971, 0.962, 0.937, and 0.994, for SD, VD, FD, and VDI, respectively. The analysis from one grader was repeated twice to calculate the repeatability (κ = 0.997, 0.996, 0.996, and 0.999 for SD, VD, FD, and VDI, respectively).
The power was at least 96.2% for all the pairs in which significant differences were detected within the nonsegmented analysis except for the VDI analysis of mild NPDR versus severe NPDR, which was 78.7% (Table 5). Comparisons in which no significance was detected were underpowered (<42.8%), likely owing to the small sample size of severe NPDR eyes.
Table 5.
Power Analysis of Comparisons With Nonsegmented OCTA Images

Discussion
This study quantitatively characterized the retinal vasculature among healthy and diabetic subjects by using objective measures of retinal vascular density and morphology that are derived from an intensity-based OMAG algorithm on a prototype SD-OCTA platform. Our previous studies have demonstrated that OCTA provides a high-resolution imaging platform for assessing microvascular density in healthy subjects4 as well as retinal vascular pathology in DR.10 The current study demonstrated that both qualitative and quantitative changes in vascular density and morphology are useful for assessing the clinical severity of DR. Characteristic changes of impaired capillary perfusion in DR can be objectively characterized by using SD and VD. The complexity of capillary branching can be reliably characterized with FD. Changes in the overall distribution of capillary size can be evaluated with the average VDI calculated for that particular area of the retina, which may indicate real widening of the retinal capillaries, a larger contribution of larger vessel diameters due to loss of capillary flow, or both. In general, progressively decreasing capillary density (SD and VD), branching complexity (FD), and progressively increasing average vascular caliber (VDI) were observed in eyes with worsening DR regardless of the segmentation scheme used (Fig. 3). In addition, there was a significant correlation between measures of capillary density and morphology and the presence of DME, suggesting that these measures may be predictive of DME.
While raw SD-OCTA provides high-resolution images of the retinal microvasculature, our study showed that a schematized representation of nonsegmented images, using either a binarized or skeletonized image, can qualitatively highlight subtle changes in retinal vasculature that are not as easily evident in the early stages of DR (Figs. 2B, 2F, 2J). In addition, the magnitude of changes were much easier to identify in more advanced stages of DR (Figs. 2D, 2H, 2L). It is notable that this was true even for nonsegmented images, which are shown in Figure 2. Our results demonstrated increasing impairment of perfusion both in the density and overall complexity of the microvasculature as a result of DR, even within a limited 3×3-mm window centered on the fovea and nonsegmented analysis. Specifically, we observed statistically significant differences in all parameters when comparing healthy eyes to those with severe NPDR or PDR in the nonsegmented analysis. We also observed statistically significant differences for all parameters when comparing mild NPDR with severe NPDR or PDR. Unfortunately, we did not have an isolated cohort of subjects with moderate NPDR in our study population. Therefore, we could not include that group in our analysis. Notably, all of the significant differences that we did observe were sufficiently powered for our study.
We did not observe a significant difference between any parameters in healthy eyes and mild NPDR except for SD, VD, and FD of the SRL. This may be for several reasons. First, the magnitude of the difference between these two DR severity groups may be among the smallest that one would expect to find among the analyses that we performed, and our sample sizes were relatively small. Second, our study only assessed the central 3×3-mm area centered on the fovea, and this may be too limited an area to reliably detect early microvascular changes. Future studies using 6×6-mm and larger fields may be more sensitive to the earliest changes in DR. Lastly, it is likely that the automated segmentation algorithms that are currently being used are confounded by image artifacts that would obscure the subtle changes in early DR in deeper layers. For example, projection artifacts may confound image quality and accuracy in the DRLs to an unknown degree, likely masking any real changes in the deeper vascular plexuses.39 Although some investigators have attempted to develop algorithms to remove these artifacts, there is no ideal way to address this issue at this time and every method of compensating for projection artifacts so far has definitive confounding effects as well.34,40 Also, use of full-thickness (nonsegmented) retinal images decreases the sensitivity to minor changes in retinal vasculature owing to the overlay of vessels in the 2D representation of the 3D retinal vascular network. In our data set, we found that there was a significant difference in SD, VD, and FD in the segmented SRL between healthy eyes and mild NPDR, and this may be because the SRL is the only layer that is not prone to any of the segmentation errors and projection artifacts. Therefore, we believe that use of the SRL is the most sensitive way of assessing changes in retinal vascular parameters for early DR without macular edema at this point. Future advances in segmentation methodology will probably overcome this limitation.
We also did not observe a significant difference in any parameter between severe NPDR and PDR regardless of segmentation. This may be explained by many of the same reasons outlined above. In addition, it is important to note that the clinical finding distinguishing severe NPDR from PDR is the development of extraretinal neovascularization, which most often occurs outside the macula.41,42 Therefore, the clinical classification between NPDR and PDR may not be a useful one for grading more stepwise progression of disease with OCTA.
Our data revealed significant differences in almost all parameters between eyes with mild NPDR with DME and those with mild NPDR without DME within the SRL and DRL. This pattern was not seen to the same extent in groups with more advanced DR or in the nonsegmented group. There are several possible reasons for these findings and the discrepancy between segmented and nonsegmented analyses. First, histologic evidence has definitively shown that DME is largely localized to the layers of the retina that correspond with the DRL in our segmentation scheme (see Supplementary Fig. S1 for segmentation with OCTA).43–45 Therefore, it is likely that the magnitude of the change in retinal vascular parameters is large enough and localized sufficiently to the DRL such that our current segmentation and SD-OCTA methods are sufficient for detection. This is supported by the finding that the VDI was significantly increased in most groups with DME regardless of DR severity (Table 4). These results were not observed in the nonsegmented analysis, likely because the 2D representation of the 3D capillary networks make it less sensitive to loss of DRL vessels.
From this study, we cannot say whether the vascular changes we report in subjects with DME are a result of DME or risk factors for DME, since we did not conduct a longitudinal study following up patients with OCTA before, during, and after development of DME. However, there are several possibilities that may explain the changes we observed. First, it is possible that the intraretinal cystoid spaces physically displace the retinal capillaries into adjacent layers. Second, it is possible that the intraretinal fluid attenuates, in some way, the decorrelation signal from the adjacent capillaries, making them undetectable. Third, it is possible that the mechanical pressure associated with the intraretinal cystoid spaces prohibits blood flow in adjacent capillaries. Lastly, it is possible that regions in and around intraretinal fluid actually have occluded or otherwise incompetent capillaries (that presumably led to the DME). These would certainly be interesting and clinically important possibilities to investigate in future studies.
We believe that SD is a more accurate measure of retinal vascular changes because the skeletonized image normalizes the diameter of larger vessels with that of capillaries, removing the influence of vessel size on retinal perfusion measurements.35 Of note, a similar concept to SD was recently investigated in DR patients with skeletonized OCTA images by Agemy et al.34 Our results are in agreement with that study. However, our study used a different OCTA device, different OCTA algorithm, and a different segmentation scheme that includes analysis of nonsegmented OCTA images in addition to segmented images. We investigated additional quantitative parameters (VD, FD, and VDI) to accompany our SD measurements and further characterized the changes in vascular density and morphology with DR. Previous studies using non-OCTA technology have attempted to use similar quantitative indices to evaluate the retinal vasculature, but with conflicting or nonsignificant findings.15–22 Although it is difficult to accurately compare results among these studies because of methodologic differences, the common limitation of these studies remains the use of conventional FA and fundus photos to reconstruct the vasculature for quantitative analysis, thereby largely excluding capillary-level detail.23 The strength of our study was that capillary-level detail was reliably included in our measurements, and the strength of the correlation and repeatability of the findings demonstrated the robustness of these findings.
Our study had a number of limitations. First, our overall sample size was modest and each of the cohorts representing individual stages of DR was small. Therefore, it is difficult to draw definitive conclusions from just this study alone. Nevertheless, our results did confirm and extend previous findings of microvascular changes in DR and also demonstrated the utility of our analysis methods in larger cohorts. Second, a commonly acknowledged technical limitation of OCTA remains the inclusion of projection artifacts, also known as decorrelation tails, particularly in deeper levels of OCTA images.4,34,39 Our methodology was also prone to this error and we avoided making any attempt at correction of the projection tails in this study because any such method would introduce its own inherent confounding effect that is not necessarily smaller in magnitude than the unknown magnitude of the projection artifact for any given image. Third, automated segmentation algorithms are also prone to segmentation errors owing to pathologic changes in the retina that disrupt the proper detection of the anatomic retinal layers. Although this was not a factor in our cohort of diabetic subjects, it must always be considered as a source of error, in which case manual segmentation would be needed to restore the quality of the image. Lastly, our study was a retrospective study with post hoc analyses that are subject to inherent bias. Nevertheless, our study does provide the framework for larger and prospective studies of retinal vascular changes in diabetic retinopathy and other vascular diseases.
The quantification of OCTA data offers a promising new path of study and will likely be useful in the future as an objective marker for progression of retinal disease such as diabetic retinopathy. While conventional methods of categorizing DR severity (e.g., indirect ophthalmoscopy, OCT, FA) remain clinically relevant, they are subjective assessments and may fail to catch small but clinically important changes in the capillary networks that are reliably detected with OCTA and evaluated with these types of quantitative algorithms.
Supplementary Material
Acknowledgments
Carl Zeiss Meditec, Inc. (Dublin, CA, USA) provided the optical coherence tomography angiography system used in this study at the University of Southern California.
Supported by Research To Prevent Blindness and National Eye Institute (R01EY024158).
Disclosure: A.Y. Kim, Carl Zeiss Meditec, Inc. (F); Z. Chu, Carl Zeiss Meditec, Inc. (F); A. Shahidzadeh, Carl Zeiss Meditec, Inc. (F); R.K. Wang, Carl Zeiss Meditec, Inc. (C, F, R), P; C.A. Puliafito, Carl Zeiss Meditec, Inc. (F); A.H. Kashani, Carl Zeiss Meditec, Inc. (C, F, R)
References
- 1. Klein BE. Overview of epidemiologic studies of diabetic retinopathy. Ophthalmic Epidemiol. 2007. ; 14: 179–183. [DOI] [PubMed] [Google Scholar]
- 2. Klein R,, Klein BE,, Moss SE,, Davis MD,, DeMets DL. The Wisconsin epidemiologic study of diabetic retinopathy II: prevalence and risk of diabetic retinopathy when age at diagnosis is less than 30 years. Arch Ophthalmol. 1984; 102: 520–526. [DOI] [PubMed] [Google Scholar]
- 3. Klein R,, Klein BE,, Moss SE,, Davis MD,, DeMets DL. The Wisconsin epidemiologic study of diabetic retinopathy, III: prevalence and risk of diabetic retinopathy when age at diagnosis is 30 or more years. Arch Ophthalmol. 1984; 102: 527–532. [DOI] [PubMed] [Google Scholar]
- 4. Matsunaga D,, Yi J,, Puliafito CA,, Kashani AH. OCT angiography in healthy human subjects. Ophthalmic Surg Lasers Imaging Retina. 2014. ; 45: 510–515. [DOI] [PubMed] [Google Scholar]
- 5. Spaide RF,, Klancnik JM,, Jr,, Cooney MJ. Retinal vascular layers imaged by fluorescein angiography and optical coherence tomography angiography. JAMA Ophthalmol. 2015; 133: 45–50. [DOI] [PubMed] [Google Scholar]
- 6. Teussink MM,, Breukink MB,, van Grinsven MJ,, et al. OCT angiography compared to fluorescein and indocyanine green angiography in chronic central serous chorioretinopathy. Invest Ophthalmol Vis Sci. 2015. ; 56: 5229–5237. [DOI] [PubMed] [Google Scholar]
- 7. Mendis KR,, Balaratnasingam C,, Yu P,, et al. Correlation of histologic and clinical images to determine the diagnostic value of fluorescein angiography for studying retinal capillary detail. Invest Ophthalmol Vis Sci. 2010. ; 51: 5864–5869. [DOI] [PubMed] [Google Scholar]
- 8. Savastano MC,, Lumbroso B,, Rispoli M. In vivo characterization of retinal vascularization morphology using optical coherence tomography angiography. Retina. 2015. ; 35: 2196–2203. [DOI] [PubMed] [Google Scholar]
- 9. de Carlo TE,, Chin AT, BoniniFilho MA,, et al. Detection of microvascular changes in eyes of patients with diabetes but not clinical diabetic retinopathy using optical coherence tomography angiography. Retina. 2015; 35: 2364–2370. [DOI] [PubMed]
- 10. Matsunaga DR,, Yi JJ,, De Koo LO,, Ameri H,, Puliafito CA,, Kashani AH. Optical coherence tomography angiography of diabetic retinopathy in human subjects. Ophthalmic Surg Lasers Imaging Retina. 2015. ; 46: 796–805. [DOI] [PubMed] [Google Scholar]
- 11. Couturier A,, Mane V,, Bonnin S,, et al. Capillary plexus anomalies in diabetic retinopathy on optical coherence tomography angiography. Retina. 2015. ; 35: 2384–2391. [DOI] [PubMed] [Google Scholar]
- 12. Ishibazawa A,, Nagaoka T,, Takahashi A,, et al. Optical coherence tomography angiography in diabetic retinopathy: a prospective pilot study. Am J Ophthalmol. 2015. ; 160: 35–44. e31. [DOI] [PubMed] [Google Scholar]
- 13. Hwang TS,, Jia Y,, Gao SS,, et al. Optical coherence tomography angiography features of diabetic retinopathy. Retina. 2015. ; 35: 2371–2376. [DOI] [PMC free article] [PubMed] [Google Scholar]
- 14. Kashani AH,, Lee SY,, Moshfeghi A,, Durbin MK,, Puliafito CA. Optical coherence tomography angiography of retinal venous occlusion. Retina. 2015. ; 35: 2323–2331. [DOI] [PubMed] [Google Scholar]
- 15. Parsons-Wingerter P,, Radhakrishnan K,, Vickerman MB,, Kaiser PK. Oscillation of angiogenesis with vascular dropout in diabetic retinopathy by VESsel GENeration analysis (VESGEN). Invest Ophthalmol Vis Sci. 2010. ; 51: 498–507. [DOI] [PMC free article] [PubMed] [Google Scholar]
- 16. Grauslund J,, Green A,, Kawasaki R,, Hodgson L,, Sjolie AK,, Wong TY. Retinal vascular fractals and microvascular and macrovascular complications in type 1 diabetes. Ophthalmology. 2010. ; 117: 1400–1405. [DOI] [PubMed] [Google Scholar]
- 17. Avakian A,, Kalina RE,, Sage EH,, et al. Fractal analysis of region-based vascular change in the normal and non-proliferative diabetic retina. Curr Eye Res. 2002. ; 24: 274–280. [DOI] [PubMed] [Google Scholar]
- 18. Cheung N,, Donaghue KC,, Liew G,, et al. Quantitative assessment of early diabetic retinopathy using fractal analysis. Diabetes Care. 2009. ; 32: 106–110. [DOI] [PMC free article] [PubMed] [Google Scholar]
- 19. Kunicki AC,, Oliveira AJ,, Mendonca MB,, Barbosa CT,, Nogueira RA. Can the fractal dimension be applied for the early diagnosis of non-proliferative diabetic retinopathy? Braz J Med Biol Res. 2009. ; 42: 930–934. [DOI] [PubMed] [Google Scholar]
- 20. Cheung CY,, Lamoureux E,, Ikram MK,, et al. Retinal vascular geometry in Asian persons with diabetes and retinopathy. J Diabetes Sci Technol. 2012. ; 6: 595–605. [DOI] [PMC free article] [PubMed] [Google Scholar]
- 21. Yau JW,, Kawasaki R,, Islam FM,, et al. Retinal fractal dimension is increased in persons with diabetes but not impaired glucose metabolism: the Australian Diabetes, Obesity and Lifestyle (AusDiab) study. Diabetologia. 2010. ; 53: 2042–2045. [DOI] [PubMed] [Google Scholar]
- 22. Lim SW,, Cheung N,, Wang JJ,, et al. Retinal vascular fractal dimension and risk of early diabetic retinopathy: a prospective study of children and adolescents with type 1 diabetes. Diabetes Care. 2009; 32: 2081–2083. [DOI] [PMC free article] [PubMed] [Google Scholar]
- 23. Cheng SC,, Huang YM. A novel approach to diagnose diabetes based on the fractal characteristics of retinal images. IEEE Trans Inf Technol Biomed. 2003. ; 7: 163–170. [DOI] [PubMed] [Google Scholar]
- 24. Yu J,, Jiang C,, Wang X,, et al. Macular perfusion in healthy Chinese: an optical coherence tomography angiogram study. Invest Ophthalmol Vis Sci. 2015. ; 56: 3212–3217. [DOI] [PMC free article] [PubMed] [Google Scholar]
- 25. Jia Y,, Morrison JC,, Tokayer J,, et al. Quantitative OCT angiography of optic nerve head blood flow. Biomed Opt Express. 2012. ; 3: 3127–3137. [DOI] [PMC free article] [PubMed] [Google Scholar]
- 26. Jia Y,, Bailey ST,, Wilson DJ,, et al. Quantitative optical coherence tomography angiography of choroidal neovascularization in age-related macular degeneration. Ophthalmology. 2014. ; 121: 1435–1444. [DOI] [PMC free article] [PubMed] [Google Scholar]
- 27. Jia Y,, Bailey ST,, Hwang TS,, et al. Quantitative optical coherence tomography angiography of vascular abnormalities in the living human eye. Proc Natl Acad Sci U S A. 2015; 112: E2395–E2402. [DOI] [PMC free article] [PubMed] [Google Scholar]
- 28. Kuehlewein L,, Sadda SR,, Sarraf D. OCT angiography and sequential quantitative analysis of type 2 neovascularization after ranibizumab therapy. Eye (Lond). 2015. ; 29: 932–935. [DOI] [PMC free article] [PubMed] [Google Scholar]
- 29. Coscas G,, Lupidi M,, Coscas F,, Francais C,, Cagini C,, Souied EH. Optical coherence tomography angiography during follow-up: qualitative and quantitative analysis of mixed type I and II choroidal neovascularization after vascular endothelial growth factor trap therapy. Ophthalmic Res. 2015. ; 54: 57–63. [DOI] [PubMed] [Google Scholar]
- 30. Takase N,, Nozaki M,, Kato A,, Ozeki H,, Yoshida M,, Ogura Y. Enlargement of foveal avascular zone in diabetic eyes evaluated by en face optical coherence tomography angiography. Retina. 2015. ; 35: 2377–2383. [DOI] [PubMed] [Google Scholar]
- 31. Di G,, Weihong Y,, Xiao Z,, et al. A morphological study of the foveal avascular zone in patients with diabetes mellitus using optical coherence tomography angiography [published online ahead of print September 7, 2015]. Graefes Arch Clin Exp Ophthalmol. doi:http://dx.doi.org/10.1007/s00417-015-3143-7. [DOI] [PubMed]
- 32. Freiberg FJ,, Pfau M,, Wons J,, Wirth MA,, Becker MD,, Michels S. Optical coherence tomography angiography of the foveal avascular zone in diabetic retinopathy [published online ahead of print September 4 2015]. Graefes Arch Clin Exp Ophthalmol. doi:http://dx.doi.org/10.1007/s00417-015-3148-2. [DOI] [PMC free article] [PubMed]
- 33. Hwang TS,, Gao SS,, Liu L,, et al. Automated quantification of capillary nonperfusion using optical coherence tomography angiography in diabetic retinopathy. JAMA Ophthalmol. 2016: 1–7. [DOI] [PMC free article] [PubMed]
- 34. Agemy SA,, Scripsema NK,, Shah CM,, et al. Retinal vascular perfusion density mapping using optical coherence tomography angiography in normals and diabetic retinopathy patients. Retina. 2015. ; 35: 2353–2363. [DOI] [PubMed] [Google Scholar]
- 35. Reif R,, Qin J,, An L,, Zhi Z,, Dziennis S,, Wang R. Quantifying optical microangiography images obtained from a spectral domain optical coherence tomography system. Int J Biomed Imaging. 2012. ; 2012: 509783. [DOI] [PMC free article] [PubMed] [Google Scholar]
- 36. Grading diabetic retinopathy from stereoscopic color fundus photographs—an extension of the modified Airlie House classification: ETDRS report number 10: Early Treatment Diabetic Retinopathy Study Research Group. Ophthalmology. 1991; 98: 786–806. [PubMed] [Google Scholar]
- 37. Classification of diabetic retinopathy from fluorescein angiograms: ETDRS report number 11: Early Treatment Diabetic Retinopathy Study Research Group. Ophthalmology. 1991; 98: 807–822. [PubMed] [Google Scholar]
- 38. Tan PE,, Yu PK,, Balaratnasingam C,, et al. Quantitative confocal imaging of the retinal microvasculature in the human retina. Invest Ophthalmol Vis Sci. 2012. ; 53: 5728–5736. [DOI] [PubMed] [Google Scholar]
- 39. Jia Y,, Tan O,, Tokayer J,, et al. Split-spectrum amplitude-decorrelation angiography with optical coherence tomography. Opt Express. 2012. ; 20: 4710–4725. [DOI] [PMC free article] [PubMed] [Google Scholar]
- 40. Zhang A,, Zhang Q,, Wang RK. Minimizing projection artifacts for accurate presentation of choroidal neovascularization in OCT micro-angiography. Biomed Opt Express. 2015. ; 6: 4130–4143. [DOI] [PMC free article] [PubMed] [Google Scholar]
- 41. Wiley HE,, Ferris FL,, III. Nonproliferative diabetic retinopathy and diabetic macular edema. : SJSS Ryan,, Hinton DR, Retina. London: Elsevier Saunders; 2013: 940–968. [Google Scholar]
- 42. Wilkinson CP,, Ferris FL,, III, Klein RE,, et al. Proposed international clinical diabetic retinopathy and diabetic macular edema disease severity scales. Ophthalmology. 2003; 110: 1677–1682. [DOI] [PubMed] [Google Scholar]
- 43. Murakami T,, Yoshimura N. Structural changes in individual retinal layers in diabetic macular edema. J Diabetes Res. 2013. ; 2013: 920713. [DOI] [PMC free article] [PubMed] [Google Scholar]
- 44. Otani T,, Kishi S. Correlation between optical coherence tomography and fluorescein angiography findings in diabetic macular edema. Ophthalmology. 2007. ; 114: 104–107. [DOI] [PubMed] [Google Scholar]
- 45. Bolz M,, Ritter M,, Schneider M,, Simader C,, Scholda C,, Schmidt-Erfurth U. A systematic correlation of angiography and high-resolution optical coherence tomography in diabetic macular edema. Ophthalmology. 2009. ; 116: 66–72. [DOI] [PubMed] [Google Scholar]
Associated Data
This section collects any data citations, data availability statements, or supplementary materials included in this article.


