Abstract
Purpose
To compare optical coherence tomography (OCT) detected, optic nerve head (ONH) compliance within control and experimental glaucoma (EG) eyes of 15 monkeys at EG onset.
Methods
Intraocular pressure (IOP) was chronically elevated in one eye of each animal using a laser. Experimental glaucoma onset was identified using confocal scanning laser tomography (CSLT). Optical coherence tomography ONH imaging (40 radial B-scans) was performed at 10 mm Hg before and after laser. At EG onset, OCT scans were obtained at IOP 10 and 30 mm Hg. Optical coherence tomography landmarks within the IOP 10/30 images were delineated to quantify IOP 10/30 differences (compliance) for anterior lamina cribrosa surface depth (ALCSD) relative to Bruch's membrane opening (BMO) (ALCSD-BMO), ALCSD relative to peripheral BM (ALCSD-BM), and BMO depth relative to peripheral BM (BMOD-BM). A linear mixed effects model assessed for acute IOP elevation effects, control versus EG eye effects, and their interaction
Results
Effects of IOP elevation were greater in EG versus control eyes for ALCSD-BMO (−46 ± 45 vs. −8 ± 13 μm, P = 0.0042) and ALCSD-BM (−92 ± 64 vs. −42 ± 22 μm, P = 0.0075). Experimental glaucoma eye-specific ALCSD-BMO and ALCSD-BM compliance exceeded the range of control eye compliance in 9 and 8 of the 15 EG eyes, respectively. Post-laser peak IOP (R2 = 0.798, P < 0.0001) and post-laser mean IOP (R2 = 0.634, P < 0.0004) most strongly correlated to EG versus control eye differences in ALCSD-BMO compliance.
Conclusions
Laminar (ALCSD-BMO) and peripapillary scleral (ALCSD-BM) hypercompliance are present in most monkey eyes at the onset of EG.
Keywords: glaucoma, optic nerve head, lamina cribrosa, sclera, optical coherence tomography, hypercompliance
Axonal damage in glaucoma is believed to occur within the optic nerve head (ONH) at the level of the lamina cribrosa, a sieve-like connective tissue structure composed of capillary-containing collagen beams enmeshed within an astrocyte syncytium through which the retinal ganglion cell (RGC) axons pass.1,2 From a biomechanical standpoint, the ONH neural and connective tissues experience IOP-related stress and strain at all levels of IOP.3,4 Depending on the anatomy and material properties of the load-bearing connective tissues, IOP-related stress and strain can be substantial at normal levels of IOP,5 and increase in all eyes if IOP becomes elevated.6,7
How a given ONH responds to the level of IOP it experiences, and separately to acute IOP elevations, depends not just on the level of IOP or the magnitude of IOP elevation, but also the geometry and material properties (structural stiffness) of the lamina cribrosa and peripapillary sclera as well as cerebral spinal fluid pressure, retrolaminar tissue pressure, translaminar pressure gradient, and orbital tissue pressure.3,4 A growing body of experimental8,9 and theoretical work6,7 supports the concept of a laminar-scleral dynamic in which the net compliance or rigidity of the sclera exerts a large influence over the magnitude of lamina cribrosa deformation at all levels of IOP. Although a previous study of ONH surface deformation in dogs suggested substantial ONH surface movement with acute IOP elevation,10 several studies in which laminar deformation was measured directly suggest little posterior laminar deformation follows acute IOP elevation in healthy monkey9,11,12 and human eyes.13 Although surprising, this finding may be due, in part, to scleral canal expansion, which pulls the lamina taut within the scleral canal, counteracting forces that act to deform the lamina in a posterior or outward direction.8 Nevertheless, this finding does not rule out that in the setting of minimal posterior laminar deformation, there can still be anterior laminar deformation and/or elongation within an expanded scleral canal,8 with resultant strain on basement membranes of laminar beam astrocytes.
We have previously used simultaneous videography,14,15 confocal scanning laser tomography (CSLT) ONH surface imaging,16 postmortem histology,8,11 and three-dimensional (3D) histomorphometric reconstruction9,17 to study ONH compliance in response to acute IOP elevation in normal and glaucomatous monkey eyes. These studies indirectly suggested laminar and peripapillary scleral hypercompliance were present at the onset of monkey experimental glaucoma (EG); however, each study was either not specific to the lamina cribrosa,14–16 or was postmortem and therefore could not separate “fixed deformation” from “acute compliance” within each individual study eye.11,17 More recently, we have used optical coherence tomography (OCT) to characterize ONH neural and connective tissue compliance in normal monkey eyes.12 In these studies and in all forms of mechanical testing, “compliance” is defined to be the magnitude of deformation demonstrated by a tissue or structure in response to a given load. However, “compliance” also can refer to the actual structural stiffness of a tissue or object (i.e., the combination of its geometry and material properties that together determine its “elasticity” or “deformability”). To clarify our previous and current use of this term, OCT compliance testing detects tissue deformation, not structural stiffness.
In the present study, we define ONH compliance to be the magnitude of OCT-detected ONH neural and connective tissue deformation following acute IOP elevations of fixed magnitude (IOP 10 to 30 mm Hg) and duration (30 minutes). The primary purpose was to use in vivo OCT imaging to compare EG versus control eye ONH morphology change following acute IOP elevation from 10 to 30 mm Hg in both eyes of 15 monkeys at the onset of unilateral EG (EG onset). Our hypothesis was that most animals would demonstrate greater acute posterior deformation of the lamina cribrosa and peripapillary sclera within the EG eye as compared with the contralateral control eye, and in so doing, provide direct evidence for laminar and peripapillary hypercompliance in early monkey EG.14 Using in vivo OCT ONH imaging to detect ONH connective tissue hypercompliance at the onset of monkey EG is important for two reasons. First, it is a likely manifestation of underlying ONH connective tissue remodeling, failed remodeling, or mechanical failure,18 which suggests that it may be a biomarker for the presence of these processes and therefore a means of identifying underlying mechanisms and treatment interventions in future studies. Second, if present and detectable in human ocular hypertensive patients, it may be evidence of an early connective tissue response to the level of mechanical stress and strain they are experiencing, which precedes and/or predicts subsequent RGC injury and loss. In this context, it might represent a “structural” precursor not only to “functional” loss, but also to clinically significant “structural” involvement of the neural tissues.
Methods
Abbreviations
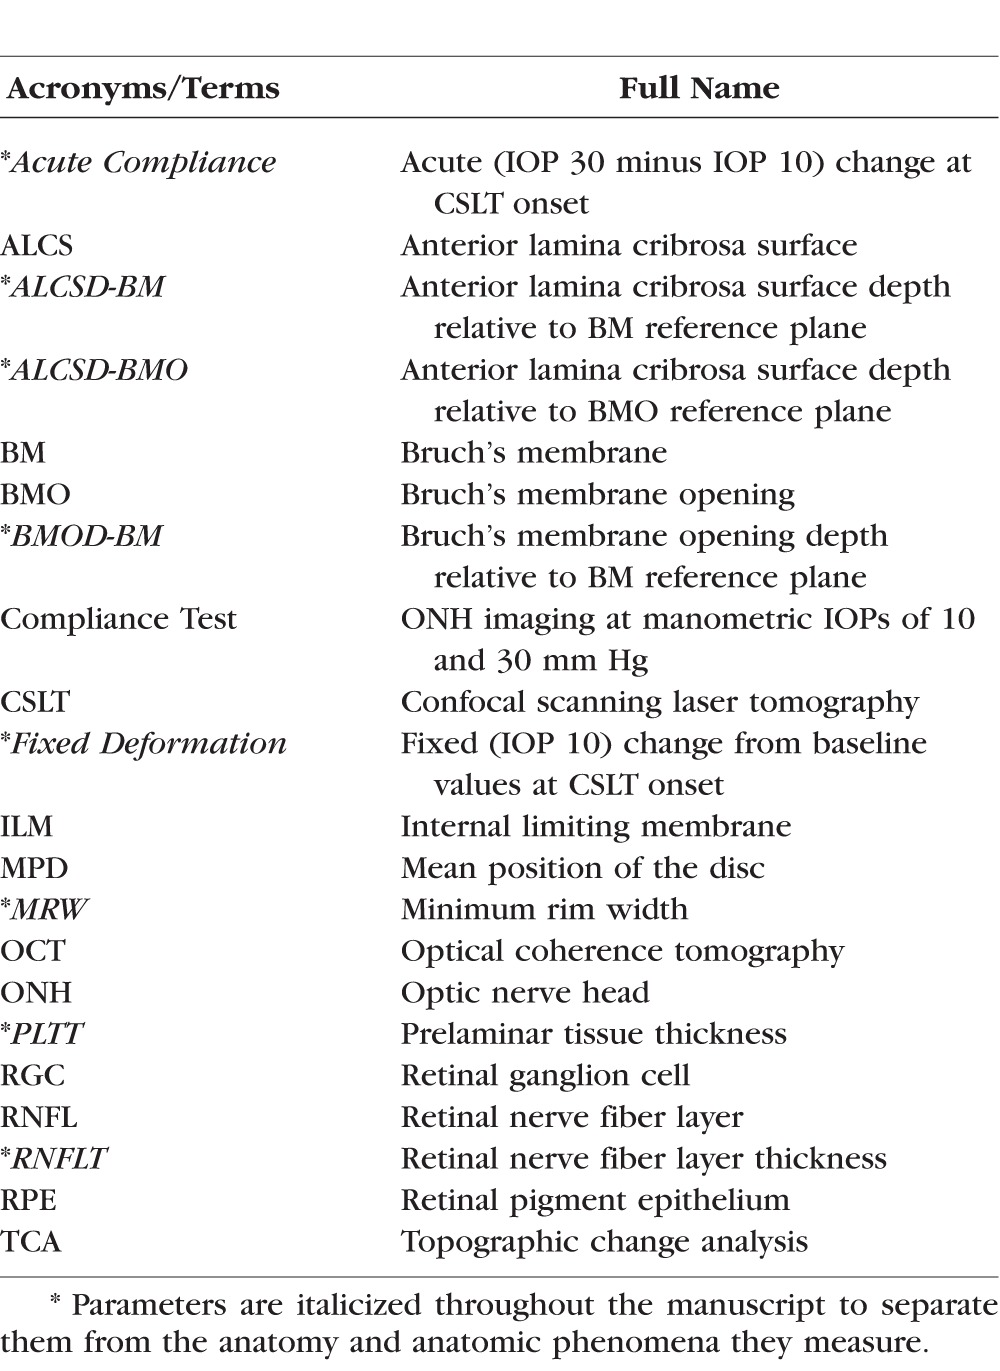
Table 1 defines all acronyms and a subset of common terms used in this report. Parameters are italicized throughout the manuscript to separate them from the anatomy and anatomic phenomena they measure.
Table 1.
List of the Abbreviations and the Corresponding Full Names of Anatomical Terms and Instruments
Animals
We studied 15 rhesus macaque monkeys (Macaca mulatta) in strict accordance with the Guide for the Care and Use of Laboratory Animals of the National Institutes of Health. All experimental methods and animal care procedures adhered to the ARVO Statement for the Use of Animals in Ophthalmic and Vision Research and were approved and monitored by the Institutional Animal Care and Use Committee at Legacy Health (US Department of Agriculture license 92-R-0002 and OLAW assurance A3234-01).
Experimental Design
Both eyes of each animal underwent IOP 10 (mm Hg, see Methods) CSLT and OCT ONH imaging (see below) on at least three occasions at baseline (pre-laser). One eye of each monkey was then randomly assigned to EG and thus received 180° of argon laser photocoagulation to the trabecular meshwork to induce chronic IOP elevation.19,20 A second 180° treatment was performed 2 weeks later. Post-laser imaging sessions in both the lasered (hereafter referred to as the EG) eye and contralateral control eye continued in 1- to 3-week intervals. Laser photocoagulation was repeated in additional 90° increments as necessary to achieve and/or maintain IOP elevation.
All animals were followed through the onset of CSLT-detected ONH surface topography change confirmed on two subsequent occasions in the EG eye20 and then to various endpoints beyond onset as part of their primary studies. For the present report, although IOP 10 imaging was performed in each animal at each baseline and post-laser imaging session, Acute Compliance testing (IOP 10/30 mm Hg) (see below) was implemented after most of the primary study protocols were beyond baseline testing. Only those animals that had acute compliance testing on the second confirmation of EG onset (within the IOP 10 data sets) were selected for this study. EG versus control eye differences in Acute Compliance at the second confirmation of EG onset is the primary outcome of this report.
Intraocular Pressure 10 (mm Hg) Imaging Protocol
Animals were anesthetized with 15 mg/kg intramuscular ketamine and 0.2 mg/kg midazolam followed by a 0.05 mg/kg subcutaneous bolus of atropine sulphate, then intubated and maintained on 100% oxygen and 1% to 2% isoflurane gas.16,21 Vital signs were monitored and maintained within normal ranges. Intravenous lactated Ringer's solution or 6% Hetastarch was administered to maintain blood pressure if ever mean arterial pressure fell below 65 mm Hg. One drop of topical 0.5% proparacaine was applied to each eye before a lid speculum was placed. Intraocular pressure was measured three times by Tonopen (Tonopen XL; Reichert, Inc., Depew, NY, USA). Pupils were then dilated with 0.5% tropicamide and 2.5% phenylephrine before a plano rigid contact lens was placed on each eye with topical lubricant (0.5% carboxymethylcellulose sodium; Allergan, Inc., Irvine, CA, USA) to keep the cornea moistened during each experiment. To reduce the “acutely reversible” component of ONH tissue deformation caused by elevated ambient IOP in EG eyes, a 27-gauge cannula connected to a manometer was inserted through the temporal cornea into the anterior chamber of both eyes. Intraocular pressure was set at 10 mm Hg and held constant for 30 minutes. Optic nerve head surface topography was measured by CSLT using a Heidelberg Retina Tomograph II (HRT II; Heidelberg Engineering GmbH, Heidelberg, Germany).22,23 A minimum of three individual scans were acquired at each imaging session and averaged to create a mean topography for each eye.16 Eighty standard, enhanced depth imaging, 870-nm OCT (Spectralis Spectral-Domain OCT; Heidelberg Engineering, GmbH) radial B-scans were acquired over a 15° area (768 A-scans per B-scan, n = 9 repetitions). All repetitive scans were acquired using eye tracking (Spectralis Manual) and averaged to reduce speckle noise. For each monkey eye, the center of the ONH was estimated and registered during the first imaging session. The Spectralis eye-tracking algorithm was used to align all follow-up images to the baseline set in real time. Image quality scores of all included HRT II scans were at least 80% and image quality scores of all included Spectralis OCT scans were at least 15 dB.
Acute Compliance (IOP 10/30) Imaging Protocol
During the second EG onset confirmation imaging session, after the IOP 10 data sets had been acquired (see above) IOP was manometrically elevated to 30 mm Hg for 30 minutes and OCT imaging was repeated.
Experimental Glaucoma Onset Detected by CSLT
The disc margin was outlined within the baseline CSLT image of each eye and automatically transferred to all subsequent images in the longitudinal series. The parameter mean position of the disc (MPD)22 was calculated for each IOP 10 imaging session and defined as the height of the surface of the ONH (i.e., average height of all pixels located within the disc margin contour line) relative to the height of a standard reference plane (a plane that runs parallel to the peripapillary retinal surface and is set 50 μm below the retinal surface height at the papillomacular bundle, which is located in the −10° to −4° section temporal of the contour line; HRT II Operating Instructions; software version 1.6). Onset of MPD was defined as the first post-laser session in which the MPD value was below the eye-specific 95% limits-of-agreement (LOA) for test-retest repeatability determined by the baseline testing sessions, and was also outside of the baseline LOA in the two subsequent imaging sessions.
Tomographic change analysis (TCA) is a native change-detection algorithm embedded within the HRT II software package.23,24 Onset of TCA was independently evaluated in each eye by two experienced investigators (CFB and BF)25 masked to treatment condition (EG versus control) reading the TCA maps retrospectively. Change onset of TCA was qualitatively defined as the first image showing ONH surface change exceeding baseline variability that was confirmed in the two subsequent sessions. In practice, each investigator sought the first post-laser imaging session in which the number of superpixels demonstrating posterior TCA change exceeded the number and location of red TCA superpixels within the n = 5 baseline imaging days. Change onset of TCA at a given post-laser imaging session required a clinician to see similar TCA change in the two subsequent sessions. The magnitude of TCA change (i.e., the depth of change at each superpixel) was not included in this determination. Where necessary, interobserver differences in TCA onset were adjudicated by the two readers through discussion. For this study, EG onset was determined by CSLT change onset either with the MPD or TCA metric, whichever occurred earliest. Monkeys were euthanized within 1 to 93 weeks after EG onset, as required by their primary studies. Axon counts at the time of EG onset (the target of this study) were therefore not available for most eyes and are therefore not reported.
Pre- and Post-Laser IOP Characterization
Baseline and Post-Laser Mean IOP were calculated for each eye as the mean of all baseline or post-laser IOP measurements. Post-Laser Peak IOP was defined to be the maximum, post-laser IOP recorded for each eye. Post-Laser Cumulative IOP Exposure was calculated for each eye as the IOP at each post-laser measurement, multiplied by the number of days from the last to the current IOP measurement, summed over the period of post-laser follow-up (expressed in units of mm Hg × day). Experimental glaucoma eye Post-Laser Cumulative IOP Difference was calculated as the EG versus control eye difference in Post-Laser Cumulative IOP Exposure on the pre-sacrifice day of imaging (last OCT imaging under manometric IOP control prior to sacrifice).
Optical Coherence Tomography Data Set Delineation and Parameterization
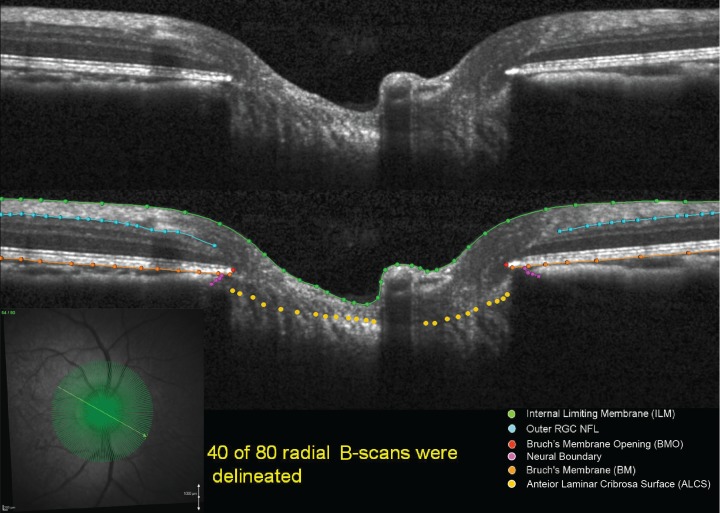
Customized “Multiview” software (built on the Visualization Toolkit [VTK] Kitware, Inc., Clifton Park, NY, USA) was used to delineate a standard set of anatomic features within 40 of the 80 radial B-scans (every other scan) of each OCT data set by two trained technicians who were masked to the treatment condition (EG or control), timing (baseline or post-laser session), and condition (IOP 10 or 30) of the OCT volume as previously described (Figs. 1, 2).26–28
Figure 1.
Original and delineated OCT ONH data sets in a normal monkey eye. Green lines/points: ILM; blue lines/points: outer boundary of the RNFL; orange lines/points: BM/RPE; red points: BMO; purple points: neural boundary; yellow points: ALCS. One of two B-scans was delineated and thus yielded 40 delineated data sets for each monkey eye at a time.
Figure 2.
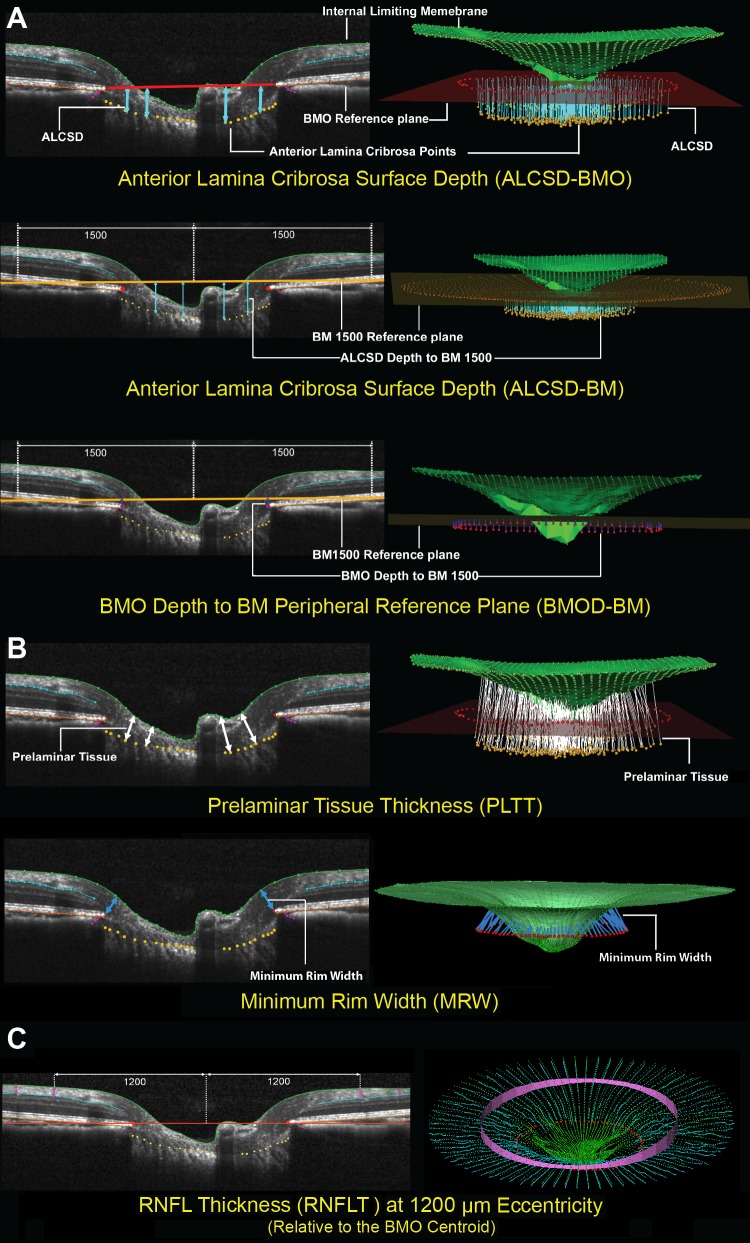
Optical coherence tomography neural and connective tissue parameters. (A) Optic nerve head connective tissues. Optical coherence tomography ONH connective tissue parameters are designed to detect connective tissue deformation (reversible) and/or remodeling (permanent). Anterior lamina cribrosa surface depth (blue arrows) is measured at each delineated ALCS point as the perpendicular distance from the BMO reference plane (red line) and BM reference plane (orange line) defined by two delineated BM points at 1500 μm eccentricity from the BMO centroid. Depth of BMO is measured at each delineated BMO point as the perpendicular distance from the BM reference plane (orange line). (B) Optic nerve head neural tissues. Neural tissue parameters are designed to detect neural tissue changes that occur either due to neural tissue damage or secondary to connective tissue deformation. Prelaminar tissue thickness is measured as the normal from the tangent to the ALCS to the ILM (green line). Minimum rim width (blue arrows) is measured at each delineated BMO point (red) as the minimum distance to ILM. (C) Nonstandard peripapillary RNFL. Retinal nerve fiber layer thickness is measured on either side of the posterior RNFL boundary (turquoise line) at ILM points that are 1200 μm from the centroid of the 80 delineated BMO points (the BMO centroid).
For the internal limiting membrane (ILM), posterior boundary of the retinal nerve fiber layer (RNFL), posterior boundary of Bruch's membrane (BM)/retinal pigment epithelium (RPE) complex, and neural boundary categories, each layer was delineated using discrete points interconnected by a Bézier curve. The position of each point in each category was finely adjusted so that the fitted Bézier curve matched the feature of interest as closely as possible. Bruch's membrane opening (BMO) was delineated using two discrete points at either side of the neural canal. The anterior lamina cribrosa surface (ALCS) was delineated based on our previous direct comparisons between OCT B-scans and matched histologic sections,26 as well as our previous publications on OCT laminar visualization28 and longitudinal change detection.21,29 For each OCT B-scan data set, a point cloud including all of the above landmarks was generated (Fig. 2). Because the Spectralis x,y transverse dimension is calibrated for human eyes, a scaling factor of 0.857 was used to correct for ocular magnification differences in the average adult rhesus monkey eye as previously described.29
To parameterize each OCT ONH data set, two reference planes were used: a BMO reference plane based on the best-fitting ellipse through the 80 delineated BMO points in a 3D space (2 points/B-scan × 40 B-scans), and a BM reference plane based on the best-fitting ellipse through the BM/RPE complex points located at a 1500-μm radius from the BMO centroid along the BMO plane. Six parameters from OCT ONH radial scans were calculated and empirically categorized into ONH connective tissue, ONH neural tissue, and peripapillary RNFL groups as shown in Figure 2.
Optic nerve head connective tissue parameters (Fig. 2A) included anterior laminar cribrosa surface depth (ALCSD) relative to BMO reference plane (ALCSD-BMO), ALCSD relative to BM reference plane (ALCSD-BM), and BMO depth relative to the BM reference plane (BMOD-BM). The two reference planes were used to define change that resulted from laminar deformation alone (BMO reference plane) and change that included both laminar and peripapillary scleral deformation (BM reference plane). Optical nerve head neural tissue parameters (Fig. 2B) included prelaminar tissue thickness (PLTT) and minimum rim width (MRW).21,29–31 The RNFL parameter (Fig. 2C) included the thickness calculated at an eccentricity of 1200 μm from the BMO centroid (RNFLT).
Fixed Deformation at EG Onset Values for Each Parameter
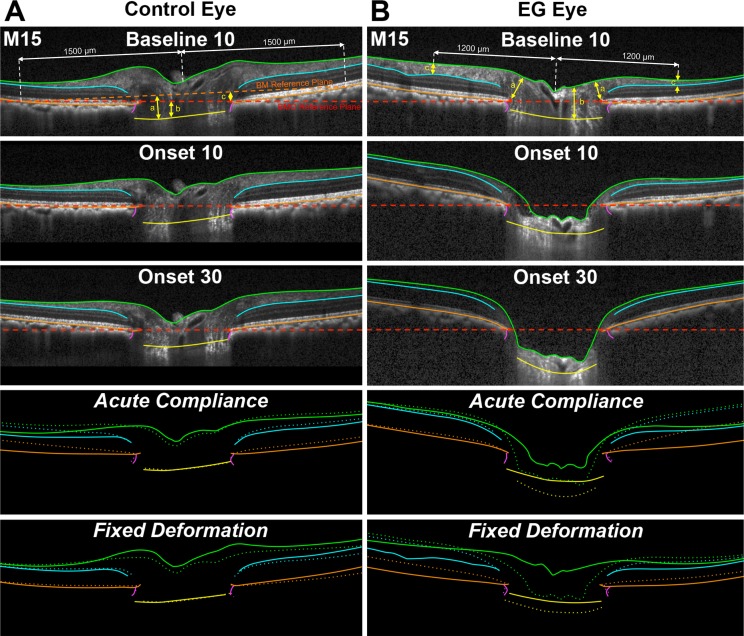
For both eyes of each animal, the magnitude of Fixed Deformation at EG onset for each parameter was calculated as the IOP 10 data set value at EG onset minus the IOP 10 data set value at the last baseline imaging session (Fig. 3).
Figure 3.
Representative B-scans from Control and EG eyes of Monkey 15, with ONH and retinal anatomy delineated at baseline at 10 mm Hg and at CSLT-detected EG onset at IOP 10 and 30 mm Hg showing Fixed Deformation and Acute Compliance at EG onset. Green lines: ILM; blue lines: outer boundary of the RNFL; orange lines: BM/RPE; red points: BMO; purple lines: Neural Boundary; yellow points: ALCS. Dotted lines represent Fixed Deformation and Acute Compliance at EG onset. (A) Connective tissue parameters: (a) ALCSD-BM, (b) ALCSD-BMO, and (c) BMOD-BM. (B) Neural tissue parameters: (a) MRW, (b) PLTT, and (c) RNFLT. A substantially larger Acute Compliance and Fixed Deformation can be seen in the EG eye at EG onset compared with the fellow control eye. Comparisons in bottom four panels were aligned in reference to BMO.
Acute Compliance (IOP 10/30) Values for Each Parameter at EG Onset
For both eyes of each animal the Acute Compliance value was determined for each parameter at EG onset as the value within the IOP 30 data set minus the value within the IOP 10 data set (Fig. 3). EG versus control eye Acute Compliance Difference at Onset was then calculated for each parameter and each EG eye. The experiment-wide control eye range in Acute Compliance for each parameter was then calculated from the n = 15 control eye values. Eye-specific EG eye hypercompliance was defined to be present for a parameter when the Acute Compliance of an individual EG eye was more negative than the maximum value of control eye Acute Compliance, as outlined above. An eye-specific decrease in EG eye compliance was defined to be present for a given parameter when the Acute Compliance value of that parameter was less negative than the minimum value of control eye Acute Compliance.
Statistical Analysis
Analyses were performed using R software (R Foundation for Statistical Computing, Vienna, Austria). The magnitude and significance of Fixed Deformation at EG onset within the control and EG eyes were assessed for each parameter within a linear mixed effects model in which EG versus control eye differences were assessed within the interaction of Eye Condition (EG versus control) and Time (baseline versus EG onset). The magnitude and significance of Acute Compliance at EG onset effects within the control and EG eyes were assessed for each parameter within a linear mixed effects model in which EG versus control eye differences were assessed within the interaction of Eye Condition (EG versus control) and IOP (IOP 10 versus IOP 30 mm Hg). In each analysis, a significant interaction was taken as evidence of an EG versus control eye difference in Fixed Deformation or Acute Compliance at EG onset.
Four groups of linear regression analyses were then performed. Within each group, correlations achieving P ≤ 0.05 were considered significant. First, we assessed whether Fixed Deformation at EG onset in each OCT parameter was correlated with each post-laser IOP insult parameter. Second, we assessed whether Acute Compliance at EG onset in each OCT parameter was correlated with each post-laser IOP insult parameter. Third, we assessed whether EG versus control eye differences in each post-laser IOP insult parameter were correlated to EG versus control eye differences in Acute Compliance at EG onset for each OCT parameter. Fourth, we assessed whether control versus EG eye Acute Compliance at EG onset for each OCT parameter were correlated.
Results
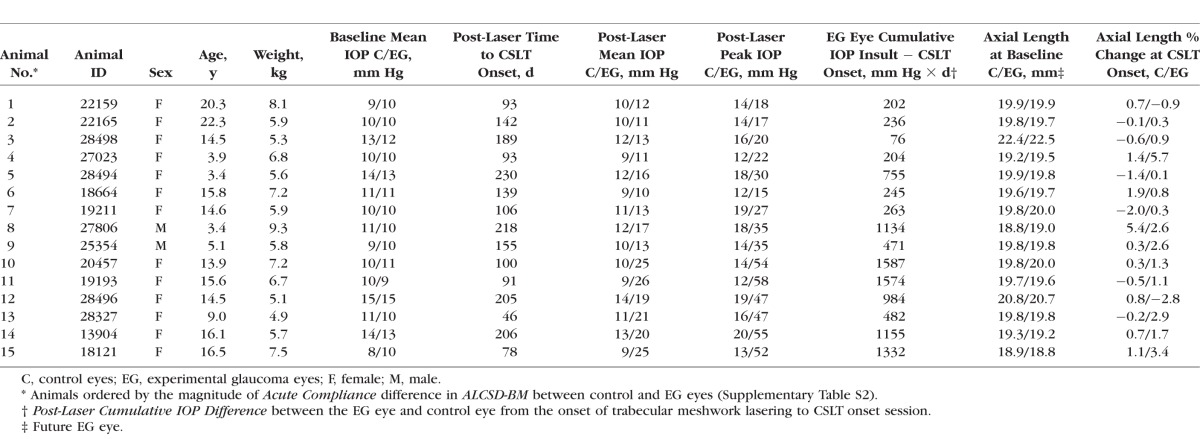
A total of 15 (age 3.4–22.3 years) rhesus monkeys (2 male, 13 female) were studied (Table 2). Animal order in Table 2 was based on the magnitude of EG versus control eye Acute Compliance difference in the parameter ALCSD-BM (Fig. 2). The range of Post-Laser Mean IOP was 10 to 25 mm Hg in the EG eyes and 9 to 14 mm Hg in the control eyes. Post-Laser Peak IOP ranged from 15 to 58 mm Hg in the EG eyes and 12 to 20 mm Hg in the control eyes. Post-Laser Cumulative IOP Difference ranged from 76 to 1587 mm Hg × days at CSLT-detected EG onset. Post-laser time to EG onset ranged from 46 to 230 days with a mean of 139 days. Axial length at baseline ranged from 18.8 to 22.4 mm (mean ± SD: 19.8 ± 0.9 mm) and 18.8 to 22.5 mm (mean ± SD: 19.9 ± 0.9 mm) (P = 0.368, two-tailed, paired t-test) in control and future EG eyes, respectively. Experimental glaucoma eye axial length at EG onset (20.11 ± 0.80 mm) was significantly larger than at baseline (19.86 ± 0.86 mm) (P = 0.025), whereas control eye axial length at EG onset (19.92 ± 0.76 mm) was not significantly different from baseline (19.83 ± 0.84 mm) (P = 0.27). Axial length change from baseline at EG onset ranged from −2.0% to 5.4% (mean ± SD: 0.5% ± 1.7%) and −2.8% to 5.7% (mean ± SD: 1.3% ± 2.0%) in control and EG eyes, respectively.
Table 2.
Demographic, Ocular Biometric, and IOP Parameters for Each Study Animal
Fixed Deformation at EG Onset
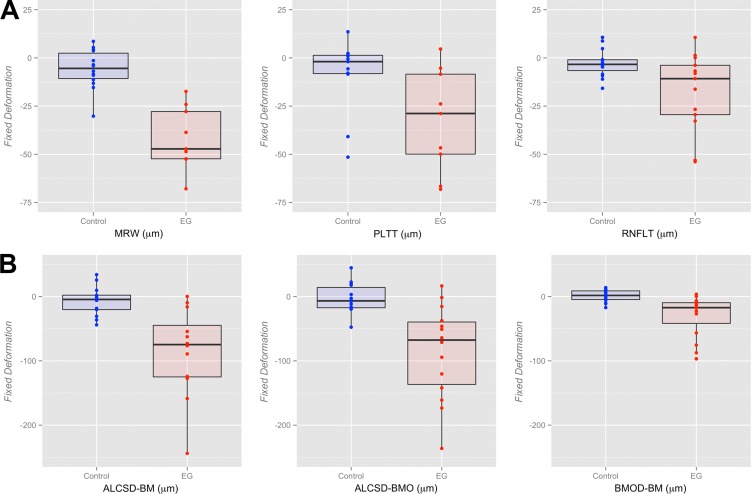
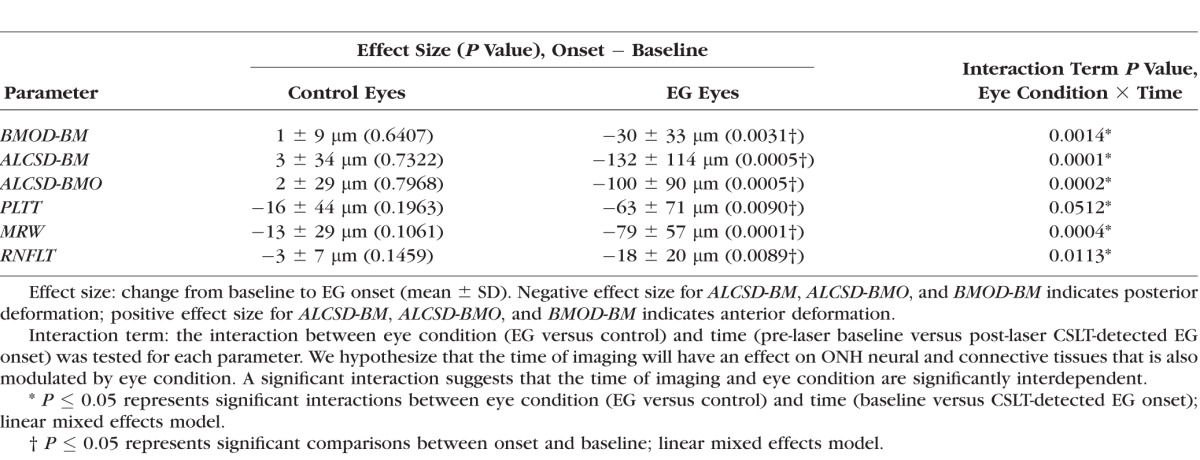
The magnitude of Fixed Deformation at EG onset for both the control and EG eye of each animal is reported for all parameters in Supplementary Table S1 and plotted in Figure 4. Linear mixed effects modeling (Table 3) demonstrated a statistically significant degree of Fixed Deformation for all parameters in EG eyes (P ≤ 0.05), without demonstrating evidence of significant Fixed Deformation for any parameter being present within the control eyes (P > 0.05) compared with their baseline. The effect of the interaction between eye condition (EG versus control) and time point (baseline versus EG onset) on Fixed Deformation at EG onset was statistically significant for all parameters (P ≤ 0.05).
Figure 4.
Box plots representing the distributions (median, interquartile range, and extremes) of EG (red) and Control (blue) eye Fixed Deformation at EG onset for all OCT (A) neural and (B) connective tissue parameters. The scale extends from −75 to 25 μm across all (A) neural tissue parameters and from −250 to 50 μm across all (B) connective tissue parameters.
Table 3.
The Magnitude of Experiment-Wide Fixed Deformation at EG Onset Across all Animals
Acute Compliance at EG Onset
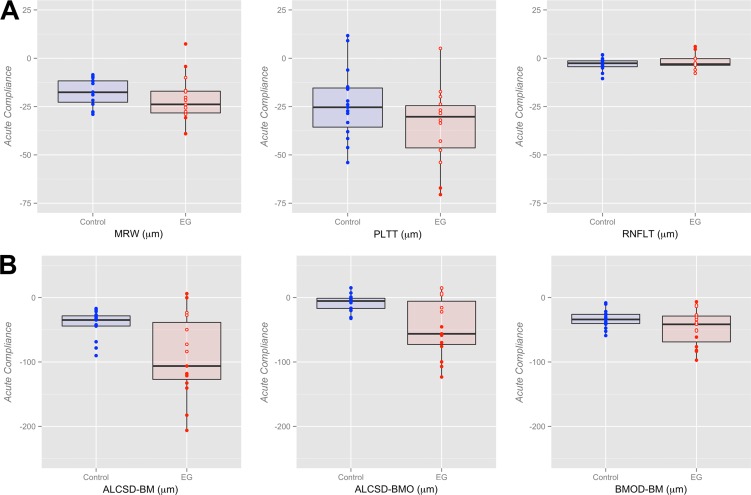
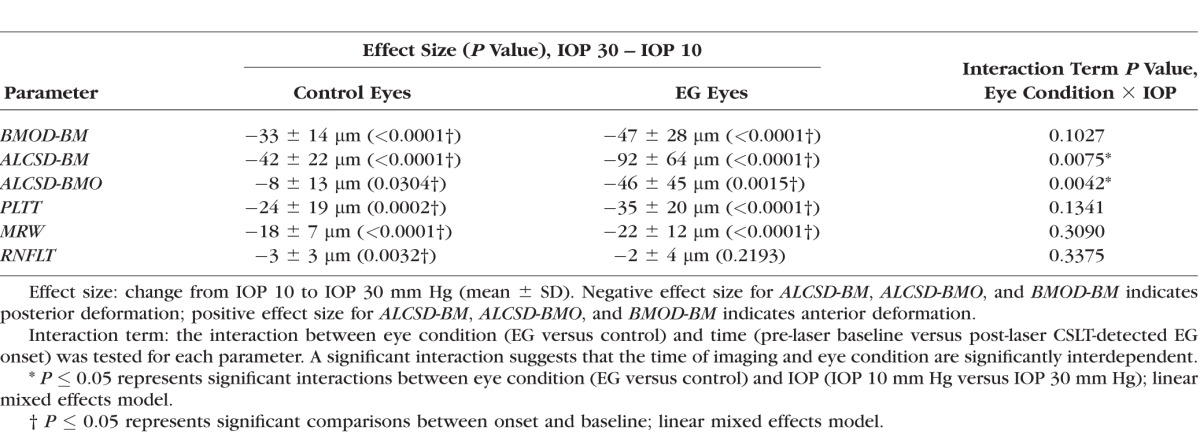
The magnitude of Acute Compliance at the onset of ONH surface topography change in the EG eye is reported in Supplementary Table S2 and graphed in Figure 5 for both the control and EG eyes of each animal. For all animals considered together, linear mixed effects modeling (Table 4) demonstrated statistically significant Acute Compliance effects on all parameters within the control eyes and on all parameters except RNFLT (−2 ± 4 μm, P = 0.2193) within the EG eyes. However, the interaction between eye condition (EG versus control) and IOP during imaging (10 vs. 30 mm Hg) achieved significance only for ALCSD-BM (control eye: −42 ± 14 μm [mean ± SD], EG eye: −92 ± 64 μm; P = 0.0075) and ALCSD-BMO (control eye: −8 ± 13 μm; EG eye: −46 ± 45 μm; P = 0.0042). Although these data suggest the overall presence of laminar and peripapillary scleral hypercompliance at EG onset in this group of monkey eyes, the presence of EG eye hypercompliance was specific to individual eyes, occurring in 9 of the 15 EG eyes for ALCSD-BMO, 8 for ALCSD-BM, and 4 for BMOD-BM. The presence of decreased compliance in the EG eye was also present for MRW (2 eyes), RNFLT (2 eyes), ALCSD-BM (2 eyes), and BMOD-BM (1 eye). The effect of age failed to achieve significance for Control eye, EG eye, or EG versus Control eye differences in acute compliance for all parameters (P > 0.05).
Figure 5.
Box plots representing distributions (median, interquartile range, and extremes) of EG (red) and Control eye (blue) Acute Compliance at EG onset for all OCT neural (A) and connective tissue (B) parameters. The scale extends from −75 to 25 μm across all (A) neural tissue parameters and from −250 to 50 μm across all (B) connective tissue parameters. Experimental glaucoma eyes that fall outside the range of control eye parameters are shown as filled red circles; whereas EG eyes that are within the range of control eye parameters are shown as empty red circles (some circles overlap and appear as one). Eye-specific hypercompliance in EG eyes occurred in MRW (3 of 15 eyes), PLTT (2 of 15 eyes), ALCSD-BM (8 of 15 eyes), ALCSD-BMO (9 of 15 eyes), and BMOD-BM (4 of 15 eyes). An eye-specific decrease in compliance in EG eyes was seen in MRW (two eyes), RNFLT (two eyes), ALCSD-BM (two eyes), and BMOD-BM (one eye).
Table 4.
The Magnitude of Experiment-Wide Acute Compliance at EG Onset Across all Animals
Correlation Analyses
Fixed Deformation Versus Post-Laser IOP.
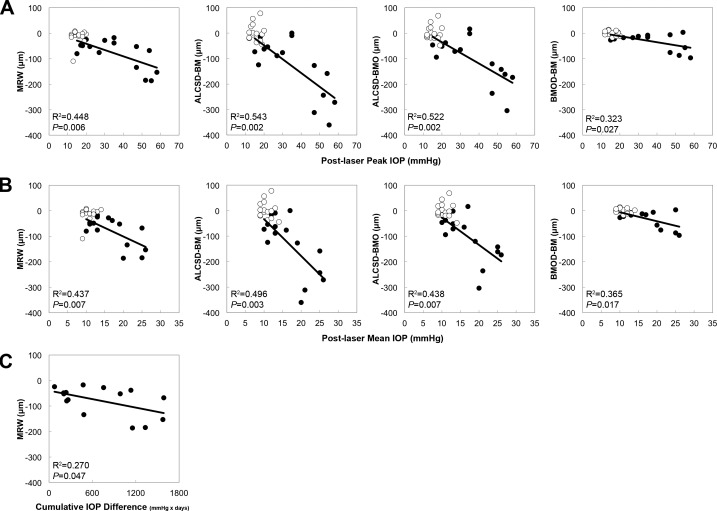
Figure 6 displays scatter plots for significant correlations between the Fixed Deformation at EG onset for each OCT parameter and each IOP parameter. Post-laser peak IOP correlated with MRW (R2 = 0.448, P = 0.006), ALCSD-BM (R2 = 0.543, P = 0.002), ALCSD-BMO (R2 = 0.522, P = 0.002), and BMOD-BM (R2 = 0.323, P = 0.027). Post-laser mean IOP also correlated with MRW (R2 = 0.437, P = 0.007), ALCSD-BM (R2 = 0.496, P = 0.003), ALCSD-BMO (R2 = 0.438, P = 0.007), and BMOD-BM (R2 = 0.365, P = 0.017). Finally, Post-laser cumulative IOP difference correlated only with MRW (R2 = 0.270, P = 0.047).
Figure 6.
Significant correlations between EG eye Fixed Deformation at EG onset versus post-laser IOP. Scatter plots showcasing correlations between Fixed Deformation at EG onset in OCT parameters and post-laser IOP insult parameters. (A) Post-laser Peak IOP and (B) Post-laser Mean IOP were both correlated with MRW, ALCSD-BM, ALCSD-BMO, and BMOD-BM. (C) Post-laser Cumulative IOP Difference was correlated only with MRW. Filled circles: EG eyes; open circles: control eyes. Correlation analysis based on EG eye data only. Control eye data points shown for reference.
Acute Compliance Versus Post-Laser IOP.
Figure 7 displays scatter plots for significant correlations between the same three post-laser IOP parameters and the magnitude of Acute Compliance in OCT parameters at EG onset. ALCSD-BMO Acute Compliance correlated with post-laser peak IOP (R2 = 0.807, P < 0.0001), post-laser mean IOP (R2 = 0.711, P < 0.0001), and post-laser cumulative IOP difference (R2 = 0.684, P = 0.0001).
Figure 7.
Significant correlations between EG eye Acute Compliance versus Post-laser IOP. Scatter plots showcasing correlations between Acute Compliance at EG onset in OCT parameters and post-laser IOP insult parameters. The ALCSD-BMO was correlated with Post-laser Peak IOP, Post-laser Mean IOP, and Post-laser Cumulative IOP Difference. Filled circles: EG eyes; open circles: control eyes. Correlation analysis based on EG eye data only. Control eye data points shown for reference.
Experimental Glaucoma Versus Control Eye Differences in Acute Compliance and EG Versus Control Eye Differences in Post-Laser IOP
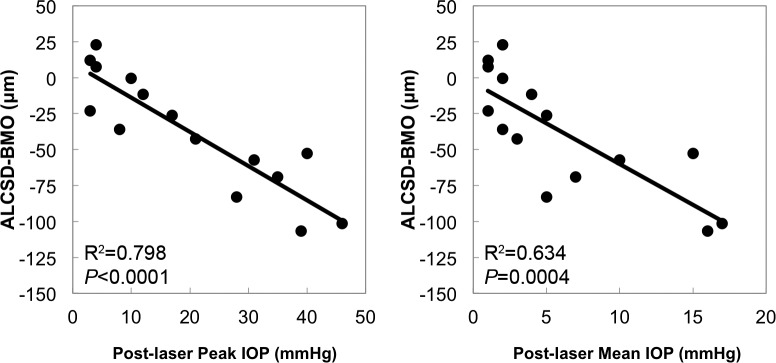
Figure 8 displays scatter plots for significant correlations between EG versus control eye differences in post-laser IOP parameters and the magnitude of EG versus control eye differences in OCT parameter Acute Compliance. Experimental glaucoma versus control eye differences in ALCSD-BMO Acute Compliance were correlated with EG versus control eye differences in post-laser peak IOP (R2 = 0.798, P < 0.0001) and post-laser mean IOP (R2 = 0.634, P = 0.0004). Thus, the degree to which laminar compliance increased in each individual EG eye as compared with its fellow control eye was related to the magnitude of EG eye post-laser IOP elevation.
Figure 8.
Significant correlations between EG versus control eye differences in Acute Compliance and EG versus control eye differences in Post-laser IOP. Scatter plots showcasing correlations between EG versus control eye post-laser IOP parameters and the magnitude of EG versus control eye Acute Compliance at EG onset in OCT parameters. Experimental glaucoma versus control eye differences in ALCSD-BMO correlated with EG versus control eye differences in both Post-laser Peak IOP and Post-laser Mean IOP.
Control Versus EG Eye Acute Compliance
Figure 9 displays scatter plots for correlations between EG eye Acute Compliance and control eye Acute Compliance at EG onset. The BMOD-BM Acute Compliance in control eyes correlated with BMOD-BM (R2 = 0.780, P < 0.0001) and MRW (R2 = 0.537, P = 0.002) Acute Compliance in the EG eyes. Furthermore, control eye ALCSD-BM Acute Compliance correlated with EG eye ALCSD-BM Acute Compliance (R2 = 0.540, P = 0.002). Although we do not have Acute Compliance Data for these eyes when they were normal (i.e., at baseline), these data suggest that if EG eye Acute Compliance at baseline was similar to control eye Acute Compliance at EG onset, baseline EG eye peripapillary scleral compliance (BMOD-BM) predicts the magnitude of EG eye peripapillary scleral compliance at EG onset in the monkey eye.
Figure 9.
Significant correlations between EG eye Acute Compliance and Control eye Acute Compliance. Scatter plots showing correlations between EG eye and control eye Acute Compliance at EG onset. Experimental glaucoma eye BMOD-BM Acute Compliance correlated with both control eye MRW and BMOD-BM Acute Compliance. Experimental glaucoma eye ALCSD-BM Acute Compliance correlated with control eye ALCSD-BM Acute Compliance.
Representative EG Versus Control Eye Acute Compliance Comparisons
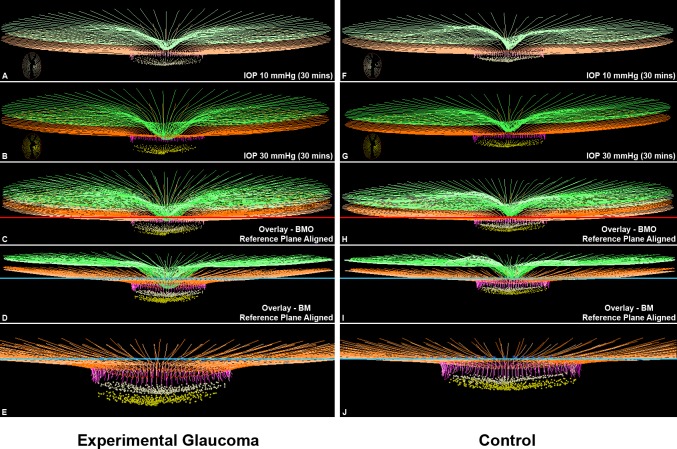
Figure 10 displays the delineated IOP 10 and IOP 30 OCT data sets from the EG and control eyes of Monkey 8. The control eye of this animal demonstrated the largest control eye Acute Compliance change in the OCT connective tissue parameters BMOD-BM, ALCSD-BM, and ALCSD-BM. It therefore represents the upper end of the range of control eye Acute Compliance used to define hypercompliance in individual EG eyes (−59.0 μm, −90.1 μm, and −32.0 μm, respectively, see Supplementary Table S2 and Methods). The EG eye of this animal demonstrates substantial hypercompliance for the same three parameters (−82.0 μm, −140.5 μm, and −58.6 μm, respectively). The distinction between ALCSD-BM (which captures both peripapillary scleral and laminar deformation, relative to peripheral BM) and ALCSD-BMO (which captures laminar deformation relative to BMO, alone) can be clearly seen for both eyes, by overlaying the IOP 10 and IOP 30 data sets using the BMO reference plane (in Figs. 10C, 10H) or by overlapping the IOP 10 and IOP 30 data sets using the BM reference plane (Figs. 10D, 10I).
Figure 10.
Experimental glaucoma eye Acute Compliance (left) exceeds Control eye Acute Compliance (right) in the animal that demonstrates the greatest Control eye Acute Compliance (Monkey 8). Delineated structures within the IOP 10 (A, F) and IOP 30 mm Hg (B, G) OCT data sets of the EG (left) and control (right) eyes of Monkey 8. Insets in these panels are en face views of the delineated BMO and ALCS points of each data set. In (C) and (H) the IOP 10 and IOP 30 OCT data sets have been overlaid by anchoring them to their shared BMO reference plane shown in red. In (D) and (I), the same IOP 10 and IOP 30 OCT data sets have been overlaid by anchoring them to their shared BM reference plane shown in blue. Note that posterior deformation of the IOP 30 ALCS (yellow dots) is present relative to the IOP 10 ALCS (off-white dots) in (C), and this deformation is larger in (D) because it also includes posterior deformation of BM relative to its reference plane (blue line). No adjustments to z-axis magnification have been made to these images. Magnified views of (D) and (I) are shown in (E) and (J) absent the ILM (green) so as to make the laminar and peripapillary scleral deformation components more apparent. Structures shown are ILM (green), BM (orange), BMO (red points), and ALCS (yellow points). To differentiate the structures in the overlaid images, the colors at 10 mm Hg have been washed out. The control eye of this animal demonstrated the largest control eye Acute Compliance change in the OCT connective tissue parameters BMOD-BM, ALCSD-BM, and ALCSD-BM. It therefore set the upper range of control eye Acute Compliance used for the definition of EG eye hypercompliance (−59.0 μm, −90.1 μm, and −32.0 μm, respectively, see Supplementary Table S2 and Methods). The EG eye of this animal demonstrates substantial hypercompliance for the same three parameters (−82.0 μm, −140.5 μm, and −58.6 μm, respectively). The distinction between ALCSD-BM (which captures both peripapillary scleral and laminar deformation, relative to peripheral BM) and ALCSD-BMO (which captures laminar deformation relative to BMO, alone) can be clearly seen for both eyes by overlaying the IOP 10 and IOP 30 data sets using the BMO reference plane (in [C] and [H]) or by overlapping the IOP 10 and IOP 30 data sets using the BM reference plane (in [D] and [I]).
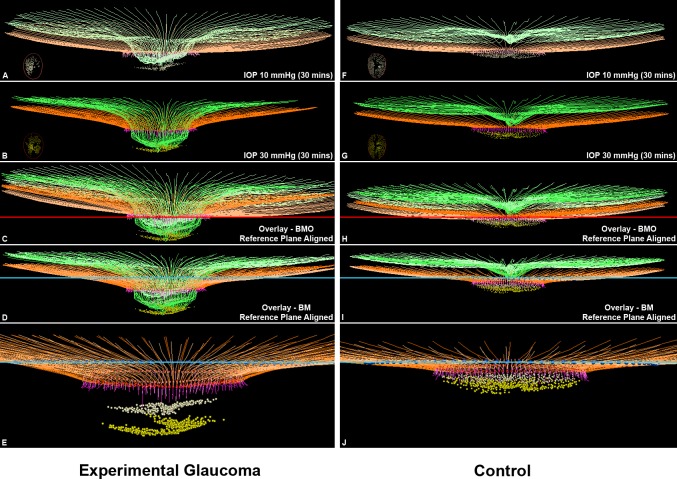
Figure 11 displays the delineated IOP 10 and IOP 30 OCT data sets from the EG and control eyes of Monkey 15. The EG eye of this animal demonstrates the largest magnitude of EG versus control eye difference in ALCSD-BM Acute Compliance (−136.6 μm, Supplementary Table S2), which was the measure used to rank the animals 1 to 15 (Table 1). It also demonstrated the largest magnitude of EG versus control eye difference in BMOD-BM (−44.8 μm, Supplementary Table S2) and ALCSD-BMO (−137.6 μm, Supplementary Table S2). It therefore demonstrates the greatest magnitude of ONH laminar and peripapillary scleral connective tissue hypercompliance among the 15 EG eyes.
Figure 11.
Experimental glaucoma eye Acute Compliance (left) far exceeds Control eye Acute Compliance (right) in the animal that demonstrates the greatest EG eye Acute Compliance (Monkey 15). Delineated structures within the IOP 10 (A, F) and IOP 30 mm Hg (B, G) OCT data sets of the EG (left) and control (right) eyes of Monkey 15. Insets in these panels are en face views of the delineated BMO and ALCS points of each data set. In (C) and (H), the IOP 10 and IOP 30 OCT data sets have been overlaid by anchoring them to their shared BMO reference plane shown in red. In (D) and (I), the same IOP 10 and IOP 30 OCT data sets have been overlaid by anchoring them to their shared BM-based reference plane shown in blue. Note that posterior deformation of the IOP 30 ALCS (yellow dots) is present relative to the IOP 10 ALCS (off-white dots) in (C), and this deformation is larger in (D) because it also includes posterior deformation of BM relative to its reference plane (blue line). No adjustments to z-axis magnification have been made to these images. Magnified views of (D) and (I) are shown in (E) and (J) absent the ILM (green) so as to make the laminar and peripapillary scleral deformation components more apparent. The structures shown are the ILM (green), BM (orange), BMO (red points), and ALCS (yellow points). To differentiate the structures in the overlaid images, the colors at 10 mm Hg have been washed out. The EG eye of this animal demonstrates the largest magnitude of EG versus control eye difference in ALCSD-BM Acute Compliance, which was the measure used to rank the animals 1 to 15 (−136.6 μm, Supplementary Table S2). It also demonstrated the largest magnitude of EG versus control eye difference in BMOD-BM (−44.8 μm, Supplementary Table S2), and ALCSD-BMO (−137.6 μm, Supplementary Table S2). It therefore demonstrates the greatest magnitude of ONH laminar and peripapillary scleral connective tissue hypercompliance among the 15 EG eyes.
Discussion
The purpose of this study was to use in vivo OCT imaging to compare EG versus control eye ONH neural and connective tissue Acute Compliance at the onset of ONH surface deformation in unilateral EG. Our principal findings are as follows. First, acute compliance of the monkey ONH was greater in EG compared with control eyes at onset of ONH surface deformation, both overall, and in as many as 9 of the 15 EG eyes using eye-specific criteria for laminar and/or peripapillary scleral hypercompliance. Second, EG eye-specific hypercompliance was most prevalent and greatest in magnitude for the three OCT ONH connective tissue parameters: ALCSD-BM, ALCSD-BMO, and BMOD-BM. Third, within the nine EG eyes demonstrating eye-specific hypercompliance, the magnitude of acute laminar deformation was profoundly different, which suggests that structural stiffness change in early monkey EG is also eye-specific.
Our detection of ONH lamina cribrosa and peripapillary scleral hypercompliance at the onset of ONH surface topography change in monkey EG using in vivo OCT imaging, supports and expands on our previous studies which were based on simultaneous videography,14,15 CSLT ONH surface imaging,16 postmortem histology,8,11 and 3D histomorphometric reconstruction.9,17 It also expands on our previous characterization of monkey scleral material property changes in the setting of chronic experimental IOP elevation that detected scleral hypercompliance before stiffening in a subset of eyes.32 Although these previous studies indirectly suggested laminar and peripapillary scleral hypercompliance were present, each study was either not specific to the lamina cribrosa,14,16 or was postmortem and therefore could not separate “fixed deformation” from “acute compliance” within each individual study eye.11,17 Although OCT IOP 10/30 imaging was initiated too late to enable longitudinal analysis of ONH hypercompliance in each individual EG eye in the current study, longitudinal baseline and post-laser IOP 10/30 compliance testing is now ongoing in a separate cohort of 20 animals. We believe that longitudinal Acute Compliance testing should increase our ability to detect EG eye-specific compliance change, because we will use the eye-specific, “normal” test-retest LOA for Acute Compliance (established during the baseline testing sessions), which will likely be tighter than the range of values observed across the control eyes at a single time point as used in this report.
The detection of ONH connective tissue hypercompliance in early monkey EG is important for the following reasons. First, it is a likely manifestation of underlying ONH connective tissue remodeling, failed remodeling, or mechanical failure,18 which suggests that it may be both a biomarker for the presence of these processes and a means of identifying underlying mechanisms and treatment interventions. Second, if present in human ocular hypertensive patients, it may be evidence of an early connective tissue response to the eye-specific level of mechanical stress and strain within the ONH connective tissues that represents early connective tissue “structural” change. The relationship between the onset of early connective tissue structural change and the onset of RGC axonal injury could then be studied.
Regarding the mechanistic implications of our findings, we have previously reported that laminar thickening, scleral canal expansion, posterior laminar bowing, laminar insertion migration, and laminar beam thickness increases and decreases, underlie the detectable onset of unilateral EG in the monkey eye.33 Continuum finite element modeling in a subset of 3 EG eyes,34,35 and laminar microarchitectural quantification in a larger cohort of 17 EG eyes (Lockwood H, et al. IOVS 2015;56:ARVO E-Abstract 6151), both describe profound increases in laminar connective tissue volume (defined to be the number of connective tissue voxels within the lamina cribrosa) at this same stage of the neuropathy. These findings were recently confirmed within an expanded group of 21 monkeys euthanized at early through end-stage unilateral EG.18 In that study, the lamina was thinned in the eyes with the greatest overall connective tissue deformation, but this occurred in eyes with levels of CSLT ONH surface change that far exceeded the animals in the current report. Optical coherence tomography longitudinal detection of laminar thickness change, and laminar insertion migration using a 1050 nm wavelength OCT and high-resolution 768 × 768 grid imaging, are part of our current longitudinal OCT compliance testing protocols. The biomechanical and cellular mechanisms contributing to a decrease of laminar and peripapillary scleral structural stiffness in the setting of these dramatic increases in laminar connective tissue volume are currently under study in our laboratory.
Regarding Acute Compliance testing in human ocular hypertensive subjects, several issues require clarification. Agoumi et al.13 reported that the anterior laminar surface demonstrated little posterior deformation in response to ophthalmodynamometry-based acute IOP elevations of approximately 12 mm Hg in 12 glaucoma eyes, 12 age-matched control eyes, and 12 young control eyes. These data are not dissimilar from the monkey control eyes of our present report, in which the overall effect of 30-minute IOP elevations to 30 mm Hg on the parameter ALCSD-BMO was small (−8 ± 13 μm) though significant (P = 0.0304). Although it may be the case that most human eyes demonstrate little posterior laminar deformation following an instantaneous IOP elevation of 12 mm Hg, undetected deformation within the plane of the scleral canal following sclera canal expansion may have been substantial.13 Larger studies in which higher instantaneous IOP elevations are achieved and scleral canal and peripapillary scleral deformations are measured are necessary to more completely characterize the range of compliance present in human healthy and glaucoma eyes. However, if, in these more comprehensive studies, it is still the case that most human eyes demonstrate little posterior laminar deformation, the cross-sectional (or longitudinal) detection of hypercompliance in ocular hypertensive eyes may only be easier as a result. Our data in monkeys in this study are based on 30-minute rather than instantaneous IOP elevations. The viscoelastic component of deformation also may be different in human versus monkey eyes. Detecting hypercompliance in monkey eyes using instantaneous IOP elevations, after hypercompliance has been detected within a 30-minute test, will be the subject of future studies.
The ONH connective tissue parameters ALCSD-BM, ALCSD-BMO, and BMOD-BM demonstrated the largest overall and most frequent individual EG eye hypercompliance effects. In the control monkey eyes of our study, although the experiment-wide magnitude of posterior laminar deformation (estimated by the parameter ALCSD-BMO) was also minimal after 30 minutes of IOP elevation (−8 ± 13 μm), posterior peripapillary scleral deformation (estimated by the magnitude of BMO movement relative to a peripheral BM reference plane or BMOD-BM) was larger (−33 ± 14 μm) (Table 4). Interestingly, this deformation was in turn, not quite as large as movement of the BMO centroid reported by Fortune et al.36 in a separate group of nine normal monkey eyes relative to a more peripheral BM reference plane following acute IOP elevations to 45 mm Hg for 60 minutes (mean 41.2 ± 17.1 μm; range, 18–71 μm). In the present study, the combination of peripapillary scleral deformation relative to peripheral BM (as measured by BMOD-BM) and laminar deformation relative to BMO (as measured by ALCSD-BMO) roughly equaled the parameter ALCSD-BM (−42 ± 22 μm), as would be expected.
Unlike the control eyes, acute IOP elevation within the EG eyes produced an effect size for BMOD-BM (−47 ± 28 μm) that was similar to ALCSD-BMO (−46 ± 45 μm). These data suggest that although the compliance of both the peripapillary sclera and lamina increased in early EG, the relative increase in compliance was greater for the lamina cribrosa compared with the peripapillary sclera. These data separately suggest (but do not prove) that the lamina cribrosa alterations we have previously reported in monkey early EG (outlined above) decrease rather than increase lamina cribrosa structural stiffness. Finally, because previous data from finite element modeling35 and laminar microarchitectural quantification (Lockwood H, et al. IOVS 2015;56:ARVO E-Abstract 6151) acquired in other early EG eyes indicate that laminar connective tissue volume increases rather than decreases in early EG, these data taken together with the data from the current study suggest that it is alterations in the material properties of the lamina rather than its geometry that have made it less stiff.
However, given that the material properties of the ONH and scleral connective tissues are nonlinear,37 it is difficult to directly compare their stiffness even within the control and EG eyes of individual animals. An alternative explanation could argue that the EG eye lamina cribrosa tissue is most likely stiffer than control eye tissue under their respective in vivo working pressures (i.e., IOPs of 25 to 45 mm Hg for most EG eyes and IOPs of 10 to 18 mm Hg for most control eyes) and that the EG eye increases its laminar connective tissue volume to maintain homeostatic tension within individual connective tissue and basement membrane fibers that are bearing the increased loads induced by chronic IOP elevation. In this context, the appearance of EG eye hypercompliance, when only looked for between IOPs of 10 and 30 mm Hg, becomes an artifact of experimental design. In this scenario, for EG eyes, a reduction in IOP to 10 mm Hg would be expected to cause a significant unloading of the collagen fibers, whereas this would result in very little change for the control eyes. Because collagen carries little to no load under compressive or low strains, it would be additionally expected that the displacements between 10 and 30 mm Hg in the EG eyes would be larger, as most of this range is below EG homeostatic tension, while displacements in control eyes would be small, as most of this range would represent an increase from homeostatic tension. Studies designed to more completely assess the stress/strain curve (i.e., throughout the homeostatic range of loading [IOP 10, 20, 30, and 45 mm Hg] for both EG and control eyes), as well as to directly test or infer the material properties of the lamina cribrosa, are necessary to confirm which of these explanations are true. Such studies, if performed longitudinally, and with IOP telemetry,38 would allow the within-eye comparison of EG eye compliance at “baseline” and “chronically elevated” levels of “homeostatic” IOP.
Finally, two explanations for increased posterior deformation of the peripapillary sclera and lamina, which do not require any alteration of the laminar cribrosa to be operative, also should be considered. First, if the peripapillary sclera stiffens early in the neuropathy (as has been described by Girard et al.,32 in monkey EG) a reduction of scleral canal expansion at all levels of IOP might follow, which in turn would reduce the sclera's stiffening of the lamina. If present, this would reduce the effective stiffness of a lamina that is itself unchanged, leaving it subject to increased posterior deformation at all levels of IOP elevation. Second, although stiffening of the peripapillary sclera is not consistent with peripapillary scleral hypercompliance, if stiffening progressed to the point that the peripapillary sclera became brittle, then posterior deformation of a stiffened sclera could follow the onset of peripapillary scleral mechanical failure. Hypercompliance of a lamina that was itself unchanged would then be detected using the strategies in this report. Performing longitudinal OCT compliance testing and postmortem mechanical testing of the peripapillary sclera32 at the earliest evidence of EG onset will be required to address these concerns.
It also should be noted that Monkeys 1 and 2 demonstrated EG eye Acute Compliance values for BMOD-BM (Monkey 1) and ALCSD-BM (Monkeys 1 and 2) that were less than the lower end of the range of control eye Acute Compliance values for these parameters. These data suggest the presence of decreased (rather than increased) peripapillary scleral compliance in Monkey 1 and decreased laminar and peripapillary scleral compliance in Monkeys 1 and 2. This decreased compliance may represent early stiffening of the peripapillary sclera that, as mentioned, has been measured in previous mechanical testing of early monkey EG sclera.32 It also may represent early stiffening of the lamina cribrosa in these eyes in glaucoma that has been directly39 and indirectly14,40 suggested later in the neuropathy by a series of previous reports. The eye-specific timing of laminar and peripapillary scleral compliance change in monkey EG will be elucidated within the aforementioned ongoing longitudinal studies.
Regarding correlation analysis of IOP effects, Post-laser Peak IOP and Post-laser Mean IOP were similarly predictive of both Fixed Deformation and Acute Compliance in the control and EG eyes. This finding is consistent with a literature that supports the importance of both measures without consistently suggesting one is a more powerful predictor of EG eye change. Several previous reports in the monkey EG model have suggested peak IOP was more predictive of EG eye change. In the first, we reported that Maximum IOP was the most important predictor of the short-term rate of CSLT-detected ONH surface change and OCT RNFLT change in 59 unilateral EG animals.19 More recently, we reported that although Cumulative IOP Insult and Maximum IOP both correlated to the magnitude of 3D histomorphometric ONH connective tissue deformation in 21 EG eyes extending from onset to end-stage CSLT-detected surface change,18 the correlation was stronger for Maximum IOP than for Cumulative IOP Insult (R = 0.64, P = 0.0019 and R = 0.48, P = 0.0286, respectively). However, several other studies have reported similar prediction of CSLT and OCT outcomes using mean versus peak post-laser IOP.41–43 These issues will be more powerfully studied when telemetric IOP measurements in the monkey EG model38 allow for more accurate characterization of what duration of exposure at what levels of IOP are most important.
The presence of a significant correlation between EG and control eyes for Acute Compliance in the connective tissue parameter BMOD-BM is of interest because it suggests that if EG eye Acute Compliance at baseline (pre-laser) was similar to control eye Acute Compliance at both baseline and EG onset, then EG eye baseline compliance would predict the magnitude of EG eye compliance at EG onset. The likelihood that control and EG eye Acute Compliance were similar at baseline in this study is supported by our previous study in which Acute Compliance was tested in both eyes of five bilateral normal monkeys.12 In that study, only one of the five animals had substantial between-eye differences in Acute Compliance (defined by acute IOP elevation from 10 to 45 mm Hg for 60 minutes). The ability of baseline ONH compliance to predict the susceptibility of the ONH neural and connective tissues to glaucomatous damage is currently under study in prospective longitudinal studies.
Our study includes the following limitations. First, IOP 10/30 compliance testing was not performed at baseline, so eye-specific longitudinal detection of the onset and progression of hypercompliance (relative to baseline) could not be performed. Instead, EG versus control eye differences in Acute Compliance at EG onset are reported. First, as mentioned above, we required that EG eye Acute Compliance exceed the range of control eye Acute Compliance to be defined as significant. However, as also mentioned above, we believe detection of hypercompliance will be more frequent among individual eyes when longitudinal data are available for analysis because the range of test-retest variability within individual eyes is likely to be narrower than the cross-sectional range of control eye values used in this study.
Second, because we do not have compliance testing on the control eyes at baseline (i.e., when they were “normal”), it is possible that they became less compliant over the course of post-laser follow-up, creating the appearance of hypercompliance in the EG eyes. It is conceivable that either the frequent anterior chamber needle insertions required for manometric control of IOP during imaging, or the onset of EG in the contralateral EG eye might elicit this effect within the control eyes. However, we think this is unlikely because the deformations we report in the 15 control eyes of this study (following acute IOP elevations from 10 to 30 mm Hg for 30 minutes) are remarkably similar in magnitude to the deformations we previously reported in the five bilateral normal animals mentioned above (in which IOP was elevated from 10 to 45 mm Hg for 60 minutes in both eyes).12 In that study, animal age ranged from 1 to 10 years compared with 3.4 to 22.3 in the present report. The range of Acute Compliance for the 10 eyes of that report (for BMOD-BM [then called Neural Canal Opening (NCO) Depth]), −15 to −68 μm; for ALCSD-BMO (called Anterior Lamina Cribrosa Surface – NCO), +7 to −40 μm; and for ALCSD-BM (called Anterior Lamina Cribrosa Surface – BM), −24 to −111 μm are very close to the range of Acute Compliance for the same parameters in the 15 control eyes of the present study (for BMOD-BM, −8.2 to −59 μm; for ALCSD-BMO, +15.1 to −32.4 μm; and for ALCSD-BM, −17 to −90.1 μm) even though the present study included older animals and IOP elevations that were lower and of shorter duration.
Third, we4,8 and others6,7 have described the laminar-scleral dynamic within the ONH and the ability of a more compliant peripapillary sclera to allow expansion of the scleral canal in response to acute or chronic IOP elevation. Our study was not designed to assess this phenomenon, but improved imaging of the scleral canal and peripapillary sclera will be incorporated into future reports.
Fourth, although we refer to our study endpoint as EG onset, because we required two confirmations of EG eye onset it is most likely that it is well beyond the earliest onset of glaucomatous change. We are working to implement rapid automated segmentation of our full complement of OCT-detected ONH landmarks21 so as to be able to detect change from baseline at the time of image acquisition. Although it is likely that most of the animals were studied at levels of axon loss between 0% and 30%,21 future studies to detect early connective tissue change that precedes axon loss may be possible.
In summary, this study is the first to report direct, in vivo, evidence of laminar and peripapillary scleral hypercompliance in most monkey eyes at the onset of CSLT-detected, ONH surface topography change in unilateral monkey EG. This finding is important because it strongly suggests that the cellular mechanisms that underlie increased laminar connective tissue volume,34 laminar thickening,18,33 laminar beam enlargement (Lockwood H, et al. IOVS 2015;56:ARVO E-Abstract 6151), scleral canal expansion,33 laminar insertion migration,18,27 and posterior laminar and peripapillary scleral bowing18,33 alter the structural stiffness of both the lamina and peripapillary sclera at this same stage of the neuropathy. The questions of whether these processes are protective or damaging to the ONH connective tissues, whether they are primary or occur in response to neural or connective tissue damage, and whether they are protective or damaging to the RGC axons are under study.
Supplementary Material
Acknowledgments
The authors thank Galen Williams, MSc, and Christy Hardin, MSc, for their assistance with animal testing, Ziyang Liu for her assistance with OCT delineations, Juan Reynaud for his assistance with delineation software development, and Joanne Couchman for her assistance in manuscript preparation.
Supported by National Institutes of Health Grant R01-EY011610 (CFB), R01-EY022128 (CFB), and R01-E019327 (BF), and unrestricted research support from Legacy Good Samaritan Foundation, Heidelberg Engineering, Alcon Research Institute, and Sears Medical Trust.
Aspects of this paper were presented at the annual meeting of the Association for Research in Vision and Ophthalmology, Seattle, Washington, United States, 2013.
Disclosure: K.M. Ivers, None; H. Yang, None; S.K. Gardiner, None; L. Qin, None; L. Reyes, None; B. Fortune, None; C.F. Burgoyne, Heidelberg Engineering (F, R)
References
- 1. Anderson DR. Ultrastructure of human and monkey lamina cribrosa and optic nerve head. Arch Ophthalmol. 1969; 82: 800–814. [DOI] [PubMed] [Google Scholar]
- 2. Anderson DR. Ultrastructure of the optic nerve head. Arch Ophthalmol. 1970; 83: 63–73. [DOI] [PubMed] [Google Scholar]
- 3. Burgoyne CF,, Downs JC,, Bellezza AJ,, et al. The optic nerve head as a biomechanical structure: a new paradigm for understanding the role of IOP-related stress and strain in the pathophysiology of glaucomatous optic nerve head damage. Prog Retin Eye Res. 2005; 24: 39–73. [DOI] [PubMed] [Google Scholar]
- 4. Burgoyne CF. A biomechanical paradigm for axonal insult within the optic nerve head in aging and glaucoma. Exp Eye Res. 2011; 93: 120–132. [DOI] [PMC free article] [PubMed] [Google Scholar]
- 5. Bellezza AJ,, Hart RT,, Burgoyne CF. The optic nerve head as a biomechanical structure: initial finite element modeling. Invest Ophthalmol Vis Sci. 2000; 41: 2991–3000. [PubMed] [Google Scholar]
- 6. Sigal IA,, Flanagan JG,, Tertinegg I,, et al. Modeling individual-specific human optic nerve head biomechanics. Part I: IOP-induced deformations and influence of geometry. Biomech Model Mechanobiol. 2009; 8: 85–98. [DOI] [PubMed] [Google Scholar]
- 7. Sigal IA,, Flanagan JG,, Tertinegg I,, et al. Modeling individual-specific human optic nerve head biomechanics. Part II: influence of material properties. Biomech Model Mechanobiol. 2009; 8: 99–109. [DOI] [PubMed] [Google Scholar]
- 8. Bellezza AJ,, Rintalan CJ,, Thompson HW,, et al. Anterior scleral canal geometry in pressurised (IOP 10) and non-pressurised (IOP 0) normal monkey eyes. Br J Ophthalmol. 2003; 87: 1284–1290. [DOI] [PMC free article] [PubMed] [Google Scholar]
- 9. Yang H,, Downs JC,, Sigal IA,, et al. Deformation of the normal monkey optic nerve head connective tissue after acute IOP elevation within 3-D histomorphometric reconstructions. Invest Ophthalmol Vis Sci. 2009; 50: 5785–5799. [DOI] [PMC free article] [PubMed] [Google Scholar]
- 10. Morgan WH,, Chauhan BC,, Yu DY,, et al. Optic disc movement with variations in intraocular and cerebrospinal fluid pressure. Invest Ophthalmol Vis Sci. 2002; 43: 3236–3242. [PubMed] [Google Scholar]
- 11. Bellezza AJ,, Rintalan CJ,, Thompson HW,, et al. Deformation of the lamina cribrosa and anterior scleral canal wall in early experimental glaucoma. Invest Ophthalmol Vis Sci. 2003; 44: 623–637. [DOI] [PubMed] [Google Scholar]
- 12. Strouthidis NG,, Fortune B,, Yang H,, et al. Effect of acute intraocular pressure elevation on the monkey optic nerve head as detected by spectral domain optical coherence tomography. Invest Ophthalmol Vis Sci. 2011; 52: 9431–9437. [DOI] [PMC free article] [PubMed] [Google Scholar]
- 13. Agoumi Y,, Sharpe GP,, Hutchison DM,, et al. Laminar and prelaminar tissue displacement during intraocular pressure elevation in glaucoma patients and healthy controls. Ophthalmology. 2011; 118: 52–59. [DOI] [PubMed] [Google Scholar]
- 14. Burgoyne CF,, Quigley HA,, Thompson HW,, et al. Early changes in optic disc compliance and surface position in experimental glaucoma. Ophthalmology. 1995; 102: 1800–1809. [DOI] [PubMed] [Google Scholar]
- 15. Burgoyne CF,, Quigley HA,, Thompson HW,, et al. Measurement of optic disc compliance by digitized image analysis in the normal monkey eye. Ophthalmology. 1995; 102: 1790–1799. [DOI] [PubMed] [Google Scholar]
- 16. Heickell AG,, Bellezza AJ,, Thompson HW,, et al. Optic disc surface compliance testing using confocal scanning laser tomography in the normal monkey eye. J Glaucoma. 2001; 10: 369–382. [DOI] [PubMed] [Google Scholar]
- 17. Yang H,, Thompson H,, Roberts MD,, et al. Deformation of the early glaucomatous monkey optic nerve head connective tissue after acute IOP elevation in 3-D histomorphometric reconstructions. Invest Ophthalmol Vis Sci. 2011; 52: 345–363. [DOI] [PMC free article] [PubMed] [Google Scholar]
- 18. Yang H,, Ren R,, Lockwood H,, et al. The connective tissue components of optic nerve head cupping in monkey experimental glaucoma part 1: global change. Invest Ophthalmol Vis Sci. 2015; 56: 7661–7678. [DOI] [PMC free article] [PubMed] [Google Scholar]
- 19. Gardiner SK,, Fortune B,, Wang L,, et al. Intraocular pressure magnitude and variability as predictors of rates of structural change in non-human primate experimental glaucoma. Exp Eye Res. 2012; 103: 1–8. [DOI] [PMC free article] [PubMed] [Google Scholar]
- 20. Burgoyne CF. The non-human primate experimental glaucoma model. Exp Eye Res. 2015; 141: 57–73. [DOI] [PMC free article] [PubMed] [Google Scholar]
- 21. He L,, Yang H,, Gardiner SK,, et al. Longitudinal detection of optic nerve head changes by spectral domain optical coherence tomography in early experimental glaucoma. Invest Ophthalmol Vis Sci. 2014; 55: 574–586. [DOI] [PMC free article] [PubMed] [Google Scholar]
- 22. Burgoyne CF,, Mercante DE,, Thompson HW. Change detection in regional and volumetric disc parameters using longitudinal confocal scanning laser tomography. Ophthalmology. 2002; 109: 455–466. [DOI] [PubMed] [Google Scholar]
- 23. Chauhan BC,, McCormick TA,, Nicolela MT,, et al. Optic disc and visual field changes in a prospective longitudinal study of patients with glaucoma: comparison of scanning laser tomography with conventional perimetry and optic disc photography. Arch Ophthalmol. 2001; 119: 1492–1499. [DOI] [PubMed] [Google Scholar]
- 24. Chauhan BC,, Blanchard JW,, Hamilton DC,, et al. Technique for detecting serial topographic changes in the optic disc and peripapillary retina using scanning laser tomography. Invest Ophthalmol Vis Sci. 2000; 41: 775–782. [PubMed] [Google Scholar]
- 25. Fortune B,, Burgoyne CF,, Cull GA,, et al. Structural and functional abnormalities of retinal ganglion cells measured in vivo at the onset of optic nerve head surface change in experimental glaucoma. Invest Ophthalmol Vis Sci. 2012; 53: 3939–3950. [DOI] [PMC free article] [PubMed] [Google Scholar]
- 26. Strouthidis NG,, Grimm J,, Williams GA,, et al. A comparison of optic nerve head morphology viewed by spectral domain optical coherence tomography and by serial histology. Invest Ophthalmol Vis Sci. 2010; 51: 1464–1474. [DOI] [PMC free article] [PubMed] [Google Scholar]
- 27. Yang H,, Williams G,, Downs JC,, et al. Posterior (outward) migration of the lamina cribrosa and early cupping in monkey experimental glaucoma. Invest Ophthalmol Vis Sci. 2011; 52: 7109–7121. [DOI] [PMC free article] [PubMed] [Google Scholar]
- 28. Yang H,, Qi J,, Hardin C,, et al. Spectral-domain optical coherence tomography enhanced depth imaging of the normal and glaucomatous nonhuman primate optic nerve head. Invest Ophthalmol Vis Sci. 2012; 53: 394–405. [DOI] [PMC free article] [PubMed] [Google Scholar]
- 29. Strouthidis NG,, Fortune B,, Yang H,, et al. Longitudinal change detected by spectral domain optical coherence tomography in the optic nerve head and peripapillary retina in experimental glaucoma. Invest Ophthalmol Vis Sci. 2011; 52: 1206–1219. [DOI] [PMC free article] [PubMed] [Google Scholar]
- 30. Povazay B,, Hofer B,, Hermann B,, et al. Minimum distance mapping using three-dimensional optical coherence tomography for glaucoma diagnosis. J Biomed Opt. 2007; 12: 041204. [DOI] [PubMed] [Google Scholar]
- 31. Chen TC. Spectral domain optical coherence tomography in glaucoma: qualitative and quantitative analysis of the optic nerve head and retinal nerve fiber layer (an AOS thesis). Trans Am Ophthalmol Soc. 2009; 107: 254–281. [PMC free article] [PubMed] [Google Scholar]
- 32. Girard MJ,, Suh JK,, Bottlang M,, et al. Biomechanical changes in the sclera of monkey eyes exposed to chronic IOP elevations. Invest Ophthalmol Vis Sci. 2011; 52: 5656–5669. [DOI] [PMC free article] [PubMed] [Google Scholar]
- 33. Yang H,, Downs JC,, Burgoyne CF. Physiologic intereye differences in monkey optic nerve head architecture and their relation to changes in early experimental glaucoma. Invest Ophthalmol Vis Sci. 2009; 50: 224–234. [DOI] [PMC free article] [PubMed] [Google Scholar]
- 34. Roberts MD,, Sigal IA,, Liang Y,, et al. Changes in the biomechanical response of the optic nerve head in early experimental glaucoma. Invest Ophthalmol Vis Sci. 2010; 51: 5675–5684. [DOI] [PMC free article] [PubMed] [Google Scholar]
- 35. Roberts MD,, Grau V,, Grimm J,, et al. Remodeling of the connective tissue microarchitecture of the lamina cribrosa in early experimental glaucoma. Invest Ophthalmol Vis Sci. 2009; 50: 681–690. [DOI] [PMC free article] [PubMed] [Google Scholar]
- 36. Fortune B,, Yang H,, Strouthidis NG,, et al. The effect of acute intraocular pressure elevation on peripapillary retinal thickness, retinal nerve fiber layer thickness, and retardance. Invest Ophthalmol Vis Sci. 2009; 50: 4719–4726. [DOI] [PMC free article] [PubMed] [Google Scholar]
- 37. Zhang L,, Albon J,, Jones H,, et al. Collagen microstructural factors influencing optic nerve head biomechanics. Invest Ophthalmol Vis Sci. 2015; 56: 2031–2042. [DOI] [PubMed] [Google Scholar]
- 38. Downs JC,, Burgoyne CF,, Seigfreid WP,, et al. 24-hour IOP telemetry in the nonhuman primate: implant system performance and initial characterization of IOP at multiple timescales. Invest Ophthalmol Vis Sci. 2011; 52: 7365–7375. [DOI] [PMC free article] [PubMed] [Google Scholar]
- 39. Zeimer RC,, Ogura Y. The relation between glaucomatous damage and optic nerve head mechanical compliance. Arch Ophthalmol. 1989; 107: 1232–1234. [DOI] [PubMed] [Google Scholar]
- 40. Ren R,, Yang H,, Gardiner SK,, et al. Anterior lamina cribrosa surface depth, age, and visual field sensitivity in the Portland Progression Project. Invest Ophthalmol Vis Sci. 2014; 55: 1531–1539. [DOI] [PMC free article] [PubMed] [Google Scholar]
- 41. Fortune B,, Reynaud J,, Wang L,, et al. Does optic nerve head surface topography change prior to loss of retinal nerve fiber layer thickness: a test of the site of injury hypothesis in experimental glaucoma. PLoS One. 2013; 8: e77831. [DOI] [PMC free article] [PubMed] [Google Scholar]
- 42. Fortune B,, Burgoyne CF,, Cull G,, et al. Onset and progression of peripapillary retinal nerve fiber layer (RNFL) retardance changes occur earlier than RNFL thickness changes in experimental glaucoma. Invest Ophthalmol Vis Sci. 2013; 54: 5653–5661. [DOI] [PMC free article] [PubMed] [Google Scholar]
- 43. Fortune B,, Cull G,, Reynaud J,, et al. Relating retinal ganglion cell function and retinal nerve fiber layer (RNFL) retardance to progressive loss of RNFL thickness and optic nerve axons in experimental glaucoma. Invest Ophthalmol Vis Sci. 2015; 56: 3936–3944. [DOI] [PMC free article] [PubMed] [Google Scholar]
Associated Data
This section collects any data citations, data availability statements, or supplementary materials included in this article.


