

Abstract
Purpose
This article reports a method for en face optical coherence tomography (OCT) imaging and quantitative assessment of alterations in both thickness and reflectance of individual retinal layers at different stages of diabetic retinopathy (DR).
Methods
High-density OCT raster volume scans were acquired in 29 diabetic subjects divided into no DR (NDR) or non-proliferative DR (NPDR) groups and 22 control subjects (CNTL). A customized image segmentation method identified eight retinal layer interfaces and generated en face thickness maps and reflectance images for nerve fiber layer (NFL), ganglion cell and inner plexiform layers (GCLIPL), inner nuclear layer (INL), outer plexiform layer (OPL), outer nuclear layer (ONL), photoreceptor outer segment layer (OSL), and retinal pigment epithelium (RPE). Mean thickness and intensity values were calculated in nine macular subfields for each retinal layer.
Results
En face thickness maps and reflectance images of retinal layers in CNTL subjects corresponded to normal retinal anatomy. Total retinal thickness correlated negatively with age in nasal subfields (R ≤−0.31; P ≤ 0.03, N = 51). In NDR subjects, NFL and OPL thickness were decreased (P = 0.05), and ONL thickness was increased (P = 0.04) compared to CNTL. In NPDR subjects, GCLIPL thickness was increased in perifoveal subfields (P < 0.05) and INL intensity was higher in all macular subfields (P = 0.04) compared to CNTL.
Conclusions
Depth and spatially resolved retinal thickness and reflectance measurements are potential biomarkers for assessment and monitoring of DR.
Keywords: diabetic retinopathy, en face imaging, optical coherence tomography, reflectance, thickness
Diabetic retinopathy (DR) is currently the leading cause of vision loss in working-age adults.1 With anticipated growth of the diabetic population, the number of visually impaired diabetic people will continue to be a major public health concern. Diabetes is known to cause alterations in the retinal microvasculature and tissue that can progressively lead to visual impairment. Currently, prevention of vision loss due to DR requires early diagnosis, regular monitoring, and timely therapeutic intervention. However, a key impediment is identifying diabetic individuals who will develop retinopathy and progress to vision-threatening macular edema or proliferative DR.
Optical coherence tomography (OCT) imaging allows cross-sectional visualization of retinal layers and quantitative mapping of total retinal thickness. OCT technology is a standard of clinical care for detection of anatomical abnormalities within the retinal layers and the presence of retinal thickening in DR subjects. Several image segmentation methods have become available for measurement of thickness of individual retinal layers,2–7 and alterations in retinal layer thickness have been shown to occur in DR.8–14 Furthermore, alterations in the integrity of the inner segment ellipsoid layer, as shown by changes in continuity and reflectance, have also been reported in DR subjects.15,16 Methods for en face imaging have been developed17,18 and applied for visualizing pathologies due to various retinal conditions.19–30 We previously reported methods for generation of en face reflectance images of individual retinal layers from a high-density raster of images.31–33 In the current study, we report for the first time an en face OCT imaging method for quantitative measurements of both thickness and reflectance alterations in individual retinal layers and macular subfields at different stages of DR.
Methods
Subjects
The research study was approved by the Institutional Review Board at the University of Illinois at Chicago. Prior to subjects' enrollment, the research study was explained to them, and informed consent was obtained according to the tenets of the Declaration of Helsinki. Twenty-nine subjects with a clinical diagnosis of diabetes mellitus and 22 non-diabetic control subjects (CNTL) participated in the study. Exclusion criteria included high myopia (refractive error > −6 diopter [D]), clinical diagnosis of diabetic macular edema, history of antivascular endothelium growth factor treatment, stroke or myocardial infarction (within 3 months of imaging), active angina, clinical diagnosis of glaucoma, age-related macular degeneration or retinal vascular occlusions, history of intraocular surgery, or cataract surgery performed less than 9 months prior to imaging. Control subjects underwent dilated fundus examination by retina specialists (N.P.B., F.Y.C.) to confirm retinal health. Diabetic subjects also underwent dilated fundus examination by retina specialists (J.I.L., F.Y.C., Y.I.L.) who categorized subjects into no DR (NDR [n = 17]) or non-proliferative DR (NPDR [n = 12]) groups. One eye per subject was selected based on exclusion criteria. If both eyes qualified, the eye with better image data was selected. Right-to-left eye ratios were 13:9, 12:5, and 6:6 in the CNTL, NDR, and NPDR groups, respectively. Spherical refractive errors of CNTL (−1.3 ± 2.6 D), NDR (−0.6 ± 1.9 D), and NPDR (0.0 ± 1.0 D) subjects were similar (P = 0.2). Female-to-male subject ratios were 14:8, 9:8, and 8:4 in CNTL, NDR, and NPDR groups, respectively (P ≥ 0.6). Subjects in CNTL, NDR, and NPDR groups were similar in terms of race composition (P ≥ 0.3). Mean ages of CNTL (63 ± 12 years of age), NDR (59 ± 8 years of age), and NPDR (58 ± 9 years of age) subjects also were similar (P = 0.3).
Image Acquisition
A high-density spectral domain OCT (SDOCT) raster volume scan of the macula was obtained using a commercially available instrument (Spectralis; Heidelberg Engineering, Heidelberg, Germany). The volume scan consisted of 73 raster horizontal B-scans with a depth resolution of 3.9 μm and 1024 A-scans per B-scan. Nine SDOCT B-scans were averaged at each location by using the instrument's eye tracker. The SDOCT raster scan covered a retinal area of 20° × 15° centered on the fovea with approximately 62-μm spacing between SDOCT B-scans.
Image Analysis
Automated image segmentation software was developed in Matlab (Mathworks, Inc., Natick, MA, USA) for identification of eight interfaces between retinal cell layers in the SDOCT B-scans. Retinal cell layer interfaces were detected using graph theory and dynamic programming, based on a previously described method.3 Briefly, a graph was created for each SDOCT B-scan, with the edge weights of the graph assigned based on the vertical gradients in the image, such that large gradients resulted in small weights. A horizontal path through the graph that minimized the total sum of the weights was found using Dijkstra's algorithm and that defined a line separating two retinal cell layers.3 By assigning weights of the graph according to the sign of the gradient (positive or negative), retinal cell layer interfaces that had either bright-to-dark or dark-to-bright transitions were identified.
As shown in Figure 1, the eight retinal interfaces detected by the automated segmentation algorithm were the vitreous and nerve fiber layer (NFL), the NFL and combined ganglion cell/inner plexiform layers (GCLIPL), the GCLIPL and inner nuclear layer (INL), the INL and outer plexiform layer (OPL), the OPL and outer nuclear layer (ONL), the ONL and photoreceptor outer segment layer (OSL), the OSL and retinal pigment epithelium (RPE), and the RPE and choroid. To find a unique path for these eight retinal interfaces, image segmentation of the cell interfaces was performed in successive order. First, the interface between the vitreous and NFL was identified, because this interface was characterized by the largest dark-to-bright transition (largest positive vertical gradient) in the image and represented the lowest weighted path of the entire graph. Second, the interface between the ONL and OSL layers was found after restricting the graph search area to include only image regions external to the vitreous/NFL interface. Third, the path corresponding to the RPE/choroid interface was determined by restricting the graph search area to include only locations of the image external to the ONL/OSL path and by assigning lower graph weights to larger negative gradients, thereby detecting a bright-to-dark transition. Fourth, the INL/OPL cell interface was detected by limiting the graph to include only regions of the image between the vitreous/NFL and ONL/OSL paths. Fifth, the path corresponding to the OPL/ONL cell interface was obtained by restricting the graph search area to include only image regions between the INL/OPL and ONL/OSL paths and designating lower weights of the graph for larger negative gradients (bright-to-dark transition). Sixth, the GCLIPL/INL cell interface was detected by limiting the graph search area to regions to immediately internal (20 pixels) to the INL/OPL cell interface and finding a bright-to-dark transition. Seventh, the NFL/GCLIPL cell interface was determined by limiting the graph search area to include only image regions between the vitreous/NFL and GCLIPL/INL cell interfaces and detecting a bright-to-dark transition. Eighth and finally, the OSL and RPE boundary was found by restricting the graph search area to include only image areas between the detected ONL/OSL and RPE/choroid interfaces and finding a dark-to-bright transition.
Figure 1.

Example of an OCT B-scan through the fovea in the right eye of a control subject, displaying eight segmented interfaces of retinal layers. Detached posterior hyaloid membrane is visible nasal and temporal to the fovea.
After the retinal interfaces were segmented, the operator was able to scroll through all 73 SDOCT B-scans in the volume scan to review the segmentation results and, if necessary, manually correct errors in the detected interfaces. Such errors occurred with detached posterior hyaloid membranes, absence of inner retinal layers at the foveal center, and the presence of slightly irregular layer interfaces. Significant wrinkling of the inner limiting membrane was not observed, and cystoid changes that precluded confident identification of retinal layer interfaces were not present in this sample of images due to the exclusion criteria. To correct segmentation errors, the operator selected a segmentation path that required modification and then manually drew a revised line corresponding to the visualized cell layer interface. The search area of the graph was then restricted to include only a small vertical (depth) image region around the manually drawn line, and a revised path for the cell layer interface was obtained by determining a new graph cut solution. The error rate of the automated segmentation algorithm was determined in 5 CNTL and 5 NPDR subjects. For each of the eight retinal interfaces, an error rate was calculated as the percentage of length of the automated segmentation line that was manually modified. A mean error rate was calculated for each subject by averaging the error rates of all retinal interfaces.
En Face Thickness Mapping and Reflectance Imaging
En face thickness maps and reflectance images were generated for each of 7 retinal layers (NFL, GCLIPL, INL, OPL, ONL, OSL, and RPE) based on segmentation of the 8 retinal interfaces in the SDOCT B-scans. Outer segment complex (OSC) thickness was calculated as the depth separation between the ONL/OSL and RPE/choroid interfaces (OSC = OSL+RPE). In addition, en face thickness maps and intensity images of the inner retina (IR), outer retina (OR), and total retina (TR) were generated. IR thickness was calculated as the depth separation between the vitreous/NFL and INL/OPL interfaces (IR = NFL+GCLIPL+INL). Outer retina thickness was calculated as the depth separation between the INL/OPL and RPE/choroid interfaces (OR = OPL+ONL+OSL+RPE). TR thickness was calculated as the depth separation between the vitreous/NFL and RPE/choroid interfaces (TR = sum of 7 layers). En face reflectance images of each of the seven retinal layers and the IR, OR, and TR were generated based on pixel values averaged vertically (in depth) within the segmented layers in each SDOCT B-scan to create rows of corresponding en face images. Mean thickness and intensity values were calculated in each of the 9 Early Treatment Diabetic Retinopathy Study (ETDRS) macular subfields for each of the 7 retinal layers and the IR, OR, and TR.34
Statistical Analysis
Mean thickness (T) measurements (NFLT, GCLIPLT, INLT, OPLT, ONLT, OSLT, RPET, IRT, ORT, TRT) and intensity (I) measurements (NFLI, GCLIPLI, INLI, OPLI, ONLI, OSLI, RPEI, IRI, ORI, TRI) were obtained in nine macular subfields in each subject. Data obtained in left eyes were transformed to orient all data to a right-eye configuration. Validity of the method was established by comparing TRT values at the central subfield provided by the automated segmentation software and the instrument's software using linear regression analysis. The relationship between TRT and age was determined using linear regression.
The effects of disease stage (CNTL, NDR, NPDR) and location (nine macular subfields) on thickness and intensity measurements were determined using general linear model repeated measures analysis. For measurements without significant interaction effect, main effect of disease stage was reported. For measurements with significant interaction effect, simple main effect of disease stage was determined by analysis of variance (ANOVA) in each macular subfield. Post hoc pairwise comparisons were performed using the Tukey method. Statistical analyses were performed using SPSS version 22 software (SPSS, Chicago, IL, USA). Significance was accepted at a P value of <0.05.
Results
Automated Segmentation Performance
Average error rates obtained by the automated segmentation algorithm were 3% ± 1% and 7% ± 6% in CNTL and NPDR subjects, respectively. The minimum lengths of manually modified segmentation lines were 7 pixels (41 μm) and 19 pixels (110 μm) in CNTL and NPDR subjects, respectively.
Control Subjects
Thickness Maps.
Examples of thickness maps of seven retinal layers in the right eye of a CNTL subject are shown in Figure 2 (top row). As expected, the NFLT map displayed increased thickness in nasal subfields, decreased thickness in temporal subfields, and minimal thickness in the central subfield. GCLIPLT and INLT maps exhibited a parafoveal ring of increased thickness, with central thinning corresponding to the fovea. The OPLT map was relatively uniform in all subfields, except for the central subfield, which displayed minimal thickness. The ONLT map displayed increased thickness in the central subfield due to the longer and more densely packed cones. Similarly, the OSLT map showed increased thickness centrally, because of a greater separation between the ellipsoid of the inner segments and the RPE. The RPET map was relatively uniform.
Figure 2.

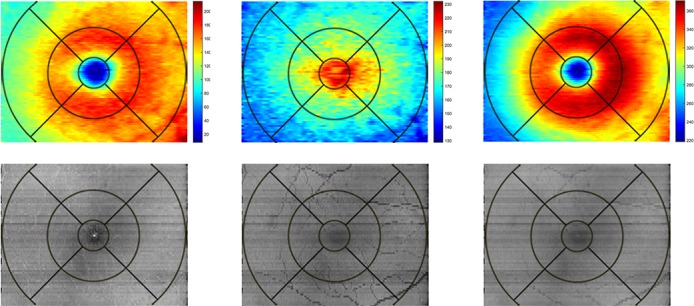
(Top, left to right) Thickness maps of nerve fiber layer (NFL), ganglion cell and inner plexiform layers (GCLIPL), inner nuclear layer (INL), outer plexiform layer (OPL), outer nuclear layer (ONL), photoreceptor outer segment layer (OSL), and retinal pigment epithelium (RPE) in the right eye a control subject. Color bar represents thickness (μm). (Bottom, left to right) Reflectance images of NFL, GCLIPL, INL, OPL, ONL, OSL, and RPE in the same eye. Gray scale range = 0 to 255.
Examples of IRT, ORT, and TRT maps in the same CNTL subject are shown in Figure 3 (top row). The IRT and TRT maps displayed a parafoveal ring of increased thickness surrounding a central depression corresponding to the fovea, whereas the ORT map showed increased thickness centrally due to longer cones near the fovea.
Figure 3.
(Top, left to right): Thickness maps of inner, outer, and total retina in the right eye of a control subject. Color bar represents thickness (μm). (Bottom, left to right) Reflectance images of inner, outer, and total retina in the same eye. Gray scale range = 0 to 255.
En Face Reflectance Images.
Examples of reflectance images of seven retinal layers in the same CNTL subject are shown in Figure 2 (bottom row). Overall, reflectance images of all seven retinal layers displayed relatively uniform intensity indicating lack of pathological disruption. In NFL, GCLIPL, INL, and OPL reflectance images, the fovea appeared darker relative to the surrounding parafoveal regions due to the absence or lack of light reflectance from these cell layers. The normal retinal vasculature including the major retinal arcades are marginally visible in the these reflectance images but appear more prominently in the OSL and RPE reflectance images due to shadowing. Generally, NFL, OSL, and RPE reflectance images showed the highest reflectivity, whereas ONL had the lowest reflectivity among the retinal layers, consistent with brightness levels of these layers as visualized on SDOCT B-scans.
Examples of reflectance images of the IR, OR, and TR in the same CNTL subject are shown in Figure 3 (bottom row). All reflectance images were relatively homogeneous without significant intensity variations. Retinal vasculature can be visualized within the IR reflectance image but appears more prominently in OR reflectance image due to shadowing effects. The foveal center appeared darker, relative to the surrounding parafoveal retina in the IR reflectance image due to the absence of inner retinal cell layers.
Validity
Mean IRT, ORT, and TRT in CNTL subjects stratified by macular subfield are shown in Figure 4. As expected, IRT and TRT had their lowest values in the central subfield, whereas ORT had its highest value. TRT was larger in the parafoveal subfields than in the perifoveal subfields. Furthermore, TRT was larger in the parafoveal and perifoveal nasal subfields than in the parafoveal and perifoveal temporal subfields, as anticipated. Based on data from all subjects, there was a high correlation between TRT in the central subfield provided by the automated segmentation software and the instrument's software (R = 0.99; P < 0.001; N = 51). The slope of the best fit regression line was 1.03 and the y-intercept was −1.7 μm. Consistent with a previous study,35 a trend of lower TRT with increased age was observed in all macular subfields, and the correlation reached statistical significance in the parafoveal and perifoveal nasal subfields (R ≤ −0.31; P ≤ 0.03, N = 51).
Figure 4.

Mean inner, outer, and total retinal thickness (IRT, ORT, TRT, respectively) in 22 control subjects stratified by macular subfield.
Effect of Disease Stage (CNTL, NDR, NPDR)
Thickness Measurements.
The interaction effect between disease stage and location was significant for GCLIPLT (P = 0.001) and not significant for all other thickness measurements (P ≥ 0.07). As shown in Figure 5, GCLIPLT was increased in NPDR compared to that in CNTL in the perifoveal nasal, superior, and inferior subfields (P ≤ 0.05). The main effect of disease stage was significant for ONLT (P = 0.04), marginally significant for NFLT and OPLT (P = 0.06), and not statistically significant for INLT, ONLT, OSLT, RPET, and OSCT (P ≥ 0.2). As shown in Figure 5, ONLT was higher in NDR than in CNTL in all macular subfields (P = 0.04), whereas NFLT and OPLT were lower in NDR than in CNTL (P = 0.05). All thickness measurements had differences among macular subfields (P < 0.001), except for RPET (P = 0.1).
Figure 5.

(A) Mean nerve fiber layer thickness (NFLT); (B) ganglion cell and inner plexiform layer thickness (GCLIPLT); (C) outer plexiform layer thickness (OPLT); (D) outer nuclear layer thickness (ONLT); and (E) inner nuclear layer intensity (INLI) stratified by macular subfield and disease stage. NFLT and OPLT were lower, whereas ONLT was higher in NDR compared to CNTL. GCLIPLT was higher in NPDR in the perifoveal nasal, superior, and inferior subfields compared to CNTL, whereas INLI was higher in NPDR in all macular subfields.
The interaction effect was not significant in ORT and TRT (P ≥ 0.08) and marginally significant in IRT (P = 0.06). IRT, ORT, and TRT were similar among disease stage groups (P ≥ 0.3) but differed among macular subfields (P < 0.001).
Intensity Measurements.
There was no significant interaction effect between disease stage and location on intensity measurements (P ≥ 0.5). There was only a significant main effect of disease stage on INLI (P = 0.04). All other intensity measurements were similar among disease stage groups (P ≥ 0.1). As shown in Figure 5, INLI was higher in NPDR in all macular subfields than that in CNTL (P = 0.04). All intensity measurements showed differences among macular subfields (P ≤ 0.001).
There was no significant interaction effect between disease stage and location on IRI, ORI, and TRI (P ≥ 0.86). IRI, ORI, and TRI were similar among disease stage groups (P ≥ 0.19) but differed among macular subfields (P < 0.001).
Discussion
In the current study, we report an en face OCT imaging method to quantitatively assess thickness and reflectance alterations of individual retinal layers in non-diabetic control subjects and diabetic subjects with and without DR The method allows spatial localization of both thickness and reflectance alterations in individual retinal layers, offering a comprehensive assessment of retinal anatomy that can potentially identify macular regions that are more susceptible to damage from DR.
Alterations in thickness of individual retinal layers were detected among the disease stage groups in the current study. NFL thickness was found to be reduced in NDR subjects, in agreement with previous studies that reported peripheral NFL thinning in diabetics with no or minimal retinopathy, suggesting neuronal loss at early stages of retinopathy.10–13 However, the finding of GCLIPL thickening in NPDR subjects was different from previous studies that reported similar10 or reduced GCLIPL thickness.8,14 In the current study, ONL thickness was increased in NDR subjects, in agreement with the finding in a previous study,36 and different from that in another study that reported similar ONL thickness in NDR and CNTL subjects.10 Differences in the findings may be attributed to small sample size of the current study, technical and methodological differences, and variations in the study populations.
In the current study, increased INL reflectance was observed in NPDR subjects. This finding is consistent with that in a previous study that reported the presence of hyper-reflective spots in inner retinal layers of NPDR subjects, particularly the INL, which had the largest number of spots among inner retinal layers.37 As previously reported,38 alterations of en face retinal layer reflectance indicate pathological changes, including intraretinal fluid and hard exudates. For example, intraretinal fluid resulted in decreased layer reflectance, while hard exudates appeared as localized areas of hyperreflectivity. At early stages of diabetic retinopathy, the initial development of these intraretinal pathologies likely result in subtle reflectance changes in individual retinal layers by OCT imaging, which may not be evident by conventional retinal imaging due to light reflectance from different layers. Future longitudinal studies are needed to substantiate the potential of intensity measurements as biomarkers for development of DR and progression from preclinical to clinical stage.
The study had certain limitations. Automated detection of retinal layer boundaries was limited by OCT B-scan image quality and retinal layer architecture integrity. In some instances, correction of the automated layer segmentation by manual intervention was implemented. However, subjective errors during this process were minimized by obtaining the new layer segmentation with the same graph theory framework applied to a narrow region of image defined by the user, and not from a manually specified line. The high correlation between thickness measurements obtained using two independent software algorithms further established data reliability. Nevertheless, automated image segmentation and identification of retinal layer interfaces may not be feasible for images obtained in subjects with advanced DR pathologies that cause gross disturbances in retinal layer integrity, such as may be seen in cystoid macular edema. Retinal layer intensity measurements can be affected by variations in ocular opacity and focus depth of the OCT instrument and may limit comparison of measurements among subjects. One way to adjust for this variation is to normalize intensity measurements to the RPE intensity in each subject. However, RPEI averaged over nine macular subfields was nearly identical in CNTL (204 ± 3), NDR (204 ± 4), and NPDR subjects (204 ± 3), such that there was no effect of disease stage on RPEI (P = 1.0). Furthermore, the mean RPE intensity variation among disease groups averaged over the 9 macular subfields was only 0.6%, indicating similar intensities among subjects. Therefore, differences in ocular opacity and focus depth did not likely affect comparison of intensity measurements among groups. Finally, despite the small sample size in some groups, statistically significant differences were detected in thickness and intensity measurements. Future studies with a larger sample size that account for potential confounding factors are needed to substantiate the current findings and reveal differences not discernable with this sample size.
Overall, depth and spatially-resolved measurements of retinal thickness and reflectance are potential biomarkers for monitoring DR development, progression, and response to therapeutic interventions.
Acknowledgments
Supported by National Institutes of Health Grants DK010439 and EY001792, Department of Veterans Affairs, Senior Scientific Investigator award from Research to Prevent Blindness (MS), and an unrestricted departmental grant from Research to Prevent Blindness.
Disclosure: J. Wanek, None; N.P. Blair, None; F.Y. Chau, None; J.I. Lim, None; Y.I. Leiderman, None; M. Shahidi, None
References
- 1. Wild S,, Roglic G,, Green A,, Sicree R,, King H. Global prevalence of diabetes: estimates for the year 2000 and projections for 2030. Diabetes Care. 2004; 27: 1047–1053. [DOI] [PubMed] [Google Scholar]
- 2. Chiu SJ,, Allingham MJ,, Mettu PS,, Cousins SW,, Izatt JA,, Farsiu S. Kernel regression based segmentation of optical coherence tomography images with diabetic macular edema. Biomed Opt Express. 2015; 6: 1172–1194. [DOI] [PMC free article] [PubMed] [Google Scholar]
- 3. Chiu SJ,, Li XT,, Nicholas P,, Toth CA,, Izatt JA,, Farsiu S. Automatic segmentation of seven retinal layers in SDOCT images congruent with expert manual segmentation. Opt Express. 2010; 18: 19413–19428. [DOI] [PMC free article] [PubMed] [Google Scholar]
- 4. Garvin MK,, Abramoff MD,, Wu X,, Russell SR,, Burns TL,, Sonka M. Automated 3-D intraretinal layer segmentation of macular spectral-domain optical coherence tomography images. IEEE Trans Med Imaging. 2009; 28: 1436–1447. [DOI] [PMC free article] [PubMed] [Google Scholar]
- 5. Huang Y,, Danis RP,, Pak JW,, et al. Development of a semi-automatic segmentation method for retinal OCT images tested in patients with diabetic macular edema. PLoS One. 2013; 8: e82922. [DOI] [PMC free article] [PubMed] [Google Scholar]
- 6. Srinivasan PP,, Heflin SJ,, Izatt JA,, Arshavsky VY,, Farsiu S. Automatic segmentation of up to ten layer boundaries in SD-OCT images of the mouse retina with and without missing layers due to pathology. Biomed Opt Express. 2014; 5: 348–365. [DOI] [PMC free article] [PubMed] [Google Scholar]
- 7. Vermeer KA,, van der Schoot J, Lemij HG, de Boer JF. Automated segmentation by pixel classification of retinal layers in ophthalmic OCT images. Biomed Opt Express. 2011; 2: 1743–1756. [DOI] [PMC free article] [PubMed] [Google Scholar]
- 8. Bandello F,, Tejerina AN,, Vujosevic S, et al. EVICR.net. Retinal layer location of increased retinal thickness in eyes with subclinical and clinical macular edema in diabetes type 2. Ophthalmic Res. 2015; 54: 112–117. [DOI] [PubMed] [Google Scholar]
- 9. Murakami T,, Yoshimura N. Structural changes in individual retinal layers in diabetic macular edema. J Diabetes Res. 2013; 2013: 920713. [DOI] [PMC free article] [PubMed] [Google Scholar]
- 10. Vujosevic S,, Midena E. Retinal layers changes in human preclinical and early clinical diabetic retinopathy support early retinal neuronal and Muller cells alterations. J Diabetes Res. 2013; 2013: 905058. [DOI] [PMC free article] [PubMed] [Google Scholar]
- 11. Peng PH,, Lin HS,, Lin S. Nerve fibre layer thinning in patients with preclinical retinopathy. Can J Ophthalmol. 2009; 44: 417–422. [DOI] [PubMed] [Google Scholar]
- 12. van Dijk HW,, Verbraak FD,, Kok PH,, et al. Early neurodegeneration in the retina of type 2 diabetic patients. Invest Ophthalmol Vis Sci. 2012; 53: 2715–2719. [DOI] [PMC free article] [PubMed] [Google Scholar]
- 13. Verma A,, Raman R,, Vaitheeswaran K,, et al. Does neuronal damage precede vascular damage in subjects with type 2 diabetes mellitus and having no clinical diabetic retinopathy? Ophthalmic Res. 2012; 47: 202–207. [DOI] [PubMed] [Google Scholar]
- 14. Chhablani J,, Sharma A,, Goud A,, et al. Neurodegeneration in type 2 diabetes: evidence from spectral-domain optical coherence tomography. Invest Ophthalmol Vis Sci. 2015; 56: 6333–6338. [DOI] [PubMed] [Google Scholar]
- 15. Forooghian F,, Stetson PF,, Meyer SA,, et al. Relationship between photoreceptor outer segment length and visual acuity in diabetic macular edema. Retina. 2010; 30: 63–70. [DOI] [PMC free article] [PubMed] [Google Scholar]
- 16. Maheshwary AS,, Oster SF,, Yuson RM,, Cheng L,, Mojana F,, Freeman WR. The association between percent disruption of the photoreceptor inner segment-outer segment junction and visual acuity in diabetic macular edema. Am J Ophthalmol. 2010; 150: 63–67. [DOI] [PMC free article] [PubMed] [Google Scholar]
- 17. Biedermann BR,, Wieser W,, Eigenwillig CM,, et al. Real time en face Fourier-domain optical coherence tomography with direct hardware frequency demodulation. Opt Lett. 2008; 33: 2556–2558. [DOI] [PMC free article] [PubMed] [Google Scholar]
- 18. Cucu RG,, Podoleanu AG,, Rogers JA,, Pedro J,, Rosen RB. Combined confocal/en face T-scan-based ultrahigh-resolution optical coherence tomography in vivo retinal imaging. Opt Lett. 2006; 31: 1684–1686. [DOI] [PubMed] [Google Scholar]
- 19. Sallo FB,, Peto T,, Egan C, et al. MacTel Study Group. “En face” OCT imaging of the IS/OS junction line in type 2 idiopathic macular telangiectasia. Invest Ophthalmol Vis Sci. 2012; 53: 6145–6152. [DOI] [PMC free article] [PubMed] [Google Scholar]
- 20. Alkabes M,, Salinas C,, Vitale L,, Burés-Jelstrup A,, Nucci P,, Mateo C. En face optical coherence tomography of inner retinal defects after internal limiting membrane peeling for idiopathic macular hole. Invest Ophthalmol Vis Sci. 2011; 52: 8349–8355. [DOI] [PubMed] [Google Scholar]
- 21. Clamp MF,, Wilkes G,, Leis LS,, et al. En face spectral domain optical coherence tomography analysis of lamellar macular holes. Retina. 2014; 34: 1360–1366. [DOI] [PubMed] [Google Scholar]
- 22. Ferrara D,, Mohler KJ,, Waheed N,, et al. En face enhanced-depth swept-source optical coherence tomography features of chronic central serous chorioretinopathy. Ophthalmology. 2014; 121: 719–726. [DOI] [PMC free article] [PubMed] [Google Scholar]
- 23. Forte R,, Pascotto F,, Napolitano F,, Cennamo G,, de Crecchio G. En face optical coherence tomography of macular holes in high myopia. Eye (Lond). 2007; 21: 436–437. [DOI] [PubMed] [Google Scholar]
- 24. Forte R,, Pascotto F,, Soreca E,, Cusati G,, de Crecchio G. Posterior retinal detachment without macular hole in high myopia: visualization with en face optical coherence tomography. Eye (Lond). 2007; 21: 111–113. [DOI] [PubMed] [Google Scholar]
- 25. Puche N,, Querques G,, Blanco-Garavito R,, et al. En face enhanced depth imaging optical coherence tomography features in adult onset foveomacular vitelliform dystrophy. Graefes Arch Clin Exp Ophthalmol. 2014; 252: 555–562. [DOI] [PubMed] [Google Scholar]
- 26. Reznicek L,, Dabov S,, Kayat B,, et al. Scanning laser 'en face' retinal imaging of epiretinal membranes. Saudi J Ophthalmol. 2014; 28: 134–138. [DOI] [PMC free article] [PubMed] [Google Scholar]
- 27. Rispoli M,, Le Rouic JF,, Lesnoni G,, Colecchio L,, Catalano S,, Lumbroso B. Retinal surface en face optical coherence tomography: a new imaging approach in epiretinal membrane surgery. Retina. 2012; 32: 2070–2076. [DOI] [PubMed] [Google Scholar]
- 28. van Velthoven ME,, Verbraak FD,, Garcia PM,, Schlingemann RO,, Rosen RB,, de Smet MD. Evaluation of central serous retinopathy with en face optical coherence tomography. Br J Ophthalmol. 2005; 89: 1483–1488. [DOI] [PMC free article] [PubMed] [Google Scholar]
- 29. van Velthoven ME,, Verbraak FD,, Yannuzzi LA,, Rosen RB,, Podoleanu AG,, de Smet MD. Imaging the retina by en face optical coherence tomography. Retina. 2006; 26: 129–136. [DOI] [PubMed] [Google Scholar]
- 30. Kiernan DF,, Zelkha R,, Hariprasad SM,, Lim JI,, Blair MP,, Mieler WF. En face spectral-domain optical coherence tomography outer retinal analysis and relation to visual acuity. Retina. 2012; 32: 1077–1086. [DOI] [PMC free article] [PubMed] [Google Scholar]
- 31. Wanek J,, Zelkha R,, Lim JI,, Shahidi M. Feasibility of a method for en face imaging of photoreceptor cell integrity. Am J Ophthalmol. 2011; 152: 807–814. [DOI] [PMC free article] [PubMed] [Google Scholar]
- 32. Mohammad F,, Wanek J,, Zelkha R,, Lim JI,, Chen J,, Shahidi MA. Method for en face OCT imaging of subretinal fluid in age-related macular degeneration. J Ophthalmol. 2014; 2014: 720243. [DOI] [PMC free article] [PubMed] [Google Scholar]
- 33. Mohammad F,, Ansari R,, Wanek J,, Francis A,, Shahidi M. Feasibility of level-set analysis of enface OCT retinal images in diabetic retinopathy. Biomed Opt Express. 2015; 6: 1904–1918. [DOI] [PMC free article] [PubMed] [Google Scholar]
- 34. Early Treatment Diabetic Retinopathy Study design and baseline patient characteristics. ETDRS report number 7. Ophthalmology. 1991; 98: 741–756. [DOI] [PubMed] [Google Scholar]
- 35. Song WK,, Lee SC,, Lee ES,, Kim CY,, Kim SS. Macular thickness variations with sex age, and axial length in healthy subjects: a spectral domain-optical coherence tomography study. Invest Ophthalmol Vis Sci. 2010; 51: 3913–3918. [DOI] [PubMed] [Google Scholar]
- 36. Chen Y,, Li J,, Yan Y,, Shen X. Diabetic macular morphology changes may occur in the early stage of diabetes. BMC Ophthalmol. 2016; 16: 12. [DOI] [PMC free article] [PubMed] [Google Scholar]
- 37. Vujosevic S,, Bini S,, Midena G,, Berton M,, Pilotto E,, Midena E. Hyperreflective intraretinal spots in diabetics without and with nonproliferative diabetic retinopathy: an in vivo study using spectral domain OCT. J Diabetes Res. 2013; 2013: 491835. [DOI] [PMC free article] [PubMed] [Google Scholar]
- 38. Francis AW,, Wanek J,, Lim JI,, Shahidi M. Enface thickness mapping and reflectance imaging of retinal layers in diabetic retinopathy. PLoS One. 2015; 10: e0145628. [DOI] [PMC free article] [PubMed] [Google Scholar]