

Abstract
Several methods have been proposed to increase power in rare variant association testing by aggregating information from individual rare variants (MAF<0.005). However, how to best combine rare variants across multiple ethnicities and the relative performance of designs using different ethnic sampling fractions remains unknown. In this study, we compare the performance of several statistical approaches for assessing rare-variant associations across multiple ethnicities. We also explore how different ethnic sampling fractions perform, including single-ethnicity studies and studies that sample up to four ethnicities. We conducted simulations based on targeted sequencing data from 4,611 women in four ethnicities (African, European, Japanese American, and Latina). As with single-ethnicity studies, burden tests had greater power when all causal rare variants were deleterious, and variance component-based tests had greater power when some causal rare variants were deleterious and some were protective. Multi-ethnic studies had greater power than single-ethnicity studies at many loci, with inclusion of African Americans providing the largest impact. On average, studies including African Americans had as much as 20% greater power than equivalently-sized studies without African Americans. This suggests that association studies between rare variants and complex disease should consider including subjects from multiple ethnicities, with preference given to genetically diverse groups.
Keywords: Fine-mapping, Sequencing study design, Statistical genetics, Study subject selection, Multiethnic meta-analysis
Introduction
Despite the successes of genome-wide association studies (GWAS), which have identified hundreds of common variants associated with complex diseases and traits, the genetic basis of these traits has not been fully explained.1–4 It is likely that rare variants contribute to the remaining heritability, 5,6 but to which extent remains an important open empirical question. Individual rare variants (defined here as minor allele frequency (MAF) < 0.005) are difficult to study, as they require prohibitively large samples sizes to have adequate power to detect realistic effect sizes. As an alternative, many methods have been proposed for aggregating information from individual rare variants.7–14 However, these have been proposed in the context of studies conducted in a single ethnicity. It remains an open question how to best combine rare variants in association testing across ethnicities in a multi-ethnic study, and the relative performance of designs using optimal sampling fraction across ethnicities remains unknown.
Previous studies evaluating the performance of aggregate rare-variant tests have often used simulated genotype data,9–12 which may not adequately capture all of the properties of empirical data. Those studies that have used empirical sequencing data have been restricted to small sample sizes (under 2,000).15–17 Importantly, most previous studies do not consider multi-ethnic populations, and when they do, they focus on samples drawn from at most two ethnic groups 18,19 or from within one continental population.20–22
We address some of these gaps using simulations based on empirical targeted sequencing data from 4,611 women in four ethnicities (African American, European American, Japanese, Latino). It is well established that multi-ethnic designs can aid in identifying the causal variant in the context of fine-mapping GWAS-identified loci;23 whether multi-ethnic designs increase the power of aggregate rare-variant tests remains an open question. We compare the performance of several statistical approaches for combining evidence for rare-variant association across multi-ethnic samples. We also investigate optimal ethnic sampling fractions when samples of multiple ethnicities are available.
Our findings suggest that a multi-ethnic study that includes African American subjects may be advantageous since it leverages the greater genetic diversity among Africans.
Materials and Methods
Breast Cancer Targeted Sequencing Data
We generated next-generation sequencing data targeting 12 regions (Supplementary Table I) spanning 5,500kb on 2,316 breast cancer cases and 2,295 controls from three cohorts (the Nurses' Health Study 24, the Nurses' Health Study II 25 and the Multiethnic Cohort 26). Our study population is ethnically diverse with 937 women of African-American ancestry, 907 women of Latino ancestry and 1,256 women of Japanese ancestry from the Multiethnic Cohort (MEC) and 1,511 women of European ancestry from Nurses' Health Study (NHS) and Nurses' Health Study II (NHSII) (Table I). Boundaries of targeted regions were defined by recombination hotspots flanking single nucleotide polymorphisms with published genome-wide-significant associations to breast cancer risk. These regions contained 74 genes, ranging in length from 0.4 kb to 910 kb, for a total of 182 kb of exonic sequence. Target capture was performed using custom Agilent baits, and high-depth sequencing was performed at the Broad Institute using the Illumina HiSeq platform. Reads were aligned using BWA and genotypes called using GATK in batches of approximately 100 samples27–30. Batches were balanced with respect to ethnicity and case-control status. Over 97% of bases in coding regions had >20× coverage, with a mean coverage of 174×. All of the subjects were previously genotyped using Illumina HumanHap arrays. Concordance in genotype calls at variable sites was over 99.7% across four pairs of duplicate samples; concordance between sequencing genotype calls and GWAS genotypes was also over 99.7%.
Table I. Study Subject Count by Cohort and Ethnicity.
| Cohort | Ethnicity | Total (% Subjects) |
|---|---|---|
| African American | 937 (20%) | |
| MEC | Japanese American | 1,256 (27%) |
| Latino American | 907 (20%) | |
|
| ||
| NHS | European American | 1,511 (33%) |
|
| ||
| All | 4,611 (100%) | |
Sequencing was performed for subjects from three cohorts — Multiethnic Cohort (MEC) and Nurses' Health Studies (NHS) I and II. Ethnicity refers to self-reported ancestry validated by GWAS data.
We used SnpEff to annotate coding variants, and restricted analysis to non-synonymous SNPs and stop-gain, stop-lost, start-lost, and splice site donor or acceptor variants31.
Simulated case-control data sets
For the 47 genes that had at least one non-synonymous variable site, we simulated case-control studies under the null hypothesis that the gene was not associated with disease risk. In addition, we simulated data under four alternative scenarios that were characterized by two conditions: the absolute value of the allele-specific log relative risk was either constant or inversely proportional to the minor allele frequency, and the minor alleles at causal loci were either all deleterious or a mixture of deleterious and protective alleles.
Case and control genotypes from each ethnic group were sampled by taking random draws (with replacement) from the observed genotypes. Assuming the disease is rare, control genotypes were sampled with equal probability, while case genotypes were selected with probabilities proportional to the genotype relative risks. Specifically: for a given ethnicity, the genotype for the ith control g0i = (gi1, …, giJk) in gene k was set equal to gλ = (gλ1, …, gλJk) where λ is drawn from the set of subject indices for the observed data {l=1, …, L} with probability Pr(λ=l)=π0l=L-1. Here gij is the observed genotype at variable site j for the ith individual in a particular ethnicity; L is the total number of subjects sequenced in that ethnicity (e.g. L=937 for African Americans); and Jk is the number of rare varying sites (MAF<0.005 in the pooled sample of 4,611 women) in gene k. Genotypes for cases were sampled based on a specified log relative risk, setting
Here βj is the log relative risk for variable site j, defined by the simulated penetrance model. Setting IPro,j equal to 1 if minor allele j has a causal protective effect and 0 for a deleterious effect; setting IMD equal to 1 if there is MAF dependence and 0 otherwise; and setting ICau,j equal to 1 if variant j is causal and 0 otherwise, the log relative risk for the minor allele at site j is:
Here β is defined so that the mean relative risk over causal variants is equal to a target value β̄ ∈ {1.5,2.5,3.0,4.0}:
For all alternatives, we assumed that a fraction of rare variants (pCau) were causal and generated the indicator ICau,j for each SNP from a Bernoulli(pCau) distribution. For alternatives where causal variants were a mixture of protective and deleterious variants, we assumed that a fraction of causal variants (pPro|Cau) were protective (IPro,j i.i.d. Bernoulli(pPro|Cau)). ICau,j was shared across ethnicity but IPro,j was drawn independently for each ethnicity, introducing heterogeneity across ethnicities for some scenarios.
Association tests
For each gene k, we tested for association between rare variants and case-control status within each ethnicity separately using two aggregate association approaches: a burden test12 and the Sequence Kernel Association Test (SKAT)32. Both of these approaches test the null hypothesis:
The burden test collapses all rare alleles within a gene by creating an indicator variable Xeik which is equal to 1 if subject i in ethnicity e carries any rare variant in gene k and 0 otherwise. Logistic regression is then used to test the association between case-control status and Xeik by fitting the model
and comparing to a central chi-squared 1 df distribution.
SKAT is equivalent to the score test for τ2 = 0 from a random effects model where the βjs are normally distributed with mean 0 and variance wej2 τ2 32. We used the default setting for SKAT and set wej=Beta(MAFej,1,25), where MAFej is the minor allele frequency in subjects of ethnicity e sample. The SKAT test statistic for association in ethnicity e is
where Sej = Σigeij(yei − μei) and μei is the expected value of case-control status Y for subject i in ethnicity e under the null. SKAT can adjust for covariates (such as genome-wide genetic principal components) by incorporating them in the model for μei. For simplicity we simulated and fit models without any covariate effects; in this case μei=μe and is simply the proportion of cases in the sample from ethnicity e. The statistic Qe is distributed as a mixture of chi-squared random variables, where the mixing proportions depend on the weights and genetic covariance in ethnicity e.
Burden-test meta-analysis
Standard fixed-effect meta-analysis techniques can be applied to the ethnic-specific estimates of θ̂ek to test the null hypothesis that θ1k =…= θEk = 0 (E is the total number of ethnic groups considered). We consider three meta-analysis approaches. The first approach is based on the inverse-variance weighted estimate of the mean effect of carrying any rare variant across ethnicities. If the causal effects or allele frequencies at the causal variants differ greatly across ethnicity—in particular, if some causal variants are monomorphic in one or more populations—then the true θeks may differ across ethnicity, and the average effect may be small—causing the inverse variance weighted test to lose power. 33,34
The second and third approaches account for possible heterogeneity in θek, at the cost of increased degrees of freedom. The second approach tests for heterogeneity in the ethnic-specific effects using Cochran's Q and has E-1 degrees of freedom. The third approach is a joint test of mean effect and heterogeneity that sums the fixed-effect test of the overall mean and Cochran's Q. Because these tests are independent, the joint test has E degrees of freedom. 33,34
SKAT and SKAT-O meta-analysis
We assume that the allelic effects βj are constant across ethnicity, and calculate a homogeneous and heterogeneous MetaSKAT statistic (Hom-Meta-SKAT and Het-Meta-SKAT) proposed by Lee et al.35:
Under the null, these statistics are also distributed as a mixture of chi-squared variables, where the mixing proportions depend on the ethnic-specific weights and genetic covariance matrices.
To apply SKAT-O, described by Lee et al35 as an optimal linear combination of burden and SKAT statistics, we selected “optimal” instead of the default method in the MetaSKAT_wZ function of the MetaSKAT package in R software.
Comparing studies with different ethnic sample fractions
We selected 14 different combinations of samples from at least two of four ethnicities (African American, European American, Japanese, and Latino) to construct studies with a total of 3,520 total subjects (tri-ethnic samples have 3,522 subjects). For all of these combinations the case-control ratio within each ethnic group was 1:1. We chose four combinations that included subjects from all four ethnicities but had differing proportions of ancestries (4:1:1:2, 2:1:1:1, 3:2:1:2, or 1:1:1:1 of African American, European American, Japanese, and Latino subjects, respectively). We also simulated populations by selecting equal numbers of individuals from three out of the four ethnicities at a time (four combinations) and finally from only two of the four ethnicities (six combinations).
Results
We hypothesized that there may be differences in rare variant association test performance due to both choice of rare variant test statistic and ethnic sampling fractions since rare variant tests are better powered in study populations with a higher number of varying sites. Distributions of rare variants by ethnicity and gene are given in Tables II-III and Figure I. Consistent with previous reports4,36,37, African Americans have the highest number of rare varying sites, followed by Latinos. Consequently, the carrier proportion (the fraction of subjects carrying at least one rare, non-synonymous or truncating allele in a gene) is highest in these populations (Table II). For most genes, the carrier proportion (CP) was less than 2%, except in African Americans (median CP = 2.6%). Table III lists summary values for ten genes with the five highest and five lowest overall CP.
Table II. Gene Counts by Carrier Proportion and Self-Reported Ethnicity.
| Carrier Proportion (CP) | African American | European American | Japanese American | Latino | All |
|---|---|---|---|---|---|
| CP = 0 | 24 (32%) | 27 (36%) | 27 (36%) | 25 (34%) | 23 (31%) |
| 0 < CP ≤ 0.01 | 12 (16%) | 20 (27%) | 18 (24%) | 21 (28%) | 18 (24%) |
| 0.01 < CP ≤ 0.02 | 6 (8%) | 14 (19%) | 12 (16%) | 12 (16%) | 10 (14%) |
| 0.02 < CP ≤ 0.03 | 10 (14%) | 4 (5%) | 5 (7%) | 7 (9%) | 10 (14%) |
| CP > 0.03 | 22 (30%) | 9 (12%) | 12 (16%) | 9 (12%) | 13 (18%) |
| All CP | 74 (100%) | 74 (100%) | 74 (100%) | 74 (100%) | 74 (100%) |
We observed variants in 74 distinct SnpEff annotated genes. Carrier proportion (CP) is defined as the number of individuals of a given ancestry who carry ≥ 1 non-synonymous (NS) rare variant divided by the number of individuals of that ancestry. Table displays count and (percent) of genes according to carrier proportion for each self-reported ancestry. ‘All’ refers to study participants from all ancestries combined. There were no NS rare variants observed in any ancestry for 23 of the 74 genes.
Table III. Variant, Median Singleton, and Carrier Proportion for Genes with Highest and Lowest Carrier Proportions.
| Subjects with rare NS variant count | |||||||||
|---|---|---|---|---|---|---|---|---|---|
|
| |||||||||
| Gene | Chr | # Total | # Rare | Singleton Proportion | 0 | 1 | 2 | 3+ | Carrier Proportion |
| TACC2 | 10 | 255 | 230 | 0.53 | 3,823 | 679 | 76 | 33 | 17.1% |
| MYO9B | 19 | 158 | 151 | 0.46 | 4,235 | 351 | 25 | 0 | 8.2% |
| ANKLE1 | 19 | 82 | 71 | 0.45 | 4,260 | 321 | 21 | 9 | 7.6% |
| FAM129C | 19 | 67 | 61 | 0.48 | 4,299 | 286 | 25 | 1 | 6.8% |
| ZFYVE26 | 14 | 131 | 121 | 0.66 | 4,348 | 253 | 9 | 1 | 5.7% |
|
| |||||||||
| HAUS8 | 19 | 40 | 36 | 0.67 | 4,545 | 65 | 1 | 0 | 1.4% |
| PGLS | 19 | 20 | 19 | 0.53 | 4,548 | 63 | 0 | 0 | 1.4% |
| ABHD8 | 19 | 20 | 19 | 0.47 | 4,551 | 59 | 1 | 0 | 1.3% |
| BTBD16 | 10 | 23 | 21 | 0.62 | 4,553 | 58 | 0 | 0 | 1.3% |
| DDA1 | 19 | 7 | 7 | 0.43 | 4,565 | 46 | 0 | 0 | 1.0% |
|
| |||||||||
| Median | --- | 32 | 29 | 0.58 | 4,527 | 75 | 1 | 0 | 1.8% |
Chr = Chromosome; Total = Varying non-synonymous(NS) sites observed in study population; Rare = Varying sites with minor allele frequency (MAF) < 0.005, a subset of Total; Singleton Proportion - Median number of singleton sites as described in Figure I as a proportion of Rare; ‘0’, ‘1’, ‘2’, and ‘3+’ - Number of subjects out of 4,611 with 0, 1, 2, and 3 or more NS rare minor alleles. Carrier Proportion - Proportion of study subjects with at least one rare, NS minor allele.
Figure 1.

Observed total non-singleton sites in subjects of each ethnicity for the sample size indicated in legend. Bars display median counts of singletons, doubletons and tripletons for 500 bootstrap samples of 907 subjects from each ethnicity.
Defining rare variants according to ethnic-specific instead of study population MAF increases the number of rare variants and CP in each ethnicity. This alternate definition did not change the relative ordering of gene CP by ethnicity. On average, African American subjects had the highest gene-specific rare variant burden using either definition. A full listing of study-wide and ethnic-specific CP is included in Supplementary Table II.
We first evaluated rare variant association meta-analysis techniques under the null. In individual ethnic groups, we examined Type I error rates of the burden test and SKAT (Figure II, green boxes). In addition to the false positive rate, we explored a measure of test statistic inflation, λ for individual ethnic groups (Figure III, left with blue shading) and all five meta-analysis techniques. For the 33/47 of genes with an overall CP higher than 0.01, both the burden test and SKAT adequately controlled the Type I error rate. The burden test had deflated Type I error when the overall CP was less than 0.01. For some of the genes with overall CP less than 0.01, the deflation in the burden test for some ethnic groups was considerable (e.g. λ was less than 0.5 in European and Japanese ancestry subjects for RMND1), owing to the low CP (the RMND1 CPs for European and Japanese ancestry subjects were both 0.002). The SKAT test statistic was generally not dramatically deflated for genes with CPs less than 0.01, although 5 out of 14 genes with low CP (<0.01) had λ < 0.85 in at least one ethnic group.
Figure 2.
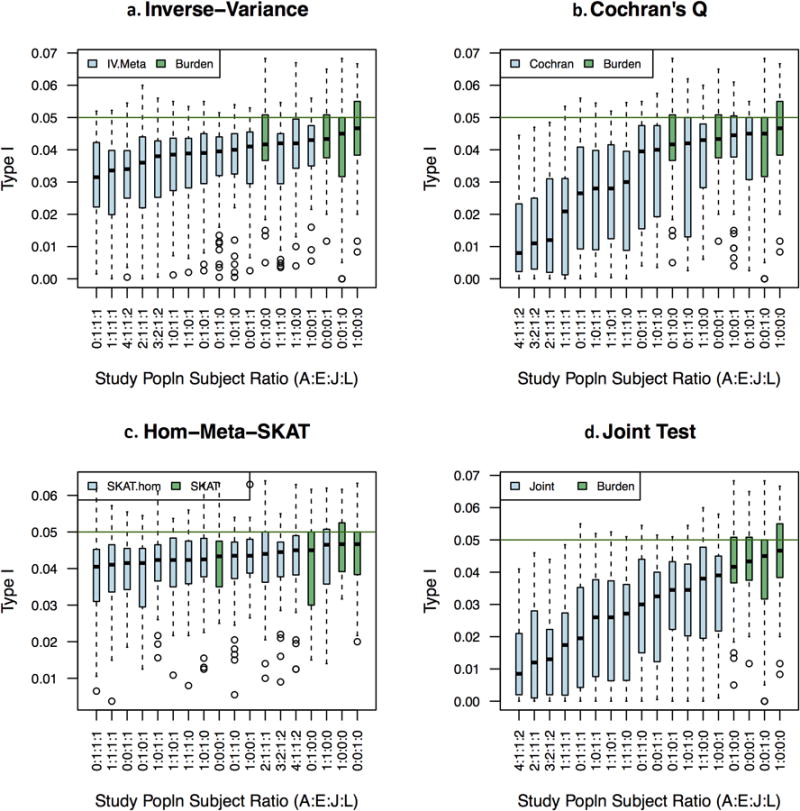
Type I error (at nominal 5% alpha) for individual ethnic results and several sampling fractions Panels a-d each contain vertical box-plots of gene Type I error (false positive) rates for indicated metaanalysis statistic. Green horizontal line is placed at the nominal type I error rate of alpha=0.05. The X-axis lists study populations as a ratio of African American, European American, Japanese American, and Latina subjects. Box plots are arranged from left to right by increasing median Type I error rate for fourteen multiethnic and four mono-ethnic study populations. Green box plots are burden (panels a,b, and d) or SKAT tests (panel c) in a mono-ethnic population.
Figure 3.
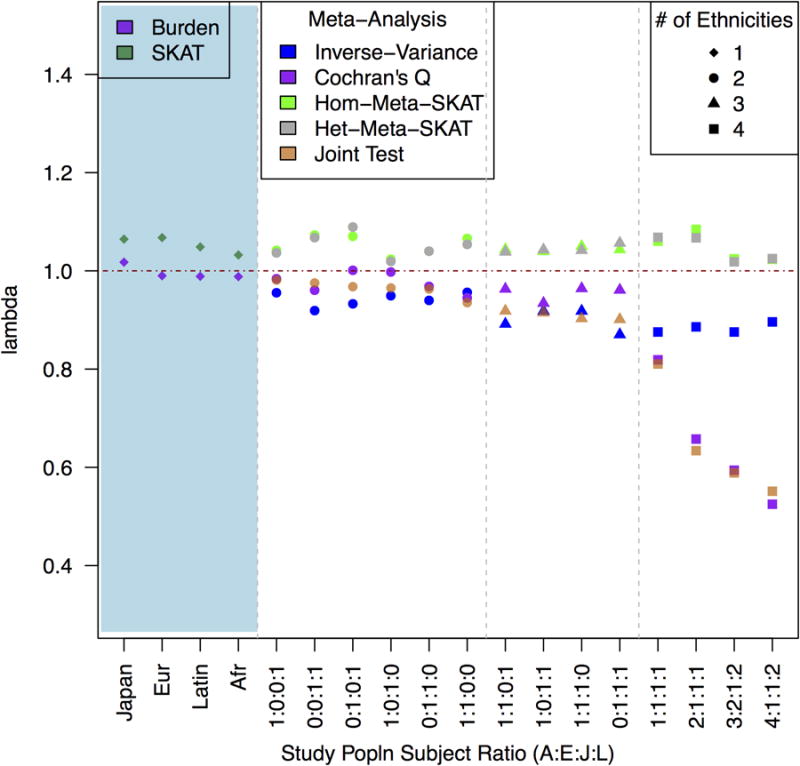
The blue-shaded portion to the left shows median λ for burden and SKAT tests in four monoethnic populations. Median λ is shown to the right by decreasing joint test lambda GC for five color-coded metaanalysis statistics. X-axis lists study populations as a ratio of African American, European, Japanese, and Latino subjects.
For most multi-ethnic designs, the meta-analyses based on the burden test--the inverse variance weighted meta-analysis, Cochran's Q, and the joint test--all showed deflation (median λ < 0.95; Figure II). SKAT meta-analysis test statistics (het and hom) were slightly inflated (median λ >1.04; Figure III). As with the single-ethnicity analyses, the deflation for the burden test statistics was greater for genes with overall CP less than 0.01. Cochran's Q and joint tests had notably miniscule inflation factors (λ <0.7) for designs that included all four ethnicities. The most extreme inflation factors (Cochran's Q λ < 0.5) were for genes where the CP in European, Latino or Japanese subjects was 0.005 or less.
We next considered how power to detect causal association was influenced by penetrance model, design, and overall CP (Figures IV and V). Consistent with previous reports 32, the burden test has higher power than SKAT when all of the causal variants are deleterious, but SKAT has higher power than the burden test when an appreciable proportion of the causal variants are protective. Reducing the total proportion of causal variants gave qualitatively similar results, however the advantage of the fixed-effect burden test when all causal variants were deleterious declined as we lowered the proportion of deleterious causal sites to 10% (Supplementary Figure II, Supplementary Table III, Supplementary Table IV). When only 10% of the rare variants were causal, MetaSKAT had better power than the fixed-effect burden test. Hom-Meta-SKAT and Het-Meta-SKAT have roughly the same power, although when all causal rare variants are deleterious, Hom-Meta-SKAT has slightly greater power. This is consistent with previous reports when the majority of genetic effects are shared across studies.35 The two techniques for meta-analyzing burden test results while accounting for possible heterogeneity in effects across ethnicity—the joint test and Cochran's Q—both had relatively low power. In the scenarios plotted in Figure V, for example, Cochran's Q had less than 20% power, while all other tests had greater than 25% power.
Figure 4.
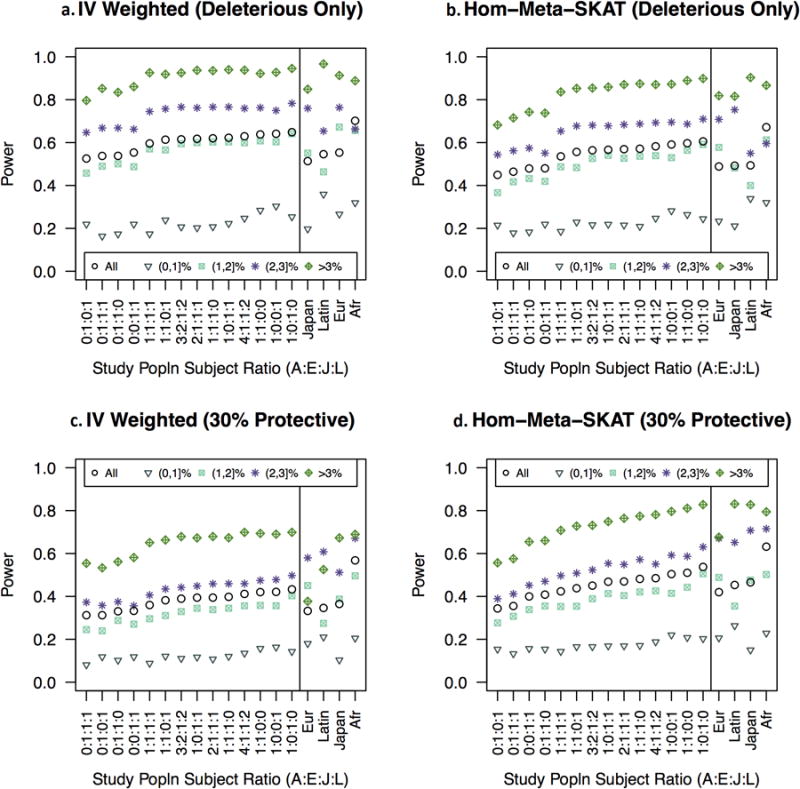
In panels a and b, all causal variants are deleterious. In lower panels, a portion of causal variants are protective. Panels a and c display burden tests and meta-analysis of burden tests. Panels b and d display MetaSKAT and SKAT tests. Within each panel, left field shows statistical power for all genes by CP and by overall CP for fourteen multi-ethnic populations. Study populations are ordered by increasing mean power for all genes from left to right. In the far right field of each panel, four ethnicities are arranged from left to right by mean power for all genes. Mean power is shown for genes in each category of ethnic-specific CP for the indicated ethnicity. Legend: Overall CP was estimated in a population of 4,611 women as the proportion of women carrying at least one rare variant. Ethnicity specific CP was estimated in each ethnicity as the proportion of women of that ethnicity who carry at least one rare variant.
Figure 5.
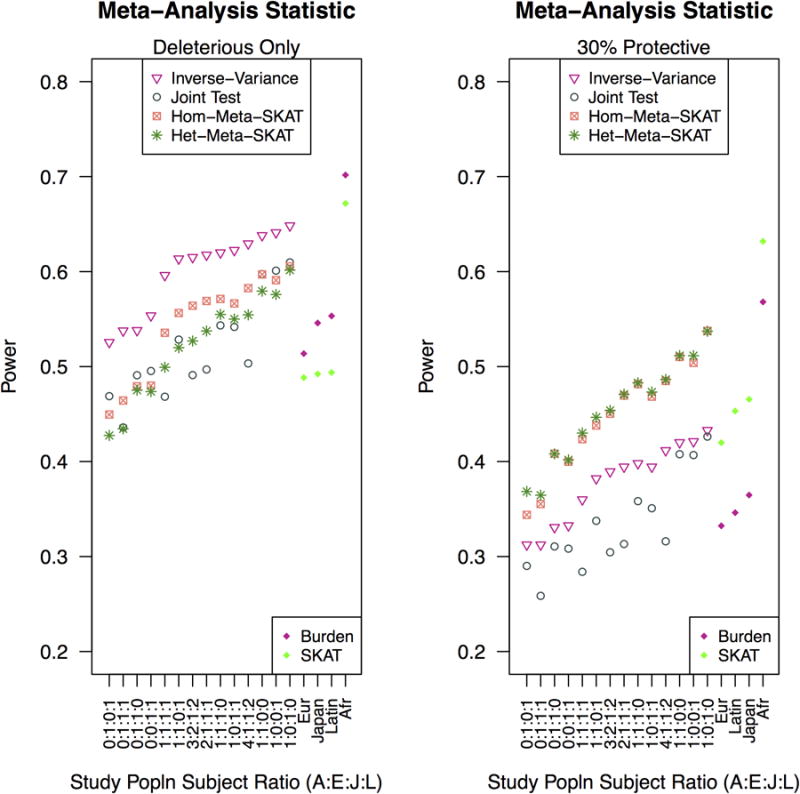
Both penetrance models use a RR of 2.5. In the left panel, all causal variants are deleterious and in the right panel, a portion of causal variants are protective. Multiethnic study populations are arranged in the same order for both left and right panels and power for inverse-variance meta-analysis of burden tests increases for all deleterious causal variants increases from left to right. Again, X-axis depicts multiethnic study populations as the ratio of African American, European American, Japanese American and Latina subjects. Not shown: power for Cochran's Q was under 0.2 for all scenarios depicted.
The proportion of the total sample in different ethnicities affected the power of multi-ethnic meta-analyses (Figures IV and V). Fixing the total sample size, the power for the different sampling fractions we considered differed by as much as 0.25 (for models with fixed relative risks) or 0.37 (for models where the relative risk increased with decreasing MAF (Supplementary Table V). Study populations with African Americans maintained better power when the majority (70%) of causal variants were protective (Supplementary Table VI),
Notably, studies restricted to African Americans had greater power than studies of other single ethnic groups, as well as many studies that sampled multiple ethnicities. This raises the question of whether ethnicity influences power after controlling for differences in CP. In single ethnicities, power for gene-based tests grouped according to ethnic-specific CP (Supplementary Table II) were similar across the four ethnicities. Given the same CP, gene-based tests were equivalently powered regardless of ethnicity. The overall CP had a much stronger effect on power than ethnicity: the average power for genes with overall CP less than 0.01 and those with CP greater than 0.03 differed by more than 0.60 in many scenarios.
Discussion
Using empirical targeted sequencing data on a large sample of 4,611 women from four ethnic groups (African American, European American, Japanese and Latino), we evaluated the performance of several different approaches to meta-analyzing aggregate tests of association between rare variants and disease, as well as the power of designs with varying sampling fractions across the four ethnic groups.
Although Type I error rates were low for the meta-analysis techniques we explored, Type I error rates for genes with sufficient variation (CP ≥ 0.01) in all ethnicities were consistent with nominal alpha levels. Our findings are analogous to the work of Ma et al. who also observed deflated type I error rates for meta-analysis of individual sites with allele frequencies below 1% in a population of 908 subjects of Northern European ancestry.38 Choice of study subjects also influenced Type I error rates and, unlike inverse-variance meta-analysis of burden tests and MetaSKAT, which held relatively steady, Type I error for the joint test and Cochran's Q were greatly deflated for all genes as the number of ethnicities increased and subgroup sizes dropped.
We hypothesized that causal variants might be detected using tests of heterogeneity due to population private variants, but this was not the case. Both Cochran's Q and the joint test had low power to detect bidirectional and unidirectional effects compared to MetaSKAT and inverse-variance meta-analysis of the burden test. For high CP, MetaSKAT and the burden test were both well-powered to detect association when all causal variants were deleterious. The burden test meta-analysis was better powered to detect uniformly deleterious variants than MetaSKAT, but in the presence of protective effects, both MetaSKAT approaches maintained higher power. Our results suggest that Hom-Meta-SKAT is preferable to Het-Meta-SKAT. These tests were nearly indistinguishable in the presence of protective effects, but Hom-Meta-SKAT was better-powered to detect deleterious variants. Of the meta-analyses techniques explored, Hom-Meta-SKAT performed best under the alternate hypotheses while maintaining appropriate Type I error.
Study populations that included higher proportions of African Americans had more valid test statistic performance under the null and had more power to detect association using either the burden test or MetaSKAT regardless of penetrance model. This may be due to the higher number of rare varying sites in African American study populations 4 (Supplementary Figure I). This suggests that studies testing for association between rare variants and complex disease should consider including subjects from multiple ethnicities, with preference given to genetically diverse groups. We emphasize that we have only considered a small subset of possible sampling fractions, as we were limited by the grid of sampling fractions we chose (due to computational constraints) and, more importantly, by the four populations included in our sample. Further work on the study design incorporating multiple ethnicities in the candidate gene, candidate pathway, exome- and genome-wide contexts is needed.
Because we focused on test validity and power, our simulations did not model intra- or inter-ethnicity population stratification bias. This is an important concern for analysis of empirical data 39–42. Our stratified analysis strategy accounts for possible inter-ethnicity differences in disease rates. Methods for accounting for intra-ethnicity population stratification are also important. For example, O'Connor et al. show that including ten principal components of genetic variation to account for fine-scale population structure may be sufficient to reduce inflation in aggregate rare variant tests due to differences in disease rates across European subpopulations41.
We examined a diverse set of rare-variant association tests in multi-ethnic samples, but an exhaustive survey is beyond the scope of this paper. Many other methods have been proposed for meta-analysis of GWAS data including MANTRA of Morris,43 a binary effects model by Han and Eskin44 for burden scores and RE-VC and RE-VC-O of Tang and Lin.45 Varying parameters of the approach described by Lee and colleagues35 and examined here could also provide an endless array of approaches to address this question. SKAT-O35, a weighted combination of SKAT and the burden test statistics, was powered just as well or better than the burden test or SKAT. (Supplementary Table VI)
Next generation sequencing association studies–including targeted sequencing, exome sequencing, and soon whole-genome sequencing studies–are still in their earliest stages and this study is one of the largest of its kind. The current study included more ethnicities than most next-generation sequencing studies to date16,20,27,32,36,43,46–48. A larger sample size allows detection of more rare variation and greater power in association testing. However, our study population was not infinite and simulations drawing from a finite population to generate larger population sizes could lead to an underestimate of the amount and perhaps, influence of rare variation. In addition, the current study still omits some continental populations. Future studies may uncover new ways to optimize rare variant studies with even more diverse populations.
Supplementary Material
Literature Cited
- 1.Visscher PM, Brown MA, McCarthy MI, Yang J. Five years of GWAS discovery. Am J Hum Genet. 2012;90(1):7–24. doi: 10.1016/j.ajhg.2011.11.029. [DOI] [PMC free article] [PubMed] [Google Scholar]
- 2.Hindorff L, MacArthur J, European Bioinformatics Institute. Morales J, HA J, PN H, AK K, Manolio T. A Catalog of Published Genome-Wide Association Studies. 2013 www.genome.gov/gwastudies.
- 3.Welter D, MacArthur J, Morales J, Burdett T, Hall P, Junkins H, Klemm A, Flicek P, Manolio T, Hindorff L, Parkinson H. The NHGRI GWAS Catalog, a curated resource of SNP-trait associations. Nucleic Acids Res. 2014;42(Database issue):D1001–D1006. doi: 10.1093/nar/gkt1229. [DOI] [PMC free article] [PubMed] [Google Scholar]
- 4.Altshuler DM, Gibbs RA, Peltonen L, Dermitzakis E, Schaffner SF, Yu F, Bonnen PE, de Bakker PIW, Deloukas P, Gabriel SB, Gwilliam R, Hunt S, Inouye M, Jia X, Palotie A, Parkin M, Whittaker P, Chang K, Hawes A, et al. Integrating common and rare genetic variation in diverse human populations. Nature. 2010;467(7311):52–58. doi: 10.1038/nature09298. [DOI] [PMC free article] [PubMed] [Google Scholar]
- 5.Gibson G. Rare and common variants: twenty arguments. Nat Rev Genet. 2012;13(2):135–145. doi: 10.1038/nrg3118. [DOI] [PMC free article] [PubMed] [Google Scholar]
- 6.Zuk O, Schaffner SF, Samocha K, Do R, Hechter E, Kathiresan S, Daly MJ, Neale BM, Sunyaev SR, Lander ES. Searching for missing heritability: designing rare variant association studies. Proc Natl Acad Sci U S A. 2014;111(4):E455–E464. doi: 10.1073/pnas.1322563111. [DOI] [PMC free article] [PubMed] [Google Scholar]
- 7.Bansal V, Libiger O, Torkamani A, Schork NJ. Statistical analysis strategies for association studies involving rare variants. Nat Rev Genet. 2010;11(11):773–785. doi: 10.1038/nrg2867. [DOI] [PMC free article] [PubMed] [Google Scholar]
- 8.Goldstein DB, Allen A, Keebler J, Margulies EH, Petrou S, Petrovski S, Sunyaev S. Sequencing studies in human genetics: design and interpretation. Nat Rev Genet. 2013;14(7):460–470. doi: 10.1038/nrg3455. [DOI] [PMC free article] [PubMed] [Google Scholar]
- 9.Liu DJ, Leal SM. A novel adaptive method for the analysis of next-generation sequencing data to detect complex trait associations with rare variants due to gene main effects and interactions. PLoS Genet. 2010;6(10):e1001156. doi: 10.1371/journal.pgen.1001156. [DOI] [PMC free article] [PubMed] [Google Scholar]
- 10.Price AL, Kryukov GV, de Bakker PIW, Purcell SM, Staples J, Wei LJ, Sunyaev SR. Pooled association tests for rare variants in exon-resequencing studies. Am J Hum Genet. 2010;86(6):832–838. doi: 10.1016/j.ajhg.2010.04.005. [DOI] [PMC free article] [PubMed] [Google Scholar]
- 11.Neale BM, Rivas MA, Voight BF, Altshuler D, Devlin B, Orho-Melander M, Kathiresan S, Purcell SM, Roeder K, Daly MJ. Testing for an unusual distribution of rare variants. PLoS Genet. 2011;7(3):e1001322. doi: 10.1371/journal.pgen.1001322. [DOI] [PMC free article] [PubMed] [Google Scholar]
- 12.Li B, Leal SM. Methods for Detecting Associations with Rare Variants for Common Diseases : Application to Analysis of Sequence Data. Am J Hum Genet. 2008;(83):311–321. doi: 10.1016/j.ajhg.2008.06.024. [DOI] [PMC free article] [PubMed] [Google Scholar]
- 13.Madsen BE, Browning SR. A groupwise association test for rare mutations using a weighted sum statistic. PLoS Genet. 2009;5(2):e1000384. doi: 10.1371/journal.pgen.1000384. [DOI] [PMC free article] [PubMed] [Google Scholar]
- 14.Morgenthaler S, Thilly WG. A strategy to discover genes that carry multi-allelic or mono-allelic risk for common diseases: a cohort allelic sums test (CAST) Mutat Res. 2007;615(1-2):28–56. doi: 10.1016/j.mrfmmm.2006.09.003. [DOI] [PubMed] [Google Scholar]
- 15.Ladouceur M, Zheng HF, Greenwood CMT, Richards JB. Empirical power of very rare variants for common traits and disease: results from sanger sequencing 1998 individuals. Eur J Hum Genet. 2013;(October 2012):1–4. doi: 10.1038/ejhg.2012.284. [DOI] [PMC free article] [PubMed] [Google Scholar]
- 16.Ladouceur M, Dastani Z, Aulchenko YS, Greenwood CMT, Richards JB. The empirical power of rare variant association methods: results from sanger sequencing in 1,998 individuals. PLoS Genet. 2012;8(2):e1002496. doi: 10.1371/journal.pgen.1002496. [DOI] [PMC free article] [PubMed] [Google Scholar]
- 17.Song K, Nelson MR, Aponte J, Manas ES, Bacanu S, Yuan X, Kong X, Cardon L, Mooser VE, Whittaker JC, Waterworth DM. Sequencing of Lp-PLA2-encoding PLA2G7 gene in 2000 Europeans reveals several rare loss-of-function mutations. Pharmacogenomics J. 2012;12(5):425–431. doi: 10.1038/tpj.2011.20. [DOI] [PMC free article] [PubMed] [Google Scholar]
- 18.Chen F, Stram DO, Le Marchand L, Monroe KR, Kolonel LN, Henderson BE, Haiman CA. Caution in generalizing known genetic risk markers for breast cancer across all ethnic/racial populations. Eur J Hum Genet. 2011;19(2):243–245. doi: 10.1038/ejhg.2010.185. [DOI] [PMC free article] [PubMed] [Google Scholar]
- 19.Emison ES, Garcia-Barcelo M, Grice EA, Lantieri F, Amiel J, Burzynski G, Fernandez RM, Hao L, Kashuk C, West K, Miao X, Tam PKH, Griseri P, Ceccherini I, Pelet A, Jannot AS, de Pontual L, Henrion-Caude A, Lyonnet S, et al. Differential contributions of rare and common, coding and noncoding Ret mutations to multifactorial Hirschsprung disease liability. Am J Hum Genet. 2010;87(1):60–74. doi: 10.1016/j.ajhg.2010.06.007. [DOI] [PMC free article] [PubMed] [Google Scholar]
- 20.Lander ES. Initial impact of the sequencing of the human genome. Nature. 2011;470(7333):187–197. doi: 10.1038/nature09792. [DOI] [PubMed] [Google Scholar]
- 21.Kiezun A, Garimella K, Do R, Stitziel NO, Benjamin M, Mclaren PJ, Gupta N, Sklar P, Sullivan PF, Moran JL, Hultman CM, Lichtenstein P, Magnusson P. Exome sequencing and the genetic basis of complex traits. NIH Public Access. 2013;44:623–630. doi: 10.1038/ng.2303.Exome. [DOI] [PMC free article] [PubMed] [Google Scholar]
- 22.Wang SR, Agarwala V, Flannick J, Chiang CWK, Altshuler D, Hirschhorn JN. Simulation of Finnish population history, guided by empirical genetic data, to assess power of rare-variant tests in Finland. Am J Hum Genet. 2014;94(5):710–720. doi: 10.1016/j.ajhg.2014.03.019. [DOI] [PMC free article] [PubMed] [Google Scholar]
- 23.Zaitlen N, Paşaniuc B, Gur T, Ziv E, Halperin E. Leveraging genetic variability across populations for the identification of causal variants. Am J Hum Genet. 2010;86(1):23–33. doi: 10.1016/j.ajhg.2009.11.016. [DOI] [PMC free article] [PubMed] [Google Scholar]
- 24.Spiegelman D, Colditz GA, Hunter D, Hertzmark E. Validation of the Gail et al. model for predicting individual breast cancer risk. J Natl Cancer Inst. 1994;86(8):600–607. doi: 10.1093/jnci/86.8.600. http://www.ncbi.nlm.nih.gov/pubmed/8145275. [DOI] [PubMed] [Google Scholar]
- 25.Eliassen AH, Tworoger SS, Mantzoros CS, Pollak MN, Hankinson SE. Circulating insulin and c-peptide levels and risk of breast cancer among predominately premenopausal women. Cancer Epidemiol Biomarkers Prev. 2007;16(1):161–164. doi: 10.1158/1055-9965.EPI-06-0693. [DOI] [PubMed] [Google Scholar]
- 26.Pike MC, Kolonel LN, Henderson BE, Wilkens LR, Hankin JH, Feigelson HS, Wan PC, Stram DO, Nomura AMY. Breast Cancer in a Multiethnic Cohort in Hawaii and Los Angeles : Risk Factor-adjusted Incidence in Japanese Equals and in Hawaiians Exceeds that in Whites. Cancer Epidemiol Biomarkers Prev. 2002;(11):795–800. [PubMed] [Google Scholar]
- 27.Metzker ML. Sequencing technologies - the next generation. Nat Rev Genet. 2010;11(1):31–46. doi: 10.1038/nrg2626. [DOI] [PubMed] [Google Scholar]
- 28.Auwera GA, Van Der, Carneiro MO, Hartl C, Poplin R, Angel G, Levy-moonshine A, Shakir K, Roazen D, Thibault J, Banks E, Garimella KV, Altshuler D, Gabriel S, Depristo MA. From FastQ Data to High-Confidence Variant Calls : The Genome Analysis Toolkit Best Practices Pipeline. Curr Protoc Bioinforma. 2013;11(October):1–33. doi: 10.1002/0471250953.bi1110s43. [DOI] [PMC free article] [PubMed] [Google Scholar]
- 29.McKenna A, Hanna M, Banks E, Sivachenko A, Cibulskis K, Kernytsky A, Garimella K, Altshuler D, Gabriel S, Daly M, DePristo Ma. The Genome Analysis Toolkit: a MapReduce framework for analyzing next-generation DNA sequencing data. Genome Res. 2010;20(9):1297–1303. doi: 10.1101/gr.107524.110. [DOI] [PMC free article] [PubMed] [Google Scholar]
- 30.DePristo MA, Banks E, Poplin R, Garimella KV, Maguire JR, Hartl C, Philippakis AA, del Angel G, Rivas MA, Hanna M, McKenna A, Fennell TJ, Kernytsky AM, Sivachenko AY, Cibulskis K, Gabriel SB, Altshuler D, Daly MJ. A framework for variation discovery and genotyping using next-generation DNA sequencing data. Nat Genet. 2011;43(5):491–498. doi: 10.1038/ng.806. [DOI] [PMC free article] [PubMed] [Google Scholar]
- 31.Cingolani P, Platts A, Wang LL, Coon M, Nguyen T, Wang L, Land SJ, Ruden DM, Lu X. A program for annotating and predicting the effects of single nucleotide polymorphisms, SnpEff: SNPs in the genome of Drosophila melanogaster strain w1118; iso-2; iso-3. Fly (Austin) 2012;6(2):1–13. doi: 10.4161/fly.19695. http://snpeff.sourceforge.net/SnpEff_paper.pdf. [DOI] [PMC free article] [PubMed] [Google Scholar]
- 32.Wu MC, Lee S, Cai T, Li Y, Boehnke M, Lin X. Rare-variant association testing for sequencing data with the sequence kernel association test. Am J Hum Genet. 2011;89(1):82–93. doi: 10.1016/j.ajhg.2011.05.029. [DOI] [PMC free article] [PubMed] [Google Scholar]
- 33.Evangelou E, Ioannidis JPA. Meta-analysis methods for genome-wide association studies and beyond. Nat Rev Genet. 2013;14(6):379–389. doi: 10.1038/nrg3472. [DOI] [PubMed] [Google Scholar]
- 34.Hardy RJ, Thompson SG. Detecting and Describing Heterogeneity In Meta-Analysis. Stat Med. 1998;(17):841–856. doi: 10.1002/(sici)1097-0258(19980430)17:8<841::aid-sim781>3.0.co;2-d. [DOI] [PubMed] [Google Scholar]
- 35.Lee S, Teslovich TM, Boehnke M, Lin X. General Framework for Meta-analysis of Rare Variants in Sequencing Association Studies. Am J Hum Genet. 2013;93(1):42–53. doi: 10.1016/j.ajhg.2013.05.010. http://dx.doi.org/10.1016/j.ajhg.2013.05.010. [DOI] [PMC free article] [PubMed] [Google Scholar]
- 36.Coventry A, Bull-Otterson LM, Liu X, Clark AG, Maxwell TJ, Crosby J, Hixson JE, Rea TJ, Muzny DM, Lewis LR, Wheeler Da, Sabo A, Lusk C, Weiss KG, Akbar H, Cree A, Hawes AC, Newsham I, Varghese RT, et al. Deep resequencing reveals excess rare recent variants consistent with explosive population growth. Nat Commun. 2010;1(8):131. doi: 10.1038/ncomms1130. [DOI] [PMC free article] [PubMed] [Google Scholar]
- 37.Fu W, O'Connor TD, Jun G, Kang HM, Abecasis G, Leal SM, Gabriel S, Rieder MJ, Altshuler D, Shendure J, Nickerson Da, Bamshad MJ, Akey JM. Analysis of 6,515 exomes reveals the recent origin of most human protein-coding variants. Nature. 2013;493(7431):216–220. doi: 10.1038/nature11690. [DOI] [PMC free article] [PubMed] [Google Scholar]
- 38.Ma C, Blackwell T, Boehnke M, Scott LJ GoT2D Investigators. Recommended joint and meta-analysis strategies for case-control association testing of single low-count variants. Genet Epidemiol. 2013;37(6):539–550. doi: 10.1002/gepi.21742.Recommended. [DOI] [PMC free article] [PubMed] [Google Scholar]
- 39.Mao X, Li Y, Liu Y, Lange L, Li M. Testing genetic association with rare variants in admixed populations. Genet Epidemiol. 2013;37(1):38–47. doi: 10.1002/gepi.21687. [DOI] [PMC free article] [PubMed] [Google Scholar]
- 40.Liu J, Lewinger JP, Gilliland FD, Gauderman WJ, Conti DV. Confounding and heterogeneity in genetic association studies with admixed populations. Am J Epidemiol. 2013;177(4):351–360. doi: 10.1093/aje/kws234. [DOI] [PMC free article] [PubMed] [Google Scholar]
- 41.O'Connor TD, Kiezun A, Bamshad M, Rich SS, Smith JD, Turner E, Leal SM, Akey JM. Fine-scale patterns of population stratification confound rare variant association tests. PLoS One. 2013;8(7):e65834. doi: 10.1371/journal.pone.0065834. [DOI] [PMC free article] [PubMed] [Google Scholar]
- 42.Kiezun A, Garimella K, Do R, Stitziel NO, Neale BM, McLaren PJ, Gupta N, Sklar P, Sullivan PF, Moran JL, Hultman CM, Lichtenstein P, Magnusson P, Lehner T, Shugart YY, Price AL, de Bakker PIW, Purcell SM, Sunyaev SR. Exome sequencing and the genetic basis of complex traits. Nat Genet. 2012;44(6):623–630. doi: 10.1038/ng.2303. [DOI] [PMC free article] [PubMed] [Google Scholar]
- 43.Morris AP. Transethnic meta-analysis of genomewide association studies. Genet Epidemiol. 2011;35(8):809–822. doi: 10.1002/gepi.20630. [DOI] [PMC free article] [PubMed] [Google Scholar]
- 44.Han B, Eskin E. Interpreting meta-analyses of genome-wide association studies. PLoS Genet. 2012;8(3):e1002555. doi: 10.1371/journal.pgen.1002555. [DOI] [PMC free article] [PubMed] [Google Scholar]
- 45.Tang ZZ, Lin DY. Meta-analysis of sequencing studies with heterogeneous genetic associations. Genet Epidemiol. 2014;38(5):389–401. doi: 10.1002/gepi.21798. [DOI] [PMC free article] [PubMed] [Google Scholar]
- 46.Haiman CA, Stram DO, Pike MC, Kolonel LN, Burtt NP, Altshuler D, Hirschhorn J, Henderson BE. A comprehensive haplotype analysis of CYP19 and breast cancer risk: the Multiethnic Cohort. Hum Mol Genet. 2003;12(20):2679–2692. doi: 10.1093/hmg/ddg294. [DOI] [PubMed] [Google Scholar]
- 47.Hein R, Maranian M, Hopper JL, Kapuscinski MK, Southey MC, Park DJ, Schmidt MK, Broeks A, Hogervorst FBL, Bueno-de-Mesquita HB, Bueno-de-Mesquit HB, Muir KR, Lophatananon A, Rattanamongkongul S, Puttawibul P, Fasching PA, Hein A, Ekici AB, Beckmann MW, et al. Comparison of 6q25 breast cancer hits from Asian and European Genome Wide Association Studies in the Breast Cancer Association Consortium (BCAC) PLoS One. 2012;7(8):e42380. doi: 10.1371/journal.pone.0042380. [DOI] [PMC free article] [PubMed] [Google Scholar]
- 48.Do R, Kathiresan S, Abecasis GR. Exome sequencing and complex disease: practical aspects of rare variant association studies. Hum Mol Genet. 2012;21(R1):R1–R9. doi: 10.1093/hmg/dds387. [DOI] [PMC free article] [PubMed] [Google Scholar]
Associated Data
This section collects any data citations, data availability statements, or supplementary materials included in this article.