Abstract
Purpose
Optical coherence tomography (OCT) can monitor for glaucoma by measuring dimensions of the optic nerve head (ONH) cup and disc. Multiple clinical studies have shown that different OCT devices yield different estimates of retinal dimensions. We developed phantoms mimicking ONH morphology as a new way to compare ONH measurements from different clinical OCT devices.
Methods
Three phantoms were fabricated to model the ONH: One normal and two with glaucomatous anatomies. Phantoms were scanned with Stratus, RTVue, and Cirrus clinical devices, and with a laboratory OCT system as a reference. We analyzed device-reported ONH measurements of cup-to-disc ratio (CDR) and cup volume and compared them with offline measurements done manually and with a custom software algorithm, respectively.
Results
The mean absolute difference between clinical devices with device-reported measurements versus offline measurements was 0.082 vs. 0.013 for CDR and 0.044 mm3 vs. 0.019 mm3 for cup volume. Statistically significant differences between devices were present for 16 of 18 comparisons of device-reported measurements from the phantoms. Offline Cirrus measurements tended to be significantly different from those from Stratus and RTVue.
Conclusions
The interdevice differences in CDR and cup volume are primarily caused by the devices' proprietary ONH analysis algorithms. The three devices yield more similar ONH measurements when a consistent offline analysis technique is applied. Scan pattern on the ONH also may be a factor in the measurement differences. This phantom-based study has provided unique insights into characteristics of OCT measurements of the ONH.
Keywords: optical coherence tomography, phantom, optic nerve head
Glaucoma detection and progression monitoring are performed with clinical optical coherence tomography (OCT) devices using metrics including thickness of the retinal nerve fiber layer (RNFL) and dimensions of the optic nerve head (ONH). These metrics target different structures, but related manifestations, of the disease. Retinal nerve fiber layer thickness measurements are readily and routinely derived from OCT cross-sectional images, revealing nerve fiber loss associated with glaucoma. Because abnormal or progressive disc cupping can also indicate glaucoma, the ONH cup-to-disc ratio (CDR) has historically been measured with traditional funduscopic examination, fundus imaging, and scanning laser ophthalmoscopy; more recently, clinical OCT devices are reporting CDR and other ONH measurements, such as cup volume, to aid in glaucoma diagnosis.
Cup-to-disc ratio measurements with OCT require establishment of anatomical boundaries of the ONH cup and disc uniquely visible in OCT images. The disc boundary can be defined by the termination points of the RPE/choriocapillaris layer,1 which is also considered to be the location of Bruch's membrane (BM). The cup boundary is then identified at a fixed distance above the line connecting the edges of the BM opening. Automated ONH analysis by OCT typically involves a software algorithm to locate BM and its termination points along with the cup opening points. Each clinical OCT device performs a unique scan pattern of the ONH and then applies a proprietary software algorithm to the acquired images that identifies the boundary points for cup and disc measurements. These ONH measurements have the potential to vary due to OCT hardware specifications, scan pattern, and software algorithm design. Numerous clinical studies have been performed to investigate differences in OCT thickness measurement of the retina2−7 and RNFL,8−10 but only one clinical study to investigate interdevice differences in ONH measurements has been published, by Savini et al.11 In general, clinical studies for such a purpose are routinely challenged by the confounds of biological and operator variability.
Phantoms are physical models designed with specific structures and dimensions to calibrate or evaluate a device's ability to produce reliable and consistent outputs (eg, images, measurements). Typically the phantom's properties closely mimic those of the biological tissue under study. For assessment of posterior segment OCT imaging, Rowe and Zawadzki12 developed a phantom consisting of five transparent 60-μm layers and a realistic fovea. Following that work, Baxi et al.13 reported development of a retina-simulating phantom that provides an accurate representation of the thickness and reflectivity of 12 retinal layers and also includes a foveal pit. Very recently, Lee et al.14 further sophisticated retina phantom fabrication by incorporating a highly realistic foveal pit topography and different morphologic features of disease in a layered structure resembling the work of Baxi et al.13 Phantom-based studies of the variability in a device's output and/or agreement between outputs of different devices are free of biological and subject variability and therefore can more clearly reveal subtle differences between devices. de Kinkelder et al.15 performed such a study with a layered phantom and model eye and found significant variability and potential inaccuracies in RNFL thickness measurements in four clinical OCT devices. This study highlights another important and unique feature of a phantom-based study not accessible through clinical studies: because a phantom can be measured outside the clinical setting (with a laboratory OCT system or other modalities) to obtain reference dimensions of the phantom, clinical OCT measurement bias versus an independent, nonclinical reference can now be estimated.
We have recently developed phantoms to quantify and understand ONH measurement characteristics with clinical devices. Three ONH phantoms were constructed to model healthy and glaucomatous conditions, and these phantoms were imaged and measured with three different clinical OCT devices to determine repeatability, bias, and agreement among the devices.
Methods
Optical Nerve Head Phantom Fabrication
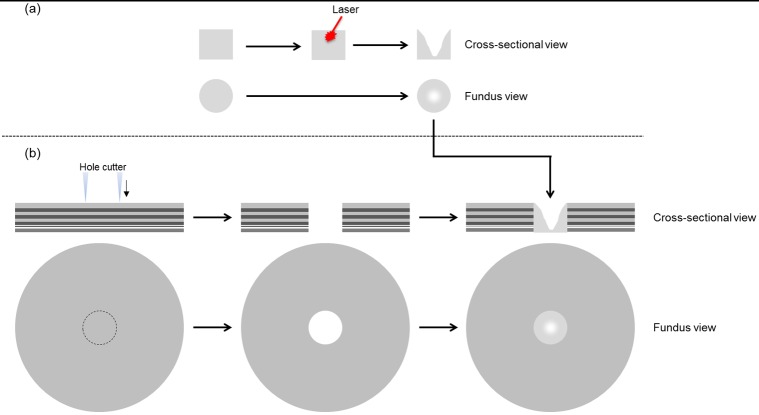
The ONH phantoms were fabricated with two components: ONH and peripapillary regions. The retinal layers in the peripapillary region of the ONH phantom were fabricated following a previously reported process.13 Briefly, the peripapillary region is constructed layer-by-layer using spin-coat deposition of polydimethylsiloxane (PDMS) with embedded nanoparticles designed to match typical layer thickness and reflectivity. In our previous work, the macula phantom consisted of 12 layers: RNFL at the inner extreme; ganglion cell, plexiform, and nuclear layers; photoreceptor layers with RPE; choroid at the outer extreme. In contrast to the macula phantom, the 10-layer peripapillary region was constructed with significantly increased RNFL thickness, and reduced or absent ganglion cell, inner nuclear, and plexiform layers to better model human peripapillary anatomy. The RPE-photoreceptor complex for the peripapillary region is similar to that of the macula phantom. The ONH region was realized with a circular disc-shaped piece of nanoparticle-embedded PDMS matching the RNFL reflectivity and as thick as all the peripapillary layers combined (Fig. 1a). A nominally circular cup was etched into this disc with a femtosecond-pulsed laser. The disc was then pressed into a circular hole cut out of the peripapillary region and sealed with PDMS (Fig. 1b). We created three ONH phantoms representing a healthy cup and a moderate level of glaucomatous cupping in two different sizes of disc (Table 1). In a similar manner as Schuman et al.,1 we chose 150 μm as the distance above the BM opening to measure cup diameter.
Figure 1.
Optic nerve head phantom fabrication process. (a) Laser etching of cup in disc. (b) Placement of disc in peripapillary region.
Table 1.
Optical Nerve Head Phantoms
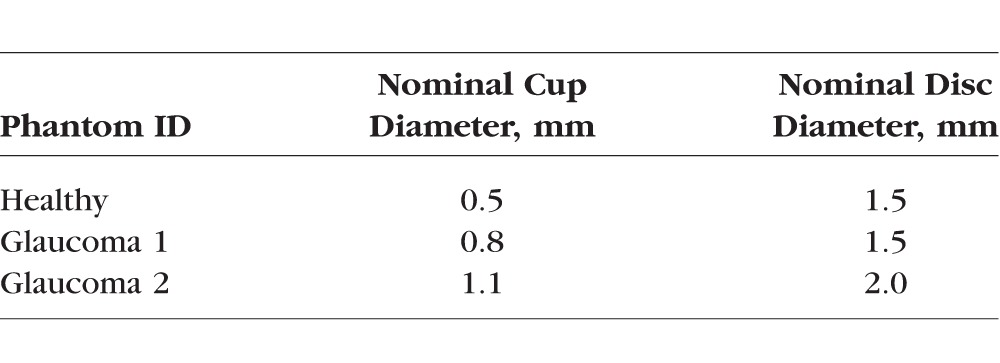
Each of the three ONH phantoms was mounted into its own model eye (OEMI-7; Ocular Instruments, Inc., Bellevue, WA, USA), which has been used previously for other OCT phantom studies.13,16 The model eye, shown in Figure 2, comprises a cornea and crystalline lens made of polymethyl methacrylate and water-filled aqueous and vitreous cavities. The ONH phantom was adhered to the posterior surface of the vitreous cavity matching the position and curvature of the retina.
Figure 2.
An OEMI-7 model eye from Ocular Instruments, Inc. (a) Engineering drawing, with dimensions in millimeters. (b) Photograph.
Optical Coherence Tomography and X-Ray Imaging
To establish reference dimensions of cup and disc, the phantoms were imaged in the laboratory using a research-grade spectral-domain OCT system (built by authors AA and DXH) with a light source center wavelength of 1070 nm and 86-nm spectral bandwidth. This system is configured as a low-power microscope for three-dimensional (3D) imaging of specimens through a ×1.6 magnification telecentric objective lens. Axial and lateral resolutions were measured to be 12 μm and 16 μm, respectively. Axial pixel size was measured to be 5.6 μm in air, which corresponds to 4.0 μm in the phantom having known refractive index of 1.4. To obtain accurate dimensions of the ONH with this OCT system, each phantom was imaged in air with the anterior optics and water of the model eye removed. The phantoms were scanned with a dense raster scan pattern consisting of 500 B-scans and 500 A-scans/B-scans over a 3 × 3-mm region covering the ONH (Table 2). To verify the 3D accuracy of our laboratory OCT system, we also imaged and measured the phantoms with an x-ray micro–computed tomography (micro-CT) system (MicroCT 100; SCANCO Medical AG, Bruettisellen, Switzerland) with 17-μm resolution in both lateral and axial dimensions. Individual retinal layers and disc boundaries were indistinguishable with micro-CT, so only cup dimensions could be measured.
Table 2.
Optical Nerve Head Scan Protocols for OCT Devices

Three commercially available clinical OCT devices were selected for a round robin study of ONH measurements from the phantoms: Stratus and Cirrus HD-OCT (both Zeiss, Dublin, CA, USA) and RTVue (Optovue, Fremont, CA, USA). The ONH scan protocols for these three devices are shown in Table 2. RTVue uses a combination of radial and circular scans on the ONH: circular scans are for RNFL thickness measurements, and only the radial scans are analyzed for ONH measurements. The model eye was attached to the headholder of each device with a clamp for scanning. Each phantom was scanned three times with each device, with the model eye detached and reattached between each scan, yielding 27 datasets in total.
Optical Nerve Head Measurements and Analysis
To obtain reference CDR values from the laboratory OCT datasets, 180 radial B-scans centered on the cup separated by 1° were first extracted for cup measurements by resampling from the raster scans using nearest neighbor interpolation. Each B-scan was flattened at the inner limiting membrane (ILM) outside the cup, instead of using the BM, as is typically done with clinical OCT images of the ONH. Because the BM and ILM are parallel in the phantom, the strongly visible ILM served as a robust surrogate for the less-visible BM in the flattening operation. The ILM, located 300 μm above the BM in the phantom, also served as the reference surface for the cup boundaries, which were thus manually identified 150 μm below the ILM in each B-scan. This process yielded 180 values of cup diameter for each phantom. A single value of disc diameter for each phantom was determined by fitting a circle to the disc boundary visible in an en face view of the phantom from its data cube. A total of 180 CDR values were then calculated for each phantom from the cup diameter values and the disc diameter, and the mean of these 180 values was considered to be the reference CDR for that phantom. For reference cup volume values, we wrote our own custom software algorithm that first segments the position of the vitreal-retinal boundary to establish the bottom of the cup and then counts pixels in each B-scan within the cup 150 μm below the ILM. The presumed volume x × y × z occupied by each pixel is calculated from the A-scan spacing (x), B-scan spacing (y), and the axial pixel size (z) (Table 2); summing the volumes of all the counted pixels in all the B-scans gives the total cup volume. Micro-CT cup volume also was measured 150 μm below the ILM.
The three clinical devices report CDR and cup volume using their own proprietary algorithms for automated ONH segmentation and measurement. Stratus and RTVue output horizontal and vertical CDR values with each ONH scan; the mean of the two outputs was taken for the analysis here. Cirrus outputs an average CDR directly.
Cup-to-disc ratio was manually measured from the clinical datasets by two independent readers (AA and DXH) using individual B-scans from each dataset. The B-scans were flattened with the same algorithm used on the laboratory OCT data. For Stratus, only six B-scans were available in each dataset, so we chose the B-scan with the largest cup diameter, as this one is the most likely to pass through the center of the cup. The RTVue had 12 B-scans in each dataset, and we identified the three B-scans with the largest cup diameter. With the Cirrus raster scans, two B-scans centered on the cup were identified from an en face view, one in the horizontal direction and one in the vertical direction. For each of the 27 datasets, a single CDR value was computed as the mean of the two readers' measurements.
The custom algorithm described above to obtain reference cup volume values was applied to the clinical devices as well. Because Cirrus uses raster scans like the laboratory OCT setup, the algorithm could be applied directly. The algorithm had to be modified for the Stratus and RTVue radial scans because each pixel does not occupy a constant cubic volume; x and z remain constant, but y increases with increasing distance from the center of the B-scan.
We determined measurement repeatability, bias, and agreement for both device-reported and offline (manual or custom algorithm) ONH measurements from the clinical devices with each of the phantoms. Repeatability was computed by taking the coefficient of variation (CV) of the three measurements from repeated scans. Measurement bias versus the reference was computed by subtracting the reference measurement from the measurement mean for each device-phantom combination. Agreement between devices with each phantom was computed by subtracting corresponding measurement means. Student's t-test was performed to determine if the differences between devices' ONH measurements were statistically significant (P < 0.05).
Results
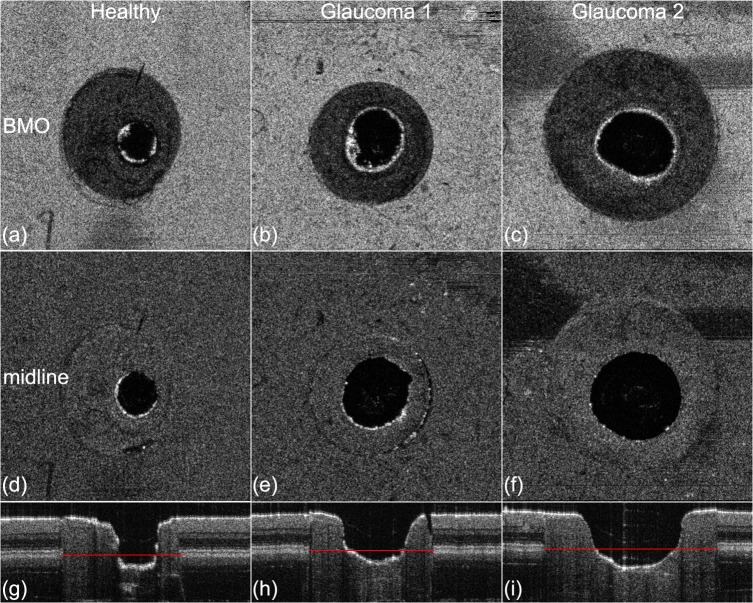
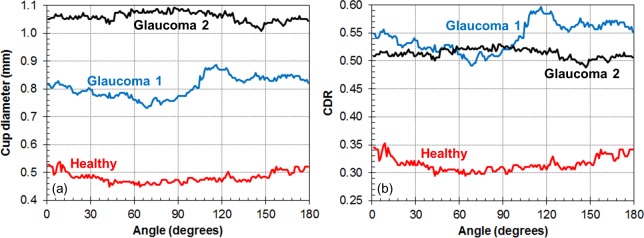
Figure 3 shows en face projections and representative B-scans of the three phantoms from the laboratory OCT system. The BM is identified as the midline of the deepest bright line in the RPE-photoreceptor complex. Some irregularities in the cup shape are evident, due to unpredictable variations in laser-material interaction during etching. In the case of Glaucoma 1, a slight gap is present between the disc and the superficial layers of the peripapillary region. Figure 4 shows the cup diameter at the midline and CDR values as a function of radial (clock face) angle. As seen in Figures 3d and 3e, the cup shape of Glaucoma 1 is the most irregular, yielding the larger variability in CDR versus angle seen in Figure 4. Table 3 lists the cup volume measurements from laboratory OCT and micro-CT, which are within 0.02 mm3 of each other for all three phantoms. This verification with micro-CT indicates the average absolute error of laboratory OCT to be 0.011 mm3 or 6% for cup volume measurements of these phantoms.
Figure 3.
Representative en face projections and B-scans for the three ONH phantoms. En face projections (z-planes) are at the level of the BM opening (a–c) and the retinal midline (d–f) 150 μm above the BM opening where the cup diameter is measured. B-scan images through the horizontal center of the ONH phantoms are shown in (g–i). The BM opening is annotated with red lines in the B-scans.
Figure 4.
Radial uniformity of ONH phantoms measured with laboratory OCT system. (a) Cup diameter at midline versus radial angle. (b) Cup-to-disc ratio versus radial angle.
Table 3.
Cup Volume Measurements, mm3

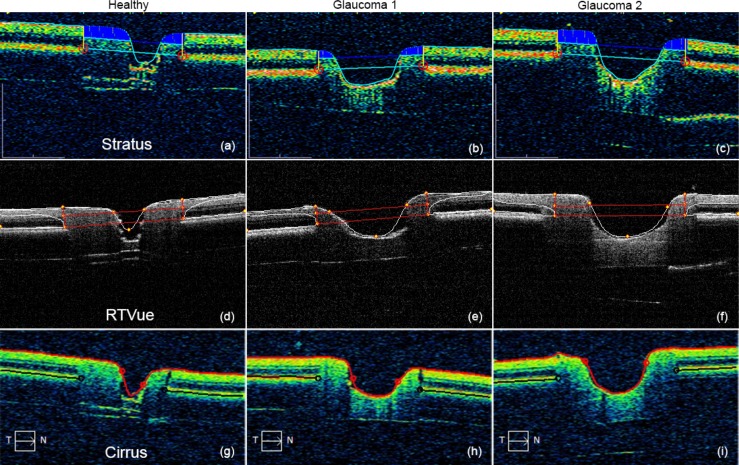
Figure 5 shows representative B-scans of the three phantoms from the three clinical devices. Each image has been automatically annotated with the output of the device segmentation algorithm. Some differences in the algorithms are clear from these images; for example, RTVue appears to apply a smooth curve from the RNFL to identify the BM termination point, whereas Stratus and Cirrus seem to identify a sharp boundary. Curve fitting to the cup boundary is also quite apparent with Cirrus and RTVue, especially with Healthy, which could cause underestimation of the cup diameter.
Figure 5.
Annotated OCT images of ONH phantoms taken from the clinical device output reports. (a–c) Stratus. (d–f) RTVue. (g–i) Cirrus.
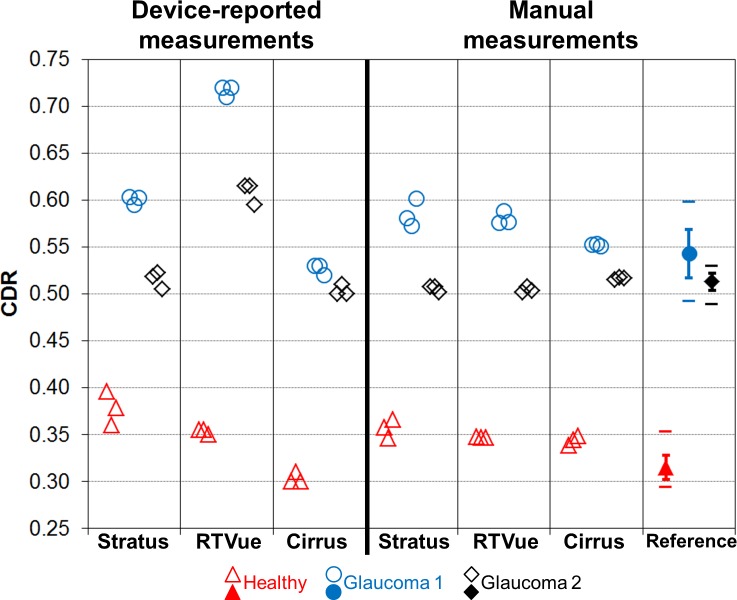
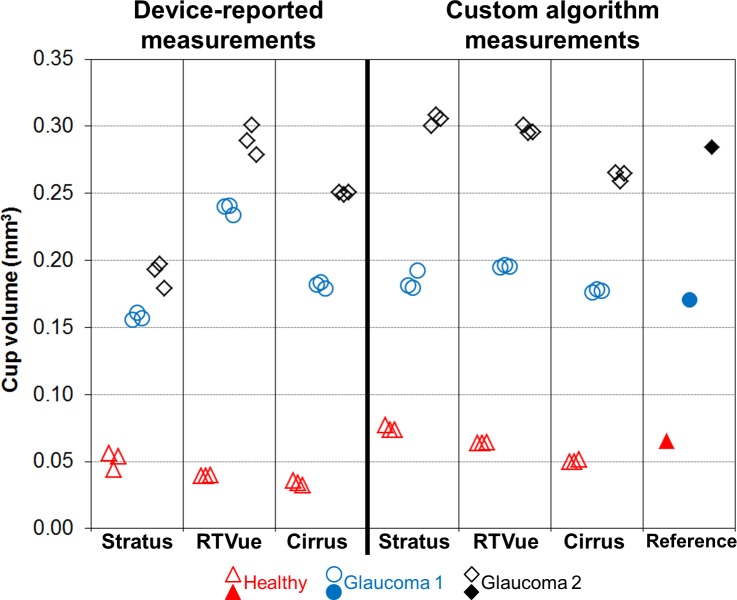
Figures 6 and 7 contain graphs of the CDR and cup volume values, respectively, from clinical devices and the reference. For the clinical devices, the individual measurements from the three datasets are shown. Reference CDR values are 0.315 ± 0.013, 0.543 ± 0.026, and 0.513 ± 0.009 for Healthy, Glaucoma 1, and Glaucoma 2, respectively. The device-reported CDR measurements are quite different between devices, with the exception of Stratus and Cirrus with Glaucoma 2. Cirrus generally reported lower CDR values than the other two devices did; RTVue reported CDR measurements well outside the reference range for Glaucoma 1 and 2. Manual CDR measurements are clearly more similar across devices. Cup volume has similar trends among device-reported measurements as with CDR: Healthy cup volume measurements are more similar across devices as compared with the values from Glaucoma 1 and 2. The custom algorithm clearly reduces interdevice differences in cup volume.
Figure 6.
Cup-to-disc ratio measurements of ONH phantoms. For the reference data points, error bars represent ±1 SD and separate horizontal bars represent minimum and maximum values.
Figure 7.
Cup volume measurements of ONH phantoms.
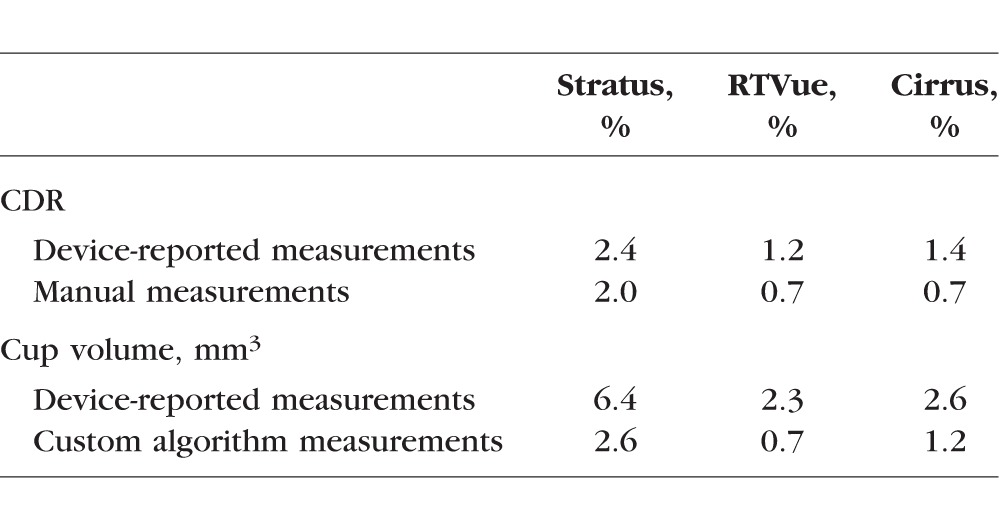
Mean repeatability for each device was computed from the three phantoms (Table 4). Repeatability was poorest with Stratus for both CDR and cup volume. For all three devices, manual measurements improve CDR repeatability slightly and custom algorithm measurements improve cup volume repeatability more noticeably, but none of these improvements were statistically significant.
Table 4.
Mean Repeatability of Measurements
Mean bias across the three phantoms for each device and measurement type showed device-reported CDR bias from RTVue to be the largest, driven by its elevated measurements from Glaucoma 1 and 2 phantoms (Table 5). Stratus has the largest device-reported cup volume bias, primarily from its underestimation of Glaucoma 2. Manual measurements reduce Stratus and RTVue CDR bias markedly and the custom algorithm reduces Stratus cup volume bias, but only Stratus's change in CDR bias is statistically significant. Bias in Cirrus tends to be smaller than the other two devices, and it is similar in magnitude between its device-reported and offline measurements.
Table 5.
Mean Bias of Clinical Device Measurements Versus Reference (95% Confidence Intervals in Brackets)

Table 6 shows the agreement values for all possible comparisons. Statistically significant differences are frequently apparent with device-reported measurements (seven of nine possible comparisons), with the mean of the absolute value of these nine differences (mean absolute difference [MAD]) equal to 0.082. The MAD is considerably smaller with manual CDR measurements (0.013), though four of nine comparisons, all involving Cirrus, demonstrate statistically significant differences. All the device-reported cup volume measurements are significantly different between devices, and the MAD is 0.044 mm3. Custom algorithm measurements of cup volume tend to have better agreement, especially Stratus and RTVue with Glaucoma 1 and 2 phantoms, and the MAD is reduced to 0.019 mm3. Six of nine comparisons of custom algorithm cup volume measurements have statistically significant differences, with five of these six involving Cirrus.
Table 6.
Clinical Device Measurement Agreement (95% Confidence Intervals in Brackets)
Discussion
Using novel, realistic phantoms of the retina, we determined repeatability and bias in ONH measurements from clinical OCT devices, and observed interdevice differences in these measurements. The device-reported CDR repeatability rivalled the inherent variability in each phantom evident from the SDs about the reference CDR values. Manual CDR measurement repeatability tended to be slightly better than device-reported, because two readers were used in this study and their measurements were averaged together. The relatively poor repeatability in CDR and cup volume with Stratus is consistent with its coarse scan pattern (only six radial B-scans) and its poorer axial resolution compared with the other two devices. However, repeatability findings from this study were limited by the phantoms' deviations from an ideal circular cup shape, along with the lack of distinct internal registration marks to orient the scan locations. Both of these factors degraded the repeatability, more so when the scan pattern was coarse. Device-reported cup volume repeatability was unsurprisingly poorer than device-reported CDR repeatability given the increased analytical complexity required for cup volume measurement.
The most striking feature in our results was the disagreement in device-reported measurements across the clinical devices, where most of the differences are statistically significant. The existence of general disagreement is consistent with the findings of Savini et al.,11 who reported that Stratus and Cirrus showed statistically significant disagreement in human subjects for a number of ONH parameters, including CDR. From their study, Cirrus reported higher vertical CDR than Stratus in healthy eyes (0.55 vs. 0.50, P = 0.0053), but there was not a statistically significant difference in vertical CDR with glaucomatous eyes (0.73 vs. 0.72). In contrast to Savini et al.,11 our results indicate that Stratus tends to report higher CDR than Cirrus. Additional clinical data will confirm the direction and extent of device differences.
The CDR disagreement seen in this study was dramatically reduced when manual measurements were performed. Statistical significance of disagreement with manual CDR measurements still appeared because the corresponding repeatability CV values were small. The improved agreement and reduced bias with offline measurements of both CDR and cup volume suggest that the hardware and scan protocols implemented in each device can characterize the ONH equivalently, and that the differences are primarily caused by the software segmentation and measurement algorithms. The manual CDR measurements were also more likely to be consistent across devices because all the images were displayed in the same format (8-bit grayscale) for reader review.
Evidence of the profound effect of a device's internal algorithm can be seen in Figures 5e and 5f, which show that the RTVue segmentation underestimates the phantoms' disc dimensions, apparently a result of assuming some amount of BM overhang at the disc margins into the neural canal, a typical BM feature in both healthy and glaucomatous human retinas.17 This segmentation effect is consistent with the substantially higher device-reported CDR from RTVue for the glaucoma phantoms versus the other two devices and the reference. Although the phantoms' idealization of ONH anatomy included no BM overhang, a less common but not entirely unrealistic configuration in the human retina,17 this idealization enabled a clear identification of an important difference in the RTVue segmentation method at the disc margins compared with the other two devices.
Curve fitting underestimates the cup, as shown in Figures 5a, 5d, and 5g, and likely explains why all three devices reported low cup volumes in the Healthy phantom compared with the reference. The associated CDR measurements are not similarly low, as they can be offset by underestimated disc dimensions. The especially steep slope in the Healthy phantom's cup presented an unrealistic challenge to the curve-fitting operation and therefore represents an anatomical limitation of this phantom. There was no consistency in how the device-reported cup volume deviated from the reference with the glaucoma phantoms. In particular, Stratus accurately estimated Glaucoma 1 but strongly underestimated Glaucoma 2, whereas RTVue strongly overestimated Glaucoma 1 but accurately estimated Glaucoma 2. Because we do not have access to the inner workings of the devices' measurement algorithms, the reasons for these inconsistencies are not clear but may result from cup volume estimation requiring an accurate trace of the entire cup boundary to the rim. This process can be especially sensitive to the algorithm design and cup shape.
Beyond the algorithm effects, scan pattern also may be playing a role in measurement agreement, as all but one of the 10 statistically significant interdevice differences in offline measurements involved Cirrus, the only clinical device of the three with a raster scan pattern. Furthermore, bias versus the reference tended to be smallest with Cirrus, which may be related to the fact that the laboratory OCT system also used a dense raster scan pattern.
In conclusion, this study has highlighted yet another instance of the differences among the automated diagnostic outputs of clinical OCT devices. It serves as an important reminder that a complex technology like OCT, enhanced but also complicated by the software that reports critical information to the clinician, must be applied cautiously and thoughtfully toward patient care, especially when multiple OCT devices are involved in decision-making. This is one of the major reasons that OCT measurements are to be used as an aid to diagnosis and not for diagnosis directly. We wish to reach the goal of standardized OCT results across device platforms, and this study has provided evidence that certain phantoms could serve as very useful tools in moving toward this goal.
Acknowledgments
The authors gratefully acknowledge Food and Drug Administration biostatistician Bipasa Biswas for helpful discussions, and Raymond Graham of Ocular Instruments, Inc., for providing a drawing of the model eye.
Presented in part at the annual meeting of the Association for Research in Vision and Ophthalmology, Orlando, Florida, United States, May 2014.
Supported in part by National Institutes of Health contracts R01-EY013178, P30-EY008098 (Bethesda, MD), Eye and Ear Foundation (Pittsburgh, PA), Research to Prevent Blindness (New York, NY), and Food and Drug Administration Critical Path Initiative (Silver Spring, MD).
The mention of commercial products, their sources, or their use in connection with material reported herein is not to be construed as either an actual or implied endorsement of such products by the US Department of Health and Human Services.
Disclosure: A. Agrawal, None; J. Baxi, None; W. Calhoun, None; C.-L. Chen, None; H. Ishikawa, None; J.S. Schuman, Zeiss (R) P; G. Wollstein, None; D.X. Hammer, None
References
- 1. Schuman JS,, Wollstein G,, Farra T,, et al. Comparison of optic nerve head measurements obtained by optical coherence tomography and confocal scanning laser ophthalmoscopy. Am J Ophthalmol. 2003. ; 135: 504–512. [DOI] [PubMed] [Google Scholar]
- 2. Grover S,, Murthy, RK,, Brar VS,, Chalam, KV. Comparison of retinal thickness in normal eyes using Stratus and Spectralis optical coherence tomography. Invest Ophthalmol Vis Sci. 2010. ; 51: 2644–2647. [DOI] [PubMed] [Google Scholar]
- 3. Mylonas G,, Ahlers C,, Malamos P,, et al. Comparison of retinal thickness measurements and segmentation performance of four different spectral and time domain OCT devices in neovascular age-related macular degeneration. Br J Ophthalmol. 2009. ; 93: 1453–1460. [DOI] [PubMed] [Google Scholar]
- 4. Wolf-Schnurrbusch UE,, Ceklic L,, Brinkmann CK,, et al. Macular thickness measurements in healthy eyes using six different optical coherence tomography instruments. Invest Ophthalmol Vis Sci. 2009. ; 50: 3432–3437. [DOI] [PubMed] [Google Scholar]
- 5. Matt G,, Sacu S,, Buehl W,, et al. Comparison of retinal thickness values and segmentation performance of different OCT devices in acute branch retinal vein occlusion. Eye. 2011. ; 25: 511–518. [DOI] [PMC free article] [PubMed] [Google Scholar]
- 6. Krebs I,, Smretschnig E,, Moussa S,, Brannath W,, Womastek I,, Binder S. Quality and reproducibility of retinal thickness measurements in two spectral-domain optical coherence tomography machines. Invest Ophthalmol Vis Sci. 2011. ; 52: 6925–6933. [DOI] [PubMed] [Google Scholar]
- 7. Sander B,, Al-Abiji HA,, Kofod M,, Jørgensen TM. Do different spectral domain OCT hardwares measure the same? Comparison of retinal thickness using third-party software. Graefes Arch Clin Exp Ophthalmol. 2015; 253: 1915–1921. [DOI] [PMC free article] [PubMed] [Google Scholar]
- 8. Hood DC,, Raza AS,, Kay KY,, et al. A comparison of retinal nerve fiber layer (RNFL) thickness obtained with frequency and time domain optical coherence tomography (OCT). Opt Express. 2009. ; 17: 3997–4003. [DOI] [PMC free article] [PubMed] [Google Scholar]
- 9. Vizzeri G,, Weinreb RN,, Gonzalez-Garcia AO,, et al. Agreement between spectral-domain and time-domain OCT for measuring RNFL thickness. Br J Ophthalmol. 2009. ; 93: 775–781. [DOI] [PMC free article] [PubMed] [Google Scholar]
- 10. Leite MT,, Rao HL,, Weinreb RN,, et al. Agreement among spectral-domain optical coherence tomography instruments for assessing retinal nerve fiber layer thickness. Am J Ophthalmol. 2011. ; 151: 85–92. [DOI] [PubMed] [Google Scholar]
- 11. Savini G,, Barboni P,, Carbonelli M,, Sbreglia A,, Deluigi G,, Parisi V. Comparison of optic nerve head parameter measurements obtained by time-domain and spectral-domain optical coherence tomography. J Glaucoma. 2013. ; 22: 384–389. [DOI] [PubMed] [Google Scholar]
- 12. Rowe TS,, Zawadzki RJ. New developments in eye models with retina tissue phantoms for ophthalmic optical coherence tomography. Proc SPIE. 2012. ; 8229: 822913. [Google Scholar]
- 13. Baxi J,, Calhoun W,, Sepah YJ,, et al. Retina-simulating phantom for optical coherence tomography. J Biomed Opt. 2014. ; 19: 21106. [DOI] [PubMed] [Google Scholar]
- 14. Lee GC,, Smith GT,, Agrawal M,, Leng T,, Ellerbee AK. Fabrication of healthy and disease-mimicking retinal phantoms with tapered foveal pits for optical coherence tomography. J Biomed Opt. 2015. ; 20: 085004. [DOI] [PubMed] [Google Scholar]
- 15. de Kinkelder R,, de Bruin DM,, Verbraak FD,, van Leeuwen TG,, Faber DJ. Comparison of retinal nerve fiber layer thickness measurements by spectral-domain optical coherence tomography systems using a phantom eye model. J. Biophotonics. 2013. ; 6: 314–320. [DOI] [PubMed] [Google Scholar]
- 16. Agrawal A,, Connors M,, Beylin A,, et al. Characterizing the point spread function of retinal OCT devices with a model eye-based phantom. Biomed Opt Express. 2012. ; 3: 1116–1126. [DOI] [PMC free article] [PubMed] [Google Scholar]
- 17. Reis ASC,, Sharpe GP,, Yang H,, Nicolela MT,, Burgoyne CF,, Chauhan BC. Optic disc margin anatomy in glaucoma patients and normal controls with spectral domain optical coherence tomography. Ophthalmology. 2012. ; 119: 738–747. [DOI] [PMC free article] [PubMed] [Google Scholar]


