

Abstract
Despite substantial development of sophisticated subject-specific computational models of aerosol transport and deposition in human lungs, experimental validation of predictions from these new models is sparse. We collected aerosol retention and exhalation profiles in seven healthy volunteers and six subjects with mild-to-moderate COPD (FEV1 = 50-80%predicted) in the supine posture. Total deposition was measured during continuous breathing of 1 and 2.9 μm-diameter particles (tidal volume of 1 L, flow rate of 0.3 L/s and 0.75 L/s). Bolus inhalations of 1 μm particles were performed to penetration volumes of 200, 500 and 800 mL (flow rate of 0.5 L/s). Aerosol bolus dispersion (H), deposition, and mode shift (MS) were calculated from these data. There was no significant difference in total deposition between healthy subjects and those with COPD. Total deposition increased with increasing particle size and also with increasing flow rate. Similarly, there was no significant difference in aerosol bolus deposition between subject groups. Yet, the rate of increase in dispersion and of decrease in MS with increasing penetration volume was higher in subjects with COPD than in healthy volunteers (H: 0.798 ± 0.205 vs. 0.527 ± 0.122 mL/mL, p=0.01; MS: −0.271±0.129 vs. −0.145 ± 0.076 mL/mL, p=0.05) indicating larger ventilation inhomogeneities (based on H) and increased flow sequencing (based on MS) in the COPD than in the healthy group. In conclusion, in the supine posture, deposition appears to lack sensitivity for assessing the effect of lung morphology and/or ventilation distribution alteration induced by mild-to-moderate lung disease on the fate of inhaled aerosols. However, other parameters such as aerosol bolus dispersion and mode shift may be more sensitive parameters for evaluating models of lungs with moderate disease.
Keywords: Aerosol bolus dispersion, Mode shift, Heliox, Particles
1. Introduction
In recent years, sophisticated subject-specific computational models of aerosol transport and deposition in the human lung have been developed (De Backer et al., 2008; Hofmann, 2011; Ma & Lutchen, 2009; Vinchurkar et al., 2012). These models however often lacked subject-specific experimental validation. Most validation either used averaged in vivo data from the literature (Heyder, Gebhart, Rudolf, Schiller & Stahlhofen, 1986; Kim & Kang, 1997; Oldham, Phalen & Heistracher, 2000) or detailed comparison between in vitro data and in silico models (de Rochefort et al., 2007; Karl, Henry & Tsuda, 2004; Ma et al., 2009; van Ertbruggen, Corieri, Theunissen, Riethmuller & Darquenne, 2008). As considerable inter-subject variability exists both in airway geometry and in deposition data, validating models with averaged in vivo data is not optimal.
A few recent studies have focused on generating lung airways models from subjects in which aerosol deposition data were also collected. Vinchurkar and colleagues predicted aerosol deposition using subject-specific lobar flow distributions in subject-specific airway models (Vinchurkar et al., 2012). Even though these models only included a few airway generations, predictions agreed well with in vivo data. Conway and colleagues recently collected detailed datasets of aerosol deposition images in healthy subjects, together with associated anatomical data from high-resolution computed tomography (HRCT) for different inhalation profiles (Conway et al., 2012). These data were analyzed to provide not only spatial deposition data but also deposition per airway generation. Although such datasets provide an invaluable asset for investigators to test the accuracy of their modeling technique, a major limitation of the study was the different postures in which aerosol exposure (sitting posture) and lung HRCT scans (supine posture) were performed (Conway et al., 2012).
In the present study, a series of aerosol data were collected in the supine posture in a group of healthy subjects and a group of subjects with mild-to-moderate chronic obstructive pulmonary disease (COPD) for various breathing patterns. Computed tomography (CT) scans of each subject's upper and lower airways were obtained, again in the supine posture, from which subject-specific 3D models of the upper, large and medium airways have been reconstructed. Lower dimensional models are currently being incorporated to each 3D airway outlet to address tissue mechanics and the impact of disease on airflows and dosimetry in the deep lung. The modeling part of the study is beyond the scope of this report, which focuses on the experimental aerosol data.
2. Materials and methods
2.1. Subjects
Seven healthy subjects (FEV1 > 80%predicted and FEV1/FVC > 0.7) and six mild-to-moderate subjects with COPD (50%predicted < FEV1 < 80%predicted and/or FEV1/FVC < 0.7) participated in the study. Causes of COPD included asthma, intravenous drug use and uncertain etiologies. In the subjects with COPD, tobacco smoking histories ranged from 0 to 60 pack-years. Spirometry was obtained using a KoKo Spirometer (nSpired Health, Inc., Longmont, CO) on initial screening, prior to and directly after the aerosol studies. Subjects with COPD were entered based on their screening spirometry. The predicted values were derived from (Crapo, Morris & Gardner, 1981). There were no significant changes in spirometry following the aerosol studies. Response to an inhaled bronchodilator was not tested. The relevant anthropometric data of the subjects are listed in Table 1. The study was approved by the Institutional Review Board at the University of Washington, Seattle and by the Human Research Protection Program at the University of California at San Diego. Informed consent was obtained from each participant. Because of radiation exposure from CT scans, only male subjects were enrolled in this study. All subjects with COPD were asked to use their inhalers just prior to all studies.
Table 1.
Anthropometric data.
| Health status | Subject no. | Gender | Age, Yr | Height, cm | Weight, kg | FEV1, % predicted | FEV1/FVC |
|---|---|---|---|---|---|---|---|
| Healthy | H1 | Male | 35 | 170 | 68 | 113 | 0.88 |
| Healthy | H2 | Male | 52 | 165 | 97 | 117 | 0.79 |
| Healthy | H3 | Male | 47 | 183 | 89 | 85 | 0.74 |
| Healthy | H4 | Male | 26 | 183 | 82 | 94 | 0.80 |
| Healthy | H5 | Male | 34 | 193 | 100 | 104 | 0.84 |
| Healthy | H6 | Male | 21 | 168 | 54 | 89 | 0.73 |
| Healthy | H7 | Male | 21 | 173 | 64 | 95 | 0.81 |
| COPD | COPD1 | Male | 57 | 164 | 70 | 60 | 0.56 |
| COPD | COPD2 | Male | 55 | 178 | 66 | 56 | 0.48 |
| COPD | COPD3 | Male | 45 | 180 | 83 | 69 | 0.67 |
| COPD | COPD4 | Male | 54 | 187 | 84 | 58 | 0.52 |
| COPD | COPD5 | Male | 62 | 188 | 87 | 67 | 0.47 |
| COPD | COPD6 | Male | 45 | 178 | 75 | 83 | 0.66 |
Spirometry results just prior to the aerosol studies. FEV1, forced expiratory volume in 1s; FVC, forced vital capacity.
2.2. Equipment
Aerosol data were collected with equipment similar to that used in previous studies (Darquenne & Prisk, 2004, 2008, 2013; Peterson, Prisk & Darquenne, 2008). The setup allowed the subject to breathe through a two-way non-rebreathing valve either filtered air or from a reservoir. For the total deposition experiment, the reservoir was filled with aerosol and for the aerosol bolus experiment with particle-free heliox (80% helium and 20% oxygen). For the aerosol bolus experiment, additional computer-controlled pneumatic valves were switched during the test breath to allow for the inhalation of a ∼70-mL aerosol bolus followed by particle-free gas.
For both the total and regional (i.e. bolus) experiments, measurements of the aerosol concentration and the flow rate were provided by a photometer (model 993000, Pari, Starnberg, Germany) (Westenberger, Gebhart, Jaser, Knoch & Kîstler, 1992) and a Validyne differential pressure transducer M-45 (Validyne Engineering, Northridge, CA) connected via short tubes to the two ports of a pneumotachograph (Fleisch no. 1, OEM Medical, Richmond, VA), respectively. The photometer, pneumotachograph, and sliding valves were heated to body temperature to prevent water condensation during testing. A diffusion dryer (dead space of ∼ 10 mL) was positioned between the mouthpiece and the photometer to remove water vapor from the exhaled air, preventing condensation on the lenses of the photometer. The photometer was located sufficiently close to the mouthpiece (or the nose mask) such that any deposition in the experimental apparatus only minimally affected the measurements. A computer equipped with a 12-bit multifunction I/O card (DAQPad 6020E, National Instruments, Austin, TX) was used for data acquisition. Signals from the photometer and the pneumotachograph were sampled at 100 Hz.
2.3. Aerosol generation
Depending on the performed experiment, either the reservoir bag or the bolus tube was filled with aerosol containing 1.0 μm-diameter (CV < 3%) or 2.9 μm-diameter (CV < 5%) monodisperse polystyrene particles (Thermo Scientific, Fremont, CA). The particles were supplied in aqueous suspension and diluted with deionized water before being dispensed via an ultrasonic nebulizer, the Aeroneb™ (Aeroneb Lab; Nektar, San Carlos, CA). Before entering the bolus tube or the reservoir, the aerosol was directed through a heated hose and a diffusion dryer to remove water droplets so that the resulting aerosol was made of dry particles of uniform size.
2.4. Protocols
Two protocols were used in the study. One protocol, hereafter referred to as the total deposition study, aimed at measuring deposition occurring during steady-state continuous breathing of aerosol. The second protocol, hereafter referred to as the aerosol bolus test, was designed to probe deposition at various depths within the lung.
2.4.1. Total deposition study
Subjects were asked to breathe at a constant tidal volume of one liter and at a flow rate of either 0.3 L/s or 0.75 L/s. A flow meter provided feedback to the subject, and an audible metronome was used to maintain a constant breathing frequency. Subjects inhaled from the aerosol reservoir for 20 breaths and exhaled into the room through a filter. Tests were performed with both 1.0 and 2.9 μm-diameter particles. The protocol was repeated twice for each experimental condition. All subjects performed the experiments in the supine posture while breathing through a mouthpiece with a nose clip on. The healthy group also repeated these measurements during nose breathing while wearing a mask.
2.4.2. Aerosol bolus test
All tests were performed with the subjects in the supine posture while breathing through a mouthpiece. Aerosol boli were administered to several specific volumetric lung depths during inhalation of air or heliox. The volumetric lung depth or penetration volume (Vp) was defined as the volume of air inhaled from the mode of the aerosol bolus to the end of the inhalation. The test breaths consisted of a one liter inspiration from functional residual capacity (FRC) at a flow rate of ∼0.50 L/sec, immediately followed by an expiration to residual volume (RV) at the same flow rate of 0.50 L/sec. A flow meter provided visual feedback to the subject. During the inspiration, an aerosol bolus was introduced at different target penetration volumes: 150, 500 and 800 mL Penetration volumes were measured from the mouth such that the dead space of the experimental apparatus was not included in the measured penetration volumes. For tests performed with heliox, subjects were asked to perform several vital capacity maneuvers inhaling from the reservoir filled with particle-free heliox and remained breathing heliox between aerosol bolus tests in order to ensure the lungs were equilibrated with heliox. The wash-in was monitored by a helium analyzer (Analox ATA TM, Analox Sensor Technology, Stokesley, UK) measuring the concentration of helium in the exhaled gases. The protocol began when the expired helium concentration was more than 70%. Tests were performed with 1.0 μm-diameter particles. The protocol was repeated three times for each combination of penetration volume, and carrier gas. Prior to each experiment, flow calibration was performed with the test gases (air or heliox) using a 3-L calibration syringe providing accurate flow measurements for both gases.
2.5. Data analysis
2.5.1. Total deposition study
Total deposition (DEtot) was calculated for each breath by using the following equation
| (1) |
where Nin and Nex are the number of inspired and expired particles and Vin and Vex are the inspired and expired volumes, respectively (Darquenne, Paiva, West & Prisk, 1997; Darquenne & Prisk, 2004, 2008). Only the breaths where Vin and Vex differed by less than 10% were considered in the analysis. The first few breaths of the test were aerosol wash-in and were discarded in the calculation of steady-state deposition.
2.5.2. Aerosol bolus test
For each test, aerosol deposition (DE), aerosol bolus dispersion (H) and mode shift (MS) were calculated in the same manner as in our previous studies (Darquenne & Prisk, 2008; Darquenne, West & Prisk, 1998). Briefly, aerosol deposition was calculated using the following equation
| (2) |
where Nin and Nex are the number of particles in the inspired and expired bolus, respectively. Nin and Nex were calculated from the integration of the aerosol concentration multiplied by the instantaneous flow rate. The integration was only done when the concentration exceeded 5% of the maximal expired concentration to reduce error due to signal noise (Darquenne et al., 1998).
We computed the bolus half-width, H, as the difference in volume (mL) between the two points located at one-half the maximum concentration of the bolus when plotted against respired volume. The change in half-width between the inhaled and exhaled boluses reflects the aerosol dispersion, H, and was obtained by the following equation
| (3) |
where Hin and Hex are the half-width of the inspired and expired boluses, respectively.
The mode shift (MS) was defined as the difference between the position of the expired bolus mode (Mex) and the position of the inspired bolus (Vp)
| (4) |
A negative value of MS indicates that the position of the mode of the expired bolus has shifted to a smaller lung volume than the location of the inspired bolus, i.e., that the bolus has moved toward the mouth.
2.5.3. Statistical analysis
Statistical analyses were performed by using Systat V5.0 (Systat, Evanston, IL). In the total deposition study, data were grouped on the basis of five categorical variables (flow rate, particle size, breathing mode, subject number and disease status). Analysis of variance for correlated samples was performed for data collected during mouth breathing to test for differences in flow rate, disease state and particle size. In the group of healthy subjects, the paired t-test was used to check for differences between two given set of experimental conditions (see results section). Significant differences were accepted at the p ≤ 0.05 level.
In the bolus test, data were grouped on the basis of four categorical variables (carrier gas, penetration volume, subject number and disease status). A one-way analysis of variance for correlated samples was performed to test for differences between the chosen categorical variables. Post-ANOVA pair-wise comparisons using Bonferroni adjustment was performed for tests showing significant F-ratios. Significant differences were accepted at the p ≤ 0.05 level. For each subject and for each experimental condition (penetration volume and carrier gas), one single value for DE, H and MS was determined and used in the statistical analysis. Previous studies (Blanchard, 1996; Darquenne & Prisk, 2008; Peterson et al., 2008) have shown that, beyond a penetration volume of 100 mL, these bolus parameters vary linearly with increasing penetration volume (Vp). Actual Vp values measured during testing varied from the target penetration volumes specified in the computer software. To compare deposition at target penetration volumes, data points for a given subject, and carrier gas were obtained for each target penetration volume via linear regression analysis (Darquenne & Prisk, 2008; Peterson et al., 2008).
3. Results
3.1. Total deposition study
Fig. 1 displays the individual data obtained in the group of healthy subjects for all experimental conditions studied. At both flow rates and for both particle sizes, deposition was higher during nose breathing than during mouth breathing. Averaged over the seven healthy subjects, deposition of 1 μm-diameter particles increased from 43.7±8.5% (mean±SD) during mouth breathing to 57.3±5.0% during nose breathing at a flow rate of 0.3 L/s (p = 0.001) and from 30.1±5.6% to 56.5±3.1% at a flow rate of 0.75 L/s (p < 0.001). For 3 μm-diameter particles, deposition increased from 68.9±5.9% to 80.4±1.4% at 0.3 L/s (p = 0.004) and from 54.4±7.4% to 78.9±4.1% at 0.75 L/s (p < 0.001). For both mouth and nose breathing, deposition also significantly increased with increasing particle size at both flow rates (p < 0.003) and with increasing flow rates at both particle sizes (p < 0.003).
Fig. 1.
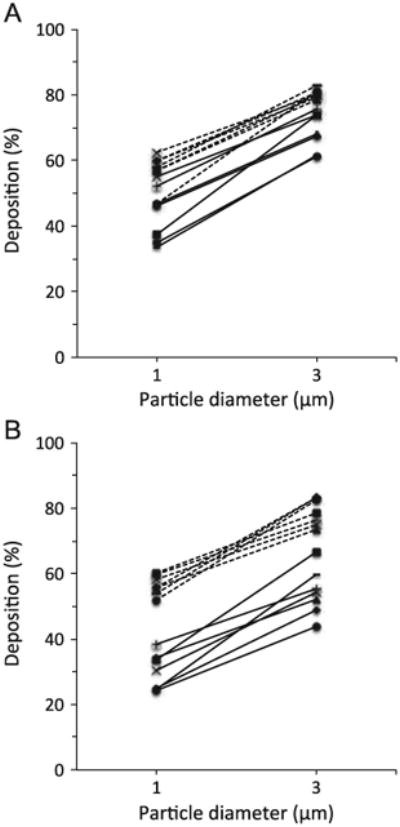
Total deposition in healthy subjects during mouth (solid line) and nose (dashed line) breathing. A: flow rate of 0.3 L/s. B: flow rate of 0.75 L/s.
The averaged data for the healthy group during mouth breathing (open symbol, mean±SD) are summarized in Fig. 2 and compared to the individual data obtained in the group of subjects with mild-to-moderate COPD (closed symbols). There was no significant difference in total deposition between the groups for all conditions that were studied.
Fig. 2.
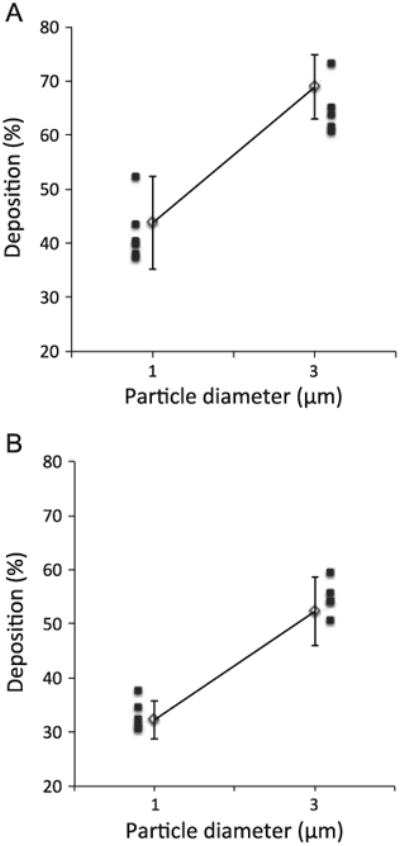
Total deposition in the healthy (solid line, open symbol, mean7SD) and COPD group (closed symbols, individual data) during mouth breathing. A: flow rate of 0.3 L/s. B: flow rate of 0.75 L/s.
Individual data for each experimental condition can be found in the Appendix.
3.2. Aerosol bolus test
Fig. 3 shows raw data obtained in one healthy subject while breathing air for each bolus parameter (i.e deposition (Fig. 3A), dispersion (Fig. 3B) and mode shift (Fig. 3C)) as a function of penetration volume, illustrating the linear relationship between each bolus parameter and penetration volume. Similar trends were found for both carrier gases and for all subjects in each group. Averaged deposition data (mean ± SD) as a function of target penetration volume are shown in Fig. 4 for both carrier gases (air and heliox) in the healthy (Fig. 4A) and COPD (Fig. 4B) group. No significant effect of carrier gas on deposition was found. Similarly there was no significant effect of carrier gas on dispersion and mode shift in each group (data not shown).
Fig. 3.
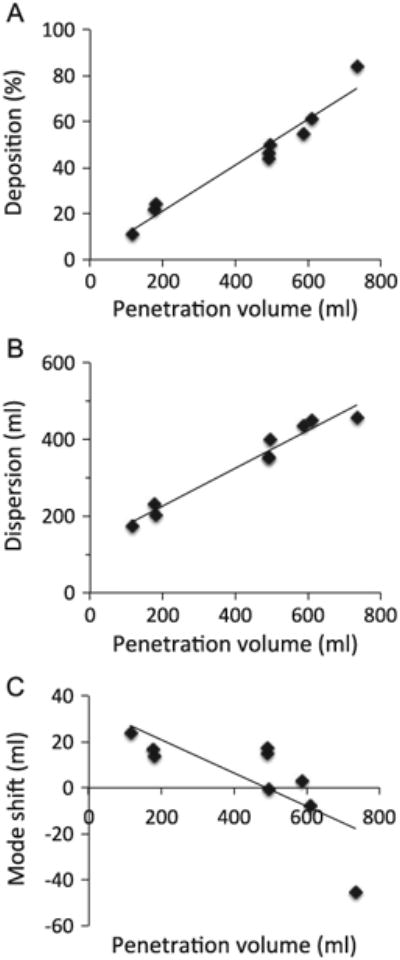
Aerosol deposition (Panel A), dispersion (Panel B) and mode shift (Panel C) in one healthy subject. Raw data for each individual bolus test performed in air are shown along with linear regression line from which data at targeted penetration volume were calculated (see data analysis section for details).
Fig. 4.
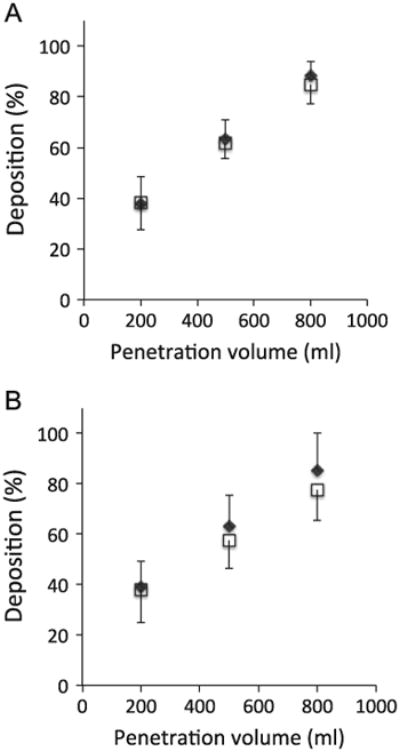
Aerosol bolus deposition of 1 μm-diameter particles in air (open square symbols) and heliox (closed diamond symbols) as a function of penetration volume in healthy subjects (panel A) and mild-to-moderate COPD subjects (panel B). Data are shown as mean ± SD.
The slope of the regression lines between each bolus parameter and penetration volume is displayed in Fig. 5 for both the healthy and COPD group for test performed in air. While there was no difference in the slope of deposition as a function of penetration volume between the two groups (Fig. 5A), the dispersion slope was significantly higher in the COPD group than in the healthy group (0.798 ± 0.205 vs. 0.527 ± 0.122 mL/mL, mean ± SD, p=0.01, Fig. 5B) and the mode shift slope was significantly more negative in the COPD group than in the healthy group (−0.271±0.129 vs. −0.145 ± 0.076 mL/mL, p=0.05, Fig. 5C). The individual regression slope for each aerosol bolus parameter (deposition, dispersion and mode shift) can be found in the Appendix both for data collected in air and in heliox.
Fig. 5.
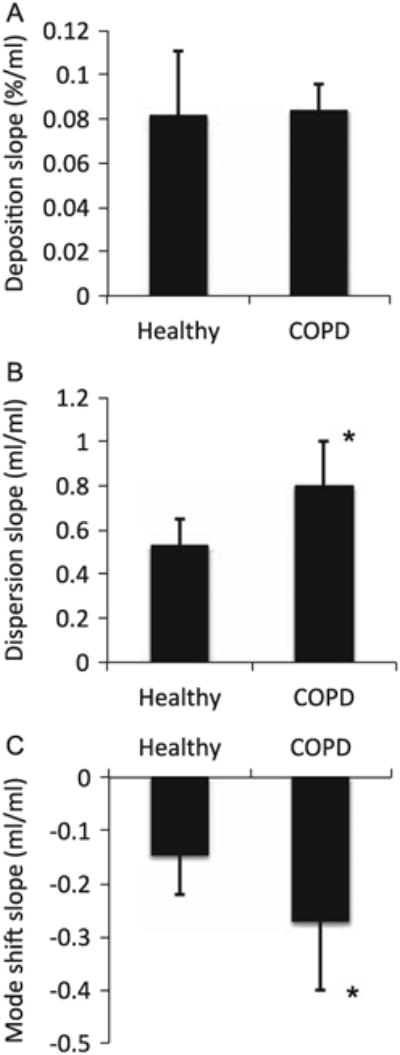
Slope of the regression lines between aerosol bolus parameters and penetration volume in the healthy and COPD group. A: deposition. B: dispersion. C: mode shift. *Significantly different compared with the healthy group, p ≤ 0.05.
4. Discussion
In recent years, there has been a substantial development of sophisticated subject-specific computational models of aerosol transport and deposition in human lungs. Experimental validation of predictions from these new models is relatively sparse. To address this shortage, we collected a comprehensive set of aerosol deposition data in healthy subjects and those with mild-to-moderate COPD. Although beyond the scope of this article, these subjects also completed CT scans from which 3D/CFD models of aerosol transport are currently being developed with the ultimate goal of evaluating model performance. The present study focuses on the experimental aerosol data. We found no significant difference in deposition between the two groups of subjects both for the total deposition study and the aerosol bolus test. However, both aerosol bolus dispersion and mode shift were increased in the COPD group when compared to healthy subjects.
4.1. Total deposition study
The effect of breathing mode, particle size and flow rate on aerosol deposition in healthy subjects has been extensively studied (Heyder, Armbruster, Gebhart, Grein & Stahlhofen, 1975; Heyder, Gebhart, Heigwer, Roth & Stahlhofen, 1973; Heyder et al., 1986; Lippmann, 1976). Data collected in the present study (Fig. 1) agree well with these previous studies: deposition increased with increasing particle size and increasing flow rate, and deposition was higher during nose breathing than during mouth breathing most likely because of the high filtering efficiency of the nose. The comparison between the healthy and mild-to-moderate COPD group showed no significant difference in total deposition (Fig. 2). These results contrast with previous aerosol studies where deposition of 1.0 μm (Kim & Kang, 1997) and 1.5 μm-diameter particles (Smaldone & Messina, 1985) was higher in subjects with COPD than in healthy subjects. Several factors may explain this difference. These previous studies were performed with subjects in the upright-seated posture (as opposed to supine in this study), used a smaller tidal volume (∼500 mL vs. 1000 mL in this study) and studied more subjects with more severe COPD (FEV1 (%predicted) was 45 ± 19% (Kim & Kang, 1997) and 33 ± 15% (Smaldone & Messina, 1985) compared to 61 ± 14% in this study).
Very few studies have assessed the effect of posture on aerosol deposition in the human lung. However, it is known that posture affects lung volume with functional residual capacity (FRC) being ∼30% less in the supine than in the upright position (Elliott, Prisk, Guy & West, 1994; Ibanez & Raurich, 1982). A recent study by Van Holsbeke and colleagues also showed that the size of the extra-thoracic airway is significantly affected by posture (Van Holsbeke et al., 2014). When supine, the average and minimal cross-sections of the upper airway were reduced by ∼ 10 and 27%, respectively, compared to sitting. Pilot data in one healthy subject (Conway et al., 2012) showed a significant increase in the deposition of 5 μm-diameter particles in the supine compared to the seated posture with the increase being mainly due to a larger extra-thoracic deposition. This is consistent with a smaller upper airway size in the supine posture. Indeed, for a similar flow rate, a smaller cross-section leads to higher velocities and hence to higher deposition by inertial impaction and turbulent mixing (Darquenne, 2012). Although intra-thoracic deposition of 5 μm-diameter particles was not largely different between postures (Conway et al., 2012), a recent study by Sa and colleagues also showed a significant shift in the relative deposition in the supine posture from the lung periphery to the central airways (Sa, Zeman, Bennett, Prisk & Darquenne, 2014).
For the smaller particle size (i.e. 1 μm) for which gravitational sedimentation is the dominant mechanism of aerosol deposition, one might expect a smaller effect of the reduction in the upper airway size on extra-thoracic deposition and a larger effect of a reduction in lung volume on intra-thoracic deposition. Indeed, gravitational sedimentation is most effective in small and medium-sized airways and in the lung periphery where distance to be covered by settling particles before they deposit is small, an effect that is enhanced by reduced lung volume thereby reduced airway size.
Smaldone and Messina showed that in subjects with COPD, central deposition predominates as opposed to healthy subjects where deposition is more uniformly distributed throughout the lung (Smaldone & Messina, 1985). This increased central deposition in the subjects with COPD was mainly attributed to flow limitation and obstruction in the small airways that caused more particles to deposit, particularly during expiration. The volume of the upper respiratory tract and conducting airways amounts to about 150 to 200 mL This represents ∼40% of the tidal volume (TV) used in previous studies (TV=500 mL) and only ∼ 20% of the tidal volume used in the present study (TV= 1000 mL). A larger fraction of the inspired particles penetrate the alveolar region with the larger tidal volume leading to higher alveolar deposition than with a smaller tidal volume. Thus, a larger tidal volume will tend to decrease the impact of central deposition on overall deposition.
Finally, one might expect that the more severe the disease, the more obstruction and flow limitation and the more deposition. The subjects with mild-to-moderate COPD that were used in the present study may have curtailed the increase in central deposition compared to the more severe patients used in previous studies.
4.2. Aerosol bolus test
Similarly to the total deposition study, there was no significant difference in deposition between the healthy subjects and those with COPD. Further for each group, there was no difference in deposition between air and heliox (Fig. 4). In contrast, previous studies in seated healthy subjects have shown a significant decrease in deposition in the upper respiratory tract and an increase in peripheral deposition when breathing heliox compared to air (Anderson, Svartengren, Philipson & Camner, 1990; Peterson et al., 2008; Svartengren, Anderson, Philipson & Camner, 1989). The reduced deposition in the upper respiratory tract was attributed to a reduction in the level of turbulence in that region while breathing heliox. Levels of turbulence are a function of both gas velocities and properties. The Reynolds number Re is used to characterize flow regime and is defined as
| (5) |
where ρ and μ are the gas density and gas dynamic viscosity, respectively, u is the mean flow velocity in the airway, d the airway diameter and Q the flow rate in the airway. A high Re number is associated with turbulent flow and a low Re number with laminar flow. The use of heliox, which has a density of about one third that of air, converts some if not all of the turbulent flow into laminar flow, reducing deposition in the upper airway (Darquenne, 2012). For a constant flow rate, the mean velocity u is inversely proportional to the cross-section of the airway and therefore inversely proportional to the square of the airway diameter d. It follows that Re is proportional to ρ/(μd) (Eq. (5)). In the present study, subjects performed the tests in the supine posture where the minimal cross-section of the upper airway is ∼27% less than when seated (Van Holsbeke et al., 2014), resulting in a higher Re number and hence higher levels of turbulence. Our data suggest that the opposite effect of a reduction in upper airway cross-section in the supine posture (potentially increasing turbulence) and of a reduction in gas density when breathing heliox (reducing turbulence) was such that significant levels of turbulence were still present at the glottic constriction when breathing heliox, preventing deposition to be significantly reduced compared to air breathing conditions.
In contrast to the deposition studies, there were significant differences in aerosol bolus dispersion and mode shift between the healthy and COPD group (Fig. 5). Aerosol bolus dispersion allows for probing convective mixing, which incorporates all the mechanisms that contribute to the transfer of inhaled particles to the resident airway, except for Brownian diffusion. Factors include velocity patterns, airway and alveolar geometries, asymmetries between inspiratory and expiratory flows, inhomogeneous ventilation of the lung, and cardiogenic mixing. In particular, regional variations in airway resistance and in the compliance of subtended acinar units create heterogeneities in regional time constants, which affect the synchrony of regional ventilation and leads to an increase in the width of the expired bolus. Aerosol bolus dispersion has been shown to detect changes in regional ventilation both in healthy (Darquenne, West & Prisk, 1999) and diseased lungs (Anderson et al., 1989; Blanchard, 1996; Kohlhaufl et al., 1999). Our data showed a significantly larger slope of dispersion as a function of penetration volume in subjects with COPD compared to healthy subjects (Fig. 5B), consistent with increased ventilation heterogeneities in the diseased lung compared to the healthy lung.
Alterations in the sequence of filling and emptying of lung units will not only cause spreading of the exhaled bolus but also a shift in its position in the expired air. Previous studies in subjects with emphysema (Kohlhaufl et al., 1997) and cystic fibrosis (P. J. Anderson et al., 1989; Brown, Gerrity & Bennett, 1998) have shown a larger mouthward mode shift compared to healthy controls. Similar results were observed in this study (Fig. 5C) with a steeper slope of mode shift as a function of penetration volume in the mild-to-moderate COPD group than in the healthy subjects.
5. Summary
We collected aerosol deposition data in subjects with mild-to-moderate COPD and healthy controls with the ultimate goal of evaluating the performance of subject-specific 3D/CFD lung model of aerosol transport. Data were collected in the supine posture to match posture during CT scanning. While there was no significant difference in deposition between the two groups of subjects, both aerosol bolus dispersion and mode shift were increased in the COPD group when compared to healthy subjects. Therefore, in the supine posture, deposition appears to lack sensitivity for assessing the effect of lung morphology and/or ventilation distribution alteration induced by mild-to-moderate lung disease on the fate of inhaled aerosols. Other parameters such as aerosol bolus dispersion and mode shift may be more sensitive parameters for evaluating lung models with moderate disease.
Acknowledgments
The study was funded by R01 HL073598 from NHLBI at NIH.
Appendix A. Individual data.
Total deposition studies
Tables A1 and A2 list the individual deposition data obtained in the healthy and COPD group, respectively. For each subject and each experimental condition, data are provided as the mean (and standard deviation) over all the breaths included in the analysis (see Section 2.5.1 for inclusion criteria). Note that COPD5 was unable to sustain a breathing flow of 0.75 L/s and that data related to the high flow experimental conditions were collected at a flow of 0.6 L/s and a tidal volume of 0.76 L for this subject.
Table A1.
Individual deposition data for the total deposition studies in healthy subjects.
| Subject | Mouth Breathing | Nose breathing | ||||||
|---|---|---|---|---|---|---|---|---|
|
|
|
|||||||
| Flow = 0.3 L/s | Flow = 0.75 L/s | Flow = 0.3 L/s | Flow = 0.75 L/s | |||||
|
|
|
|
|
|||||
| dp=1 μm | 2.9 μm | 1 μm | 2.9 μm | 1 μm | 2.9 μm | 1 μm | 2.9 μm | |
| H1 | 33.6 (3.5) | 61.8 (3.8) | 24.5 (3.1) | 59.7 (7.2) | 58.0 (3.5) | 83.0 (5.4) | 54.0 (4.2) | 83.3 (1.6) |
| H2 | 37.3 (2.7) | 74.1 (5.1) | 33.5 (2.1) | 66.8 (5.4) | 57.0 (8.4) | 80.1 (6.4) | 60.2 (2.8) | 78.6 (4.4) |
| H3 | 34.9 (5.4) | 61.3 (4.1) | 24.3 (2.0) | 43.9 (4.3) | 46.8 (1.9) | 81.2 (9.5) | 51.9 (2.2) | 82.4 (2.7) |
| H4 | 46.8 (5.8) | 68.0 (3.2) | 34.4 (3.8) | 52.1 (5.3) | 56.8 (2.9) | 78.6 (6.4) | 55.7 (2.2) | 73.6 (2.9) |
| H5 | 46.2 (1.9) | 67.6 (4.8) | 25.0 (3.7) | 48.8 (6.0) | 60.0 (2.0) | 80.7 (5.9) | 55.6 (2.1) | 83.1 (1.9) |
| H6 | 55.1 (1.6) | 73.8 (2.0) | 30.4 (1.9) | 54.1 (3.3) | 62.5 (1.5) | 80.1 (1.9) | 58.3 (1.8) | 74.9 (1.8) |
| H7 | 52.1 (2.1) | 75.7 (2.5) | 38.4 (1.7) | 55.2 (3.6) | 59.9 (1.5) | 79.3 (2.5) | 59.7 (2.6) | 76.3 (1.9) |
Data are shown as mean (SD) and are expressed in %. SD: standard deviation, dp: particle diameter.
Table A2. Individual deposition data for the total deposition studies in COPD subjects.
| Subject | Mouth Breathing | |||
|---|---|---|---|---|
|
|
||||
| Flow = 0.3 L/s | Flow = 0.75 L/s | |||
|
|
|
|||
| dp=1 μm | 2.9 μm | 1 μm | 2.9 μm | |
| COPD1 | 37.8 (7.2) | 73.1 (7.7) | 37.7 (4.1) | 59.4 (14.1) |
| COPD2 | 40.3 (4.2) | 63.7 (5.3) | 32.3 (3.4) | 54.0 (3.3) |
| COPD3 | 52.1 (2.1) | 65.0 (2.2) | 34.4 (2.4) | 55.7 (3.2) |
| COPD4 | 39.7 (2.1) | 61.3 (2.8) | 30.4 (1.9) | 54.0 (3.3) |
| COPD5 | 37.1 (1.9) | 60.5 (8.4) | 27.4 (2.6)a | 40.8 (3.8)a |
| COPD6 | 43.3 (1.6) | 47.1 (3.4) | 31.2 (1.9) | 50.5 (4.1) |
Data are shown as mean(SD) and are expressed in %. SD: standard deviation, dp: particle diameter.
Flow and tidal volume were 0.6 L/s and 0.76 L as subject was unable to breathe at a flow rate of 0.75 L/s.
Table A3.
Individual slopes of the regression lines between aerosol bolus parameters and penetration volume in the healthy and COPD subjects (particle size dp=1 μm).
| Subject no. | AIR | HELIOX | ||||
|---|---|---|---|---|---|---|
|
|
|
|||||
| DE slope (%/ml) | H slope (ml/ml) | MS slope (ml/ml) | DE slope (%/ml) | H slope (ml/ml) | MS slope (ml/ml) | |
| H1 | 0.100 | 0.493 | −0.072 | 0.090 | 0.524 | −0.112 |
| H2 | 0.068 | 0.504 | −0.137 | 0.041 | 0.514 | −0.214 |
| H3 | 0.045 | 0.430 | −0.126 | 0.051 | 0.491 | −0.069 |
| H4 | 0.120 | 0.512 | −0.043 | 0.061 | 0.567 | −0.202 |
| H5 | 0.045 | 0.457 | −0.177 | 0.091 | 0.541 | −0.048 |
| H6 | 0.091 | 0.496 | −0.197 | 0.062 | 0.846 | −0.258 |
| H7 | 0.103 | 0.796 | −0.267 | 0.069 | 1.094 | −0.238 |
| COPD1 | 0.096 | 0.482 | −0.094 | 0.080 | 0.917 | −0.100 |
| COPD2 | 0.100 | 1.055 | −0.191 | 0.119 | 0.934 | −0.015 |
| COPD3 | 0.077 | 0.687 | −0.475 | 0.073 | 0.688 | −0.488 |
| COPD4 | 0.075 | 0.794 | −0.301 | 0.061 | 1.015 | −0.327 |
| COPD5 | 0.085 | 0.792 | −0.323 | 0.081 | 1.129 | −0.250 |
| COPD6 | 0.069 | 0.976 | −0.244 | 0.050 | 0.911 | −0.441 |
DE: deposition, H: dispersion, MS: mode shift
Aerosol bolus tests
Table A3 list the individual slope of the bolus parameters as a function of penetration volumes for both groups and both carrier gases (air and heliox).
References
- Anderson M, Svartengren M, Philipson K, Camner P. Deposition in man of particles inhaled in air or helium-oxygen at different flow rates. Journal of Aerosol Medicine. 1990;3:209–216. [Google Scholar]
- Anderson PJ, Blanchard JD, Brain JD, Feldman HA, McNamara JJ, Heyder J. Effect of cystic fibrosis on inhaled aerosol boluses. American Review of Respiratory Disease. 1989;140:1317–1324. doi: 10.1164/ajrccm/140.5.1317. [DOI] [PubMed] [Google Scholar]
- Blanchard JD. Aerosol bolus dispersion and aerosol-derived airway morphometry: assessment of lung pathology and response to therapy, part 1. Journal of Aerosol Medicine. 1996;9:183–205. doi: 10.1089/jam.1996.9.183. [DOI] [PubMed] [Google Scholar]
- Brown JS, Gerrity TR, Bennett WD. Effect of ventilation distribution on aerosol bolus dispersion and recovery. Journal of Applied Physiology. 1998;85:2112–2117. doi: 10.1152/jappl.1998.85.6.2112. [DOI] [PubMed] [Google Scholar]
- Conway J, Fleming J, Majoral C, Katz I, Perchet D, Peebles C, Tossici-Bolt L, Collier L, Caillibotte G, Pichelin M, Sauret-Jackson V, Martonen T, Apiou-Sbirlea G, Muellinger B, Kroneberg P, Gleske J, Scheuch G, Texereau J, Martin A, Montesantos S, Bennett M. Controlled, parametric, individualized, 2-D and 3-D imaging measurements of aerosol deposition in the respiratory tract of healthy human subjects for model validation. Journal of Aerosol Science. 2012;52:1–17. [Google Scholar]
- Crapo RO, Morris AH, Gardner RM. Reference spirometric values using techniques and equipment that meet ATS recommendations. The American Review of Respiratory Disease. 1981;123:659–664. doi: 10.1164/arrd.1981.123.6.659. [DOI] [PubMed] [Google Scholar]
- Darquenne C. Aerosol deposition in health and disease. Journal of Aerosol Medicine and Pulmonary Drug Delivery. 2012;25:140–147. doi: 10.1089/jamp.2011.0916. http://dx.doi.org/10.1089/jamp.2011.0916. [DOI] [PMC free article] [PubMed] [Google Scholar]
- Darquenne C, Paiva M, West JB, Prisk GK. Effect of microgravity and hypergravity on deposition of 0.5- to 3-μm-diameter aerosol in the human lung. Journal of Applied Physiology. 1997;83:2029–2036. doi: 10.1152/jappl.1997.83.6.2029. [DOI] [PubMed] [Google Scholar]
- Darquenne C, Prisk GK. Aerosol deposition in the human respiratory tract breathing air and 80:20 heliox. Journal of Aerosol Medicine. 2004;17:278–285. doi: 10.1089/jam.2004.17.278. [DOI] [PMC free article] [PubMed] [Google Scholar]
- Darquenne C, Prisk GK. Deposition of inhaled particles in the human lung is more peripheral in lunar than in normal gravity. European Journal of Applied Physiology and Occupational Physiology. 2008;103:687–695. doi: 10.1007/s00421-008-0766-y. [DOI] [PubMed] [Google Scholar]
- Darquenne C, Prisk GK. Particulate deposition in the human lung under lunar habitat conditions. Aviation Space Environmental Medicine. 2013;84:190–195. doi: 10.3357/asem.3387.2013. [DOI] [PubMed] [Google Scholar]
- Darquenne C, West JB, Prisk GK. Deposition and dispersion of 1 μm aerosol boluses in the human lung: Effect of micro- and hypergravity. Journal of Applied Physiology. 1998;85:1252–1259. doi: 10.1152/jappl.1998.85.4.1252. [DOI] [PubMed] [Google Scholar]
- Darquenne C, West JB, Prisk GK. Dispersion of 0.5–2 μm aerosol in μG and hypergravity as a probe of convective inhomogeneity in the lung. Journal of Applied Physiology. 1999;86:1402–1409. doi: 10.1152/jappl.1999.86.4.1402. [DOI] [PubMed] [Google Scholar]
- De Backer JW, Vos WG, Gorle CD, GermonprÇ P, Partoens B, Wuyts FL, Parizel PM, De Backer W. Flow analyses in the lower airways: patient-specific model and boundary conditions. Medical Engineering & Physics. 2008;30:872–879. doi: 10.1016/j.medengphy.2007.11.002. [DOI] [PubMed] [Google Scholar]
- de Rochefort L, Vial L, Fodil R, Maitre X, Louis B, Isabey D, Caillibotte G, Thiriet M, Bittoun J, Durand E, Sbirlea-Apiou G. In vitro validation of computational fluid dynamic simulation in human proximal airways with hyperpolarized 3He magnetic resonance phase-contrast velocimetry. Journal of Applied Physiology. 2007;102:2012–2023. doi: 10.1152/japplphysiol.01610.2005. [DOI] [PubMed] [Google Scholar]
- Elliott AR, Prisk GK, Guy HJB, West JB. Lung volumes during sustained microgravity on spacelab SLS-1. Journal of Applied Physiology. 1994;77:2005–2014. doi: 10.1152/jappl.1994.77.4.2005. [DOI] [PubMed] [Google Scholar]
- Heyder J, Armbruster L, Gebhart J, Grein E, Stahlhofen W. Total deposition of aerosol particles in the human respiratory tract for nose and mouth breathing. Journal of Aerosol Science. 1975;6:311–328. [Google Scholar]
- Heyder J, Gebhart J, Heigwer G, Roth C, Stahlhofen W. Experimental studies of the total deposition of aerosol particles in the human respiratory tract. Journal of Aerosol Science. 1973;4:191–208. [Google Scholar]
- Heyder J, Gebhart J, Rudolf G, Schiller CF, Stahlhofen W. Deposition of particles in the human respiratory tract in the size range 0.005-15μm. Journal of Aerosol Science. 1986;17:811–825. [Google Scholar]
- Hofmann W. Modeling inhaled particle deposition in the human lung: a review. Journal of Aerosol Science. 2011;42:693–724. [Google Scholar]
- Ibanez J, Raurich JM. Normal values of functional residual capacity in the sitting and supine positions. Intensive Care Medicine. 1982;8(4):173–177. doi: 10.1007/BF01725734. [DOI] [PubMed] [Google Scholar]
- Karl A, Henry FS, Tsuda A. Low Reynolds number viscous flow in an alveolated duct. The Journal of Biomechanical Engineering (ASME Transactions) 2004;126:420–429. doi: 10.1115/1.1784476. [DOI] [PubMed] [Google Scholar]
- Kim CS, Kang TC. Comparative measurement of lung deposition of inhaled fine particles in normal subjects and patients with obstructive airway disease. American Journal of Respiratory and Critical Care Medicine. 1997;155:899–905. doi: 10.1164/ajrccm.155.3.9117024. [DOI] [PubMed] [Google Scholar]
- Kohlhaufl M, Brand P, Meyer T, Scheuch G, Weber N, Haussinger K, Schultz H, Heyder J. Detection of impaired intrapulmonary convective mixing by aerosol bolus dispersion in patients with emphysema. European Journal of Medical Research. 1997;2:121–128. [PubMed] [Google Scholar]
- Kohlhaufl M, Brand P, Rock C, Radons T, Scheuch G, Meyer T, Schulz H, Pfeifer KJ, Haussinger K, Heyder J. Noninvasive diagnosis of emphysema: aerosol morphometry and aerosol bolus dispersion in comparison to HRCT. American Journal of Respiratory and Critical Care Medicine. 1999;160:913–918. doi: 10.1164/ajrccm.160.3.9811051. [DOI] [PubMed] [Google Scholar]
- Lippmann M. Regional deposition of particles in the human respiratory tract. In: Lee DHK, Falk HL, Murphy SD, Geiger SR, editors. Handbook of physiology. Vol. 9. Bethesda, Maryland: American Physiological Society; 1976. pp. 213–232. [Google Scholar]
- Ma B, Lutchen KR. CFD simulation of aerosol deposition in an anatomically based human large-medium airway model. Annals of Biomedical Engineering. 2009;37:271–285. doi: 10.1007/s10439-008-9620-y. [DOI] [PubMed] [Google Scholar]
- Ma B, Ruwet P, Corieri P, Theunissen R, Riethmuller ML, Darquenne C. CFD simulation and experimental validation of fluid flow and particle transport in a model of alveolated airways. Journal of Aerosol Science. 2009;40:403–414. doi: 10.1016/j.jaerosci.2009.01.002. http://dx.doi.org/10.1016/j.jaerosci.2009.01.002. [DOI] [PMC free article] [PubMed] [Google Scholar]
- Oldham MJ, Phalen RF, Heistracher T. Computational fluid dynamic predictions and experimental results for particle deposition in an airway model. Aerosol Science and Technology. 2000;32:61–71. [Google Scholar]
- Peterson JB, Prisk GK, Darquenne C. Aerosol deposition in the human lung periphery is increased by reduced-density gas breathing. Journal of Aerosol Medicine and Pulmonary Drug Delivery. 2008;21:159–168. doi: 10.1089/jamp.2007.0651. [DOI] [PMC free article] [PubMed] [Google Scholar]
- Sa RC, Zeman KL, Bennett WD, Prisk GK, Darquenne C. Effect of posture on regional deposition of coarse particles in the healthy human lung. American Journal of Respiratory and Critical Care Medicine. 2014;187:A349. doi: 10.1089/jamp.2014.1189. [DOI] [PubMed] [Google Scholar]
- Smaldone GC, Messina MS. Flow limitation, cough amd patterns of aerosol deposition in humans. Journal of Applied Physiology. 1985;59:515–520. doi: 10.1152/jappl.1985.59.2.515. [DOI] [PubMed] [Google Scholar]
- Svartengren M, Anderson M, Philipson K, Camner P. Human lung deposition of particles suspended in air or in helium/oxygen mixtures. Experimental Lung Research. 1989;15:575–585. doi: 10.3109/01902148909069619. [DOI] [PubMed] [Google Scholar]
- van Ertbruggen C, Corieri P, Theunissen R, Riethmuller ML, Darquenne C. Validation of CFD predictions of flow in a 3D alveolated bend with experimental data. Journal of Biomechanics. 2008;41:399–405. doi: 10.1016/j.jbiomech.2007.08.013. [DOI] [PMC free article] [PubMed] [Google Scholar]
- Van Holsbeke CS, Verhulst SL, Vos WG, De Backer JW, Vinchurkar SC, Verdonck PR, van Doom JWD, Nadjmi N, De Backer WA. Change in upper airway geometry between upright and supine position during tidal nasal breathing. Journal of Aerosol Medicine and Pulmonary Drug Delivery. 2014;27:51–57. doi: 10.1089/jamp.2012.1010. [DOI] [PubMed] [Google Scholar]
- Vinchurkar S, De Backer L, Vos W, Van Holsbeke C, De Backer J, De Backer W. A case series on lung deposition analysis of inhaled medication using functional imaging based computational fluid dynamics in asthmatic patients: effect of upper airway morphology and comparison with in-vivo data. Inhalation Toxicology. 2012;24:81–88. doi: 10.3109/08958378.2011.644351. [DOI] [PubMed] [Google Scholar]
- Westenberger S, Gebhart J, Jaser S, Knoch M, Kîstler R. A novel device for the generation and recording of aerosol micro-pulses in lung diagnostic. Journal of Aerosol Science. 1992;23:S449–S452. [Google Scholar]