Abstract
The diagnosis, prognosis, and management of patients with gliomas are largely dictated by the pathological analysis of tissue biopsied from a selected region within the lesion. However, the heterogeneous and infiltrative nature of gliomas make it difficult to identify the optimal region for biopsy with conventional magnetic resonance imaging (MRI). This is particularly true for low-grade gliomas, which are often nonenhancing tumors. To improve the management of patients with such tumors, neuro-oncology requires an imaging modality that can specifically identify a tumor's most anaplastic/aggressive region(s) for biopsy targeting. The addition of metabolic mapping using spectroscopic MRI (sMRI) to supplement conventional MRI could improve biopsy targeting and, ultimately, diagnostic accuracy. Here, we describe a pipeline for the integration of state-of-the-art, high-resolution, whole-brain 3-dimensional sMRI maps into a stereotactic neuronavigation system for guiding biopsies in gliomas with nonenhancing components. We also outline a machine-learning method for automated histological analysis that generates normalized, quantitative metrics describing tumor infiltration in immunohistochemically stained tissue specimens. As a proof of concept, we describe the combination of these 2 techniques in a small cohort of patients with grade 3 glioma. With this work, we aim to present a systematic pipeline to stimulate histopathological image validation of advanced MRI techniques, such as sMRI.
Keywords: grade 3 glioma, spectroscopic MRI, quantitative histological image analysis, biopsy planning, image–histology correlation
Introduction
Gliomas are the most common primary brain tumors in adults, exhibiting considerable heterogeneity in terms of disease course and outcome (1). Currently, glioma treatment and prognosis rely on the histological analysis of tissue from the most malignant (highest grade) tumor region acquired during surgical resection or needle biopsy. Tissue enhancement observed on contrast-enhanced T1-weighted (CE-T1w) magnetic resonance imaging (MRI) (ie, breakdown of the blood–brain barrier) is in general regarded as an indication of a higher-grade tumor, and is the primary biopsy target in enhancing tumors. However, nonenhancing gliomas have been shown to be anaplastic (World Health Organization grade 3) in approximately one-third of cases (2).
In the absence of enhancement (85% of grade 2 and up to 40% of grade 3 gliomas), T2-weighted (T2w) and/or fluid-attenuated inversion recovery (FLAIR) imaging are/is used to guide tissue sampling (2, 3). However, T2w abnormalities are not tumor-specific and may represent non-neoplastic processes such as gliosis, inflammation, leukoaraiosis, and vasogenic edema. Even the combination of CE-T1w and T2w MRI sequences cannot reliably predict histological diagnosis of low- versus high-grade gliomas, having ∼50% false-positive rate (4). Moreover, considerable intratumoral heterogeneity in terms of histology, gene expression, and recurrence potential has been reported in nonenhancing gliomas, making the accurate identification of the most malignant region even more difficult (5–7). Unfortunately, the inability to identify the highest-grade region(s) of the tumor could lead to undergrading, ultimately resulting in misdiagnosis and undertreatment. Thus, in neuro-oncology, an imaging modality is required that can accurately describe the heterogeneous nature of nonenhancing tumors, and direct biopsy to a tumor's most malignant component(s).
Proton magnetic resonance spectroscopic imaging (MRSI) is a molecular imaging technique that maps the metabolism of endogenous small molecules to tumor regions in vivo, without the need for exogenously administered contrast media or tracers (8, 9). Using process-specific markers such as signaling molecules and metabolic products instead of surrogate markers of malignancy (e.g. contrast agent extravasation or the presence of free water), MR spectroscopic techniques can noninvasively probe biological pathways while remaining robust to other physiological phenomena such as edema or inflammation (10, 11). Various groups have shown that adding spectroscopy to conventional imaging benefits not only the identification of tumor but also the prediction of glioma grade (12–16). Moreover, as spectroscopic imaging-derived metabolic abnormalities have been shown to correlate with tumor cell density, it has been suggested that spectroscopy could improve biopsy target planning (16). However, the limited field-of-view, poor spatial resolution (∼1 cm3), and obscure spectral display of conventional spectroscopic methods make it difficult for integrating MRSI into biopsy guidance. This, as well as the limited analytical capabilities of vendor-provided MR spectroscopic processing programs, has severely impeded the widespread clinical use of MR spectroscopy.
To integrate spectroscopy into the surgical management of patients with gliomas, a high-resolution, whole-brain technique should be developed that reliably and automatically generates metabolite image volumes that are easily imported into neuronavigation systems. Thus, we have developed an imaging and processing pipeline using a state-of-the-art, high-resolution (0.1 cm3 nominal voxel size) spectroscopic imaging sequence and have automated analysis tools for allowing the addition of whole-brain metabolite (and metabolite ratio) maps to intraoperative neuronavigation (9). The process by which these transferable, normalized metabolite maps are generated has been termed spectroscopic MRI (sMRI). In addition, we have developed a whole-slide histological image analysis procedure for the automated and objective enumeration of glioma cells in tissue specimens having been processed with ordinary immunohistochemical (IHC) techniques. Using the combination of this new sMRI technique and automated histological analysis, we performed an sMRI-guided stereotactic biopsy in a small cohort of patients with grade 3 glioma and analyzed the tissue samples with our automated pipeline. Here, we describe a method for the seamless integration of high-resolution, whole-brain 3-dimensional (3D) sMRI into surgical neuronavigation that allows the targeting of unique metabolic regions, as well as an automated histology image analysis pipeline for the objective evaluation of IHC tissue data.
Methodology
Patients
On the basis of an internal review board-approved study, patients with lesions exhibiting nonenhancing lesions presumed to be either grade 2 or 3 glioma and for which biopsy was recommended underwent an sMRI study 1-7 days before surgery. Patients aged ≥18 years with a Karnofsky Performance Status of ≥70 and those both able and willing to sign a written informed consent document were included. Patients with MRI-incompatible implants or those who had received investigational agents were excluded. A total of 5 patients were enrolled between July 2014 and March 2016.
Imaging Protocol and Acquisition Parameters
A whole-brain sMRI sequence including 3D echo-planar spectroscopic imaging, generalized auto-calibrating partially parallel acquisitions, and elliptical k-space encoding was conducted (echo time [TE]/repetition time [TR]/flip angle [FA] = 17.6 ms/1551 ms/71°) on a 3 T MRI scanner with a 32-channel head coil array (Siemens Medical Solutions Inc., PA, USA) (9, 17, 18). The acquisition used a 50 × 50 × 32 k-space with 500 spectral sample points, covering a spatial region of 280 × 280 × 180 mm3. The sequence used chemical shift-selective water suppression, lipid inversion nulling with TI = 198 milliseconds, and an interleaved water reference acquisition obtained using a gradient-echo sequence (TE/TR/FA = 6.3 ms/1551 ms/20°). This single sMRI sequence has a scan time of ∼19 minutes. Before acquisition, first-order shims were manually optimized to ensure a water linewidth of ≤25 Hz, and saturation bands were placed over periorbital and subcutaneous lipid. Raw data were processed using the Metabolite Imaging and Data Analysis System (MIDAS) (9, 19), which included data reconstruction to 64 × 64 × 32 voxels with a nominal size of 4.5 × 4.5 × 5.6 mm (volume, ∼0.1 mL). Metabolite maps generated include the following: choline (Cho), a marker of phospholipid biosynthesis and cellular proliferation; creatine (Cr), a marker of intracellular energetics; myo-inositol (MI), a marker of cells with glial origins; and N-acetylaspartate (NAA), a marker of neuronal integrity (20). Clinically useful ratio maps including Cho/NAA, Cho/Cr, and NAA/Cr were also generated. T1w 3D magnetization-prepared rapid-acquisition gradient echo (1 mm3, TR/TE/FA = 2300 ms/3.4 ms/9°), T2w FLAIR (TR/TE/FA = 10 000 ms/121 ms/90°), and diffusion-weighted images (TR/TE/FA = 5400 ms/105 ms/90° and b = 0/1000) were also acquired.
Image Processing and Workflow
Data files exported from MIDAS are not compatible with most clinically-available imaging display and annotation software. Thus, each data file was converted to digital imaging communication of medicine (DICOM) format using a custom C++ program compiled from the Insight Segmentation and Registration Toolkit processing library (21). The sMRI DICOM files were then imported into VelocityAI (Varian Medical Systems, Inc., CA, USA), an FDA 510K-cleared image analysis suite for the analysis and annotation of multimodal medical images, for registration to the CE-T1w and T2w surgical planning MR images. The sMRI metabolic maps were up-sampled into the high-resolution biopsy planning MRI space using the native trilinear interpolation function in VelocityAI. Importantly, these up-sampled sMRI images are not used for any quantitative analyses; they only enable the import of metabolite volumes into the neuronavigation coordinate space. This set of spatially coherent maps was then imported into a fiducial-based, stereotactic neuronavigation system (Stealth Station, Medtronic, Dublin, Ireland), and the anatomy from water signal maps was visually compared with high-resolution anatomical imaging to verify coregistration accuracy. Once in the neuronavigation system, a fold-based thresholding method was applied to generate contours describing metabolite levels ranging from 2.0 to 10.0 times the mean intensity of normal-appearing white matter (NAWM). These contours were only used to describe metabolite levels during tissue sampling and were not used for image analysis or histological correlation.
Tissue Sampling and Immunohistochemical Preparation
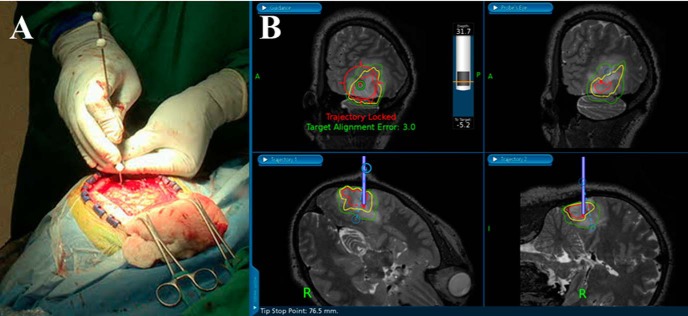
The frameless, stereotactic neuronavigation system uses instruments with reflective fiducials that can be tracked in space using an infrared camera mounted on the system tower. This arrangement allows for the presurgical planning of biopsy trajectories and the precise, real-time tracking of the biopsy needle in the MRI space. Using this system, biopsy trajectories passing through regions of T2w hyperintensity, Cho/NAA abnormality, and contrast enhancement (if presented) were planned. This path was then locked using a securing ring at the base of a skull-mounted trajectory guide to prevent deviation. After inserting the biopsy needle into the trajectory guide, tissue specimens along the biopsy trajectory (1-4 per patient) were sampled (Figure 1) and their locations in the MRI space were recorded. In this way 16 tissue specimens (6 from contrast-enhancing tissues) were sampled.
Figure 1.
Real-time tracking of a biopsy needle-cut window in image space using a neuronavigation station and needle with reflective fiducials (A). The surgeon can plan a trajectory that takes the biopsy needle into regions with metabolic abnormalities marked by color contours. The green, yellow, and red contours on the image represent regions where the Cho/NAA ratio is 2-, 5-, and 10-fold above values from contralateral normal-appearing white matter (NAWM) (B). The depth of the cutting window and its distance from the target can also be visualized in the top left panel of the neuronavigation display.
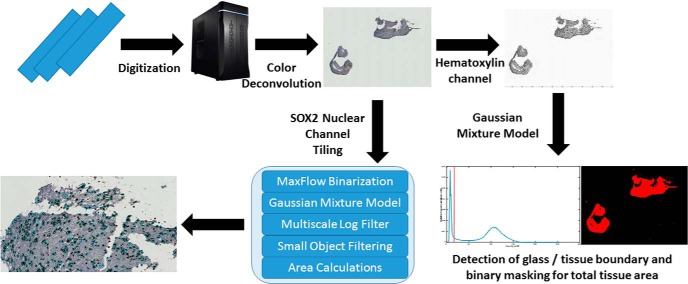
Tissue specimens were then paraffin-embedded and sectioned to a 5 μm thickness for staining with SOX2. SOX2 is a transcription factor known to maintain pluripotency in stem cells; however, IHC for SOX2 has been shown to exhibit remarkable specificity for infiltrating neoplastic cells in gliomas (22). IHC against SOX2 was performed using rabbit monoclonal antibody (diluted 1:500 with phosphate-buffered saline and ab92494; Abcam) according to the manufacturer's instructions (DAKO). Visualization was established using DAKO EnVision+ Dual (mouse and rabbit) Link System-HRP (K4061, DAKO) and DAB (K3467, DAKO), and slides were counterstained with hematoxylin to delineate nuclear boundaries. This staining procedure allows the deconvolution of hematoxylin and SOX2 signals in whole-slide images using a digital unmixing technique for the automated classification of SOX2-positive and -negative populations (Figure 2) (23). SOX2 density (mm2 SOX2/mm2 tissue), a quantitative metric of tumor infiltration in a tissue section, can then be calculated as the area of SOX2-positive nuclei over the area of total tissue on each slide. Samples from control patients (n = 23), individuals with treatment-refractory epilepsy who received temporal lobectomies, were stained and processed using the same protocol.
Figure 2.
Image analysis pipeline for SOX2 density calculation. Also described in the Supplementary Video.
Automated Histology Slide Analysis for Calculation of SOX2 Density
Tumor infiltration in terms of SOX2 density (ρSOX2) was computed using an automated, whole-slide image analysis pipeline (Figure 2). SOX2-stained sections were digitized at 40× magnification using Hamamatsu's High-Resolution Nanozoomer 2.0HT Whole-Slide Scanner. A custom MATLAB extension was written using the OpenSlide library (24) to import the digital slides into MATLAB r2016a (version 9.0, The MathWorks, Inc.). Each digital slide image was then separated into 4096- × 4096-pixel tiles for processing. A digital color deconvolution was applied to separate hematoxylin and SOX2 signals using a priori color matrices of the stains at their 1:500 dilutions. To calculate the SOX2 density, the total area of tissue in the slide and the total area of SOX2-positive nuclei were estimated. For tissue area calculations, a lower magnification (typically 5×) was used to reduce noise in the image and to decrease the processing time. In the hematoxylin image channel, an adaptive Gaussian mixture model was trained to classify pixels as either glass or tissue (nuclear or cytoplasmic, as the glass–cytoplasm boundary occurs at a much lower threshold than the cytoplasm–nucleus boundary). The initial model estimates were calculated based on simple peak detection in the pixel intensities of the hematoxylin channel (Figure 2 and Supplementary Video). Least squares optimization of the mixture model was performed using the lsqcurvefit method in the Optimization Toolbox of MATLAB. Once pixels were classified as either glass or tissue, the total area of pixels defined as tissue (Atissue) was calculated.
For the SOX2 area analysis, an adaptive Gaussian mixture model was trained to classify each high-resolution tile into glass, tissue, and nuclear regions using maximum likelihood optimization of the hematoxylin signal (25). After applying the classification model to the SOX2 channel, a graph-cutting approach was used to smooth nuclear segmentations, while a marker-based watershed method was used to separate clumped nuclei. Features extracted from the nuclei—including the minimum, mean, and maximum SOX2 stain intensity, as well as the area and the location of nuclear centroids—were used to train a random forest classifier to label each nuclei as either SOX2 positive or SOX2 negative. Next, the total number of pixels classified as SOX2-positive was calculated. The area of SOX2-positive tissue (ASOX2) and Atissue were calculated by multiplying the number of pixels classified as SOX2-positive or SOX2 tissue, respectively, by the pixel dimensions (0.5 × 0.5 μm). ρSOX2 was then computed using:
Where tiles represents all image tiles that contained SOX2-positive cells. Processing of the entire automated histology slide pipeline takes ∼20 minutes per high-resolution slide image on a Windows workstation with a 6-core processor clocked at 4.0 GHz and 32 GB RAM running MATLAB r2016a. The source code for the pipeline is version-controlled in a GitHub repository hosted by the Georgia Institute of Technology, and is available upon request.
sMRI Image Standardization
Metabolite levels can fluctuate with age, gender, and location, and abnormality standardization is an important processing step required for comparison of metabolite abnormalities across patients and tumors (9). Therefore, each set of coregistered metabolite volumes was imported into MATLAB for preprocessing and analysis directly from the MIDAS image database. Contralateral NAWM contours from white matter segmentation maps generated by MIDAS were exported from VelocityAI as DICOM-radiation therapy (RT) structures (26) and imported into MATLAB to estimate normal brain signal parameters. These parameters were used to generate standardized abnormality index (AImetab) maps (zero-mean and unit variance) using a Z-score function as follows:
Where Svoxelmetab is the metabolite signal at a given voxel, x̄NAWMmetab is the mean metabolite signal of contralateral NAWM, and σNAWMmetab is the standard deviation of the metabolite signal in contralateral NAWM. This process is similar as that described previously (27). The coregistered anatomical maps depicting the location of tissue extraction were sampled into the native sMRI space for correlation with metabolite intensities. To account for potential navigation error, mean signal values sampled from AImetab maps using an 8-mm isotropic region of interest (ROI) centered on the location of tissue extraction were used.
Results
sMRI Shows Metabolic Variation within Conventional Biopsy Targets
Coregistration of sMRI maps with conventional MRI enables the overlay of sMRI-detectable metabolites onto anatomical brain volumes, illustrating the metabolic heterogeneity within nonenhancing gliomas. A representative case of grade 3 anaplastic astrocytoma can be found in Figure 3. The signal-to-noise ratio for the sMRI sequence, calculated as the mean area under the NAA peak divided by the peak-to-peak noise, is 41.4 ± 5.1, resulting in highly sensitive, quantitative metabolite maps (Supplemental Figure 1). In addition, the tissue water signal is acquired in an interleaved fashion with the spectral data and serves as a source of anatomical features for affine image registration, as well as a denominator for the quantification of metabolite concentrations.
Figure 3.
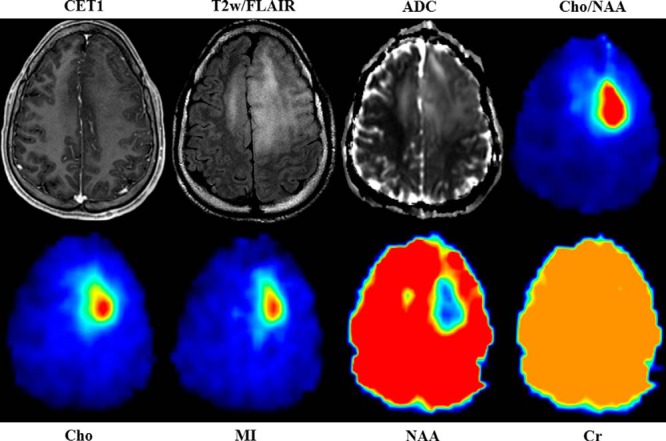
sMRI quantitatively maps the distribution of small molecules throughout the entire brain and describes regions of specific metabolic perturbations within T2w/FLAIR abnormalities. Changes in a number of metabolite maps Cho, NAA, Cr, and MI give insight into the metabolic heterogeneity of the tumor and surrounding tissue. Cho/NAA is the most sensitive spectroscopic marker used to identify regions of tumor infiltration. Internal water signal is used to normalize metabolite signal, allowing the generation of absolute metabolite concentrations. All images are given from the same axial slice in spatially coregistered images from patient 1.
For the case pictured in Figure 3, increases in Cho and MI along with concomitant decreases in NAA delineate a well-circumscribed region of metabolic abnormality within T2w/FLAIR hyperintensity, suggesting substantial glial proliferation. Moreover, a small region of NAA decrease along with streaks of elevated Cho and MI across the midline into regions of T2w/FLAIR abnormality potentially indicate the presence of interhemispherical infiltration. In contrast, Cr, a marker of cellular energetics that is generally depleted in regions of necrosis, remains unchanged within and around the tumor. The unique metabolic regions seen using whole-brain sMRI could represent new targets for tissue biopsy and may become meaningful ROIs for recurrence and survival prediction.
Integration of sMRI into Neuronavigation System
sMRI maps were integrated into the surgical neuronavigation station by fusion with standard anatomical MR images to allow real-time guidance of surgeons toward metabolically abnormal tissue (Figure 1). In VelocityAI, each sMRI map was up-sampled into the anatomical MRI space using trilinear interpolation for transfer to the neuronavigation system. Contours representing various degrees of metabolic abnormality (ranging from 1.5× to 10× normal) are generated to describe abnormality thresholds. These contours allow neurosurgeons to visualize hypermetabolic regions within nonenhancing T2w hyperintense tissues during aspiration without the obstruction of a metabolic heat map. Fusion of these images with the neuronavigation system's fiducial coordinate system allows the real-time guidance of surgical instruments to a metabolically abnormal target with exceptional accuracy.
Regions of Cho/NAA Associated with SOX2 Density
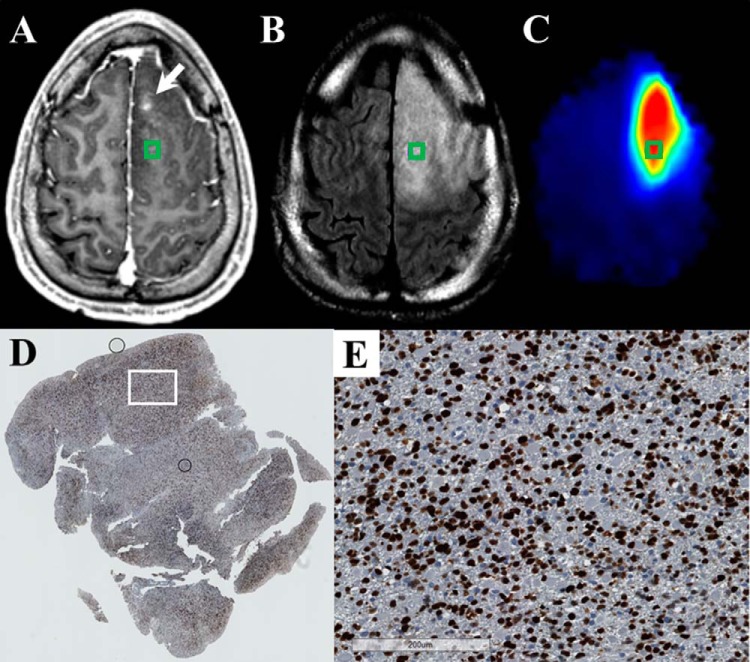
Each patient's tumor characteristics have been listed in Supplemental Table 1, and representative examples of image–histology pairs are shown in Figures 4–8. Figure 4A–C shows CE-T1w, T2w/FLAIR, and Cho/NAA images for a 30-year-old patient with a frontal anaplastic astrocytoma. Although only punctate contrast enhancement is visible near the falx cerebri (white arrow), homogenous T2w changes encompass the entire left frontal lobe. In Figure 4C, an anterior to posterior gradient in Cho/NAA within the T2w/FLAIR abnormality denotes regions of significant non-neuronal cell proliferation. This area not only describes a unique metabolic ROI in the large T2w/FLAIR abnormality but also suggests infiltration of tumor cells rostrocaudally. Biopsy at the posterior aspect of the metabolic abnormality gives tissues that show significant infiltration with SOX2-positive cells (SOX2 density of 0.026 mm2 SOX2/mm2 tissue) (Figure 4C–D). This SOX2 density falls well above that observed in tissues acquired from patients without glioma (SOX2 density of 0.002 ± 0.001 mm2 SOX2/mm2 tissue). A sample from a region with lower Cho/NAA changes ∼1 cm inferiorly along the biopsy trajectory showed a lower, yet still elevated, level of SOX2 density (0.014 mm2 SOX2/mm2 tissue).
Figure 4.
The Cho/NAA map identifies regions of elevated SOX2 expression in a T2w/FLAIR hyperintense region that is not contrast enhancing in a 30-year-old patient (patient 1 in Supplemental Table 1) with a new anaplastic astrocytoma (A–C). This map shows a subregion of the T2w/FLAIR abnormality that is hypermetabolic and includes a small contrast-enhancing lesion anteromedially (white arrow). A whole-slide scan of tissue (D) from the green box, along with a 17× view of that tissue from the white box (E), showed elevations in the SOX2 density (0.026 mm2 SOX2/mm2 tissue) and nuclear atypia (D). This patient has yet to exhibit recurrent disease.
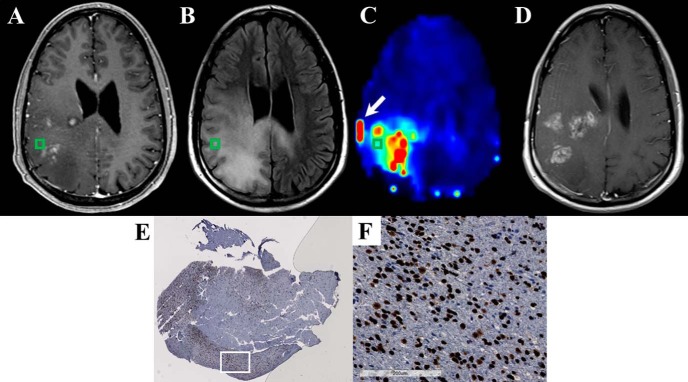
Figure 8.
The Cho/NAA map identifies regions of elevated SOX2 expression near regions of contrast enhancement in a 43-year-old patient (patient 5 in Supplemental Table 1) with recurrent anaplastic astrocytoma (A–C). Significant Cho/NAA abnormalities span the edematous region between contrast-enhancing foci before surgery. MRI at recurrence shows contrast enhancement growing toward the center of the foci, taking a shape similar to the abnormality in the prebiopsy Cho/NAA map (D). A whole-slide scan of tissue from the green box (E), along with a 17× view of that tissue at the white box (F), showed elevations in SOX2 density and nuclear atypia. Punctate, high-intensity voxels at the edge of the sMRI map are spectral artifacts resulting from tissue susceptibility changes. In this case, the artifact at the lateral aspect of the tumor (white arrow) where a metal plate secures a bone flap from a previous excisional biopsy is particularly prominent.
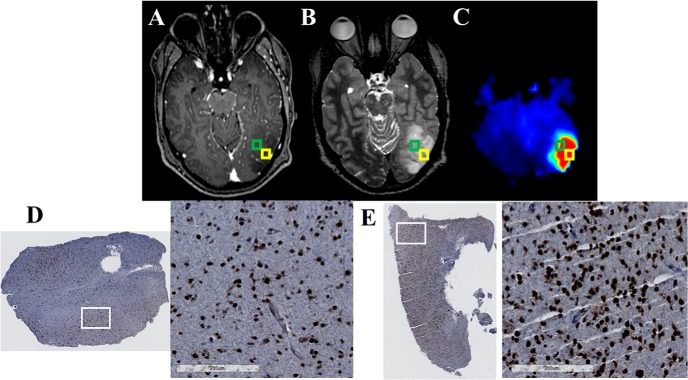
Figure 5A–C shows CE-T1w, T2w/FLAIR, and Cho/NAA images for a 34-year-old patient with a new occipital anaplastic astrocytoma. Unlike the previous case, no contrast-enhancing component is present within this tumor. Similar to the patient in Figure 4, however, this patient exhibits a striking hypermetabolic Cho/NAA abnormality in the lateral aspect of the T2w/FLAIR abnormality. This metabolic abnormality has fairly sharp edges with the exception of a low-gradient region anteriorly, which may represent an infiltrating margin. Biopsy of tissue near the edge of this metabolic abnormality (Figure 5A–C, green ROI) gave a tissue specimen with a substantially increased SOX2 density compared with normal control tissue (0.019 mm2 SOX2/mm2 tissue; Figure 5D). An additional specimen extracted from the center of the Cho/NAA abnormality ∼1 cm away (Figure 5A–C, yellow ROI) exhibited an even higher SOX2 density (0.042 mm2 SOX2/mm2 tissue; Figure 5E). Similar SOX2 density findings were present in patients 3, 4, and 5 as pictured in Figures 6, 7, and 8, respectively.
Figure 5.
The Cho/NAA map identifies regions of elevated SOX2 expression in a region of T2w hyperintensity in a 34-year-old patient (patient 2 in Supplemental Table 1) with a new anaplastic astrocytoma (A–C). The sMRI maps show that Cho/NAA is elevated in the posterior and lateral aspects of the T2w hyperintense region. However, no contrast enhancement is present. All tissue specimens sampled from Cho/NAA abnormalities in this patient exhibited elevations in SOX2 density and nuclear atypia. The tissue sampled from the region outlined with the green ROI exhibited a lower SOX2 density (0.019 mm2 SOX2/mm2 tissue, D) than the tissue sampled from an adjacent area (yellow ROI) with a higher Cho/NAA abnormality (0.042 mm2 SOX2/mm2 tissue, E). This patient has yet to exhibit recurrent disease.
Figure 6.
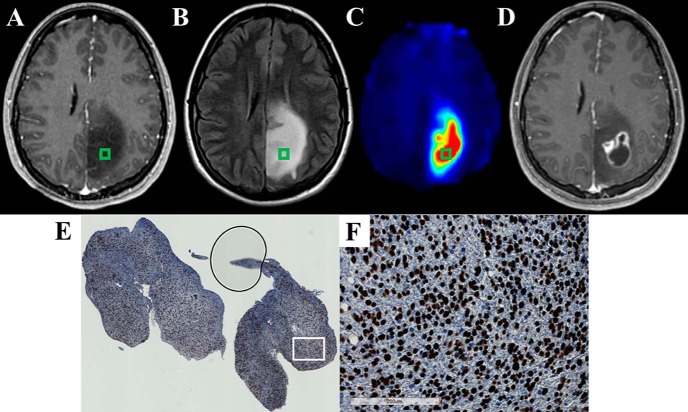
The Cho/NAA map identifies regions of elevated SOX2 expression in T2w/FLAIR hyperintense region that is not contrast enhancing in a 22-year-old patient (patient 3 in Supplemental Table 1) with anaplastic astrocytoma (A–C). The Cho/NAA map exhibits high contrast and shows a subregion of the T2w/FLAIR abnormality that is hypermetabolic. This abnormality approximates the location of contrast-enhancing recurrence before the start of radiation therapy (D). A whole-slide scan of tissue (E) from the green box, along with a 17× view of that tissue at the white box (F), showed elevations in the SOX2 density and nuclear atypia.
Figure 7.
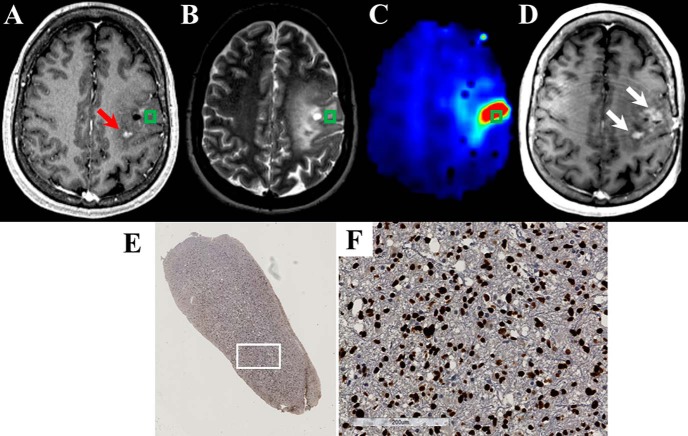
The Cho/NAA map identifies regions of elevated SOX2 expression in a region with patchy enhancement in a 45-year-old patient (patient 4 in Supplemental Table 1) with recurrent anaplastic astrocytoma (A–C). The Cho/NAA map shows a significant abnormality near the contrast enhancement at the site of tissue sampling. There is also a trail of high Cho/NAA from the sample location to another enhancing lesion posteriorly (red arrow). These Cho/NAA abnormalities encompass regions of contrast enhancement at recurrence (white arrows) (D). A whole-slide scan of tissue (E) from the green box, along with a 17× view of that tissue at the white box (F), showed elevations in SOX2 density and nuclear atypia.
Cho/NAA Associated with Location of Recurrence
The 3 patients who exhibited tumor recurrence in the follow-up period showed contrast enhancement in regions that exhibited Cho/NAA abnormalities before biopsy. Examples of this can be found in Figures 6, 7, and 8. In patient 3, Cho/NAA elevation at the posterior aspect of the tumor resection cavity predates the appearance of an enhancing lesion in that region by ∼1 month (Figure 6D). Recurrence occurred before the beginning of RT, and the lesion continued to grow throughout the treatment, confirming true progression. Similarly, in a patient with recurrent anaplastic astrocytoma, the Cho/NAA abnormality courses through a region of patchy enhancement to a solitary enhancing nodule posteriorly. The region with the higher metabolic abnormality showed a greater increase in contrast-enhancing tissue (white arrows) than the posterior lesion (Figure 7D). In another patient with recurrent anaplastic astrocytoma, a large Cho/NAA abnormality spans 3 contrast-enhancing foci in the parietal lobe (Figure 8). A tissue sample from a mildly abnormal region (green box) produced tissue with significant elevations in SOX2 density (0.045 mm2 SOX2/mm2 tissue). On the date recurrence was identified, contrast-enhancing tissue was present in the Cho/NAA abnormality between the original enhancing foci (Figure 8D).
Discussion
Gliomas are devastating tumors, for which histopathology is currently the gold standard for diagnosis, and tumor grade is the foundation upon which prognosis and treatment are based (28). The accuracy of the prognosis and the effectiveness of treatment assume that the biopsied tissue comes from a region that reflects the most anaplastic portion of the tumor. However, the infiltrative and heterogeneous nature of gliomas makes the identification of these critical regions difficult, particularly in nonenhancing tumors. Many lower-grade gliomas do not exhibit the contrast enhancement that is usually targeted (when present) in higher-grade gliomas. Furthermore, lower-grade tumors often show substantial T2 prolongation, resulting in significant areas of nonspecific T2w signal abnormality (29–31). Although neuronavigation systems allow neurosurgeons to view the lesion in MR image space intraoperatively, standard imaging sequences provide insufficient information on the malignancy of nonenhancing tumors, thus offering limited guidance in biopsy target planning. However, as tissue metabolism is neither limited by exogenous contrast leakage and diffusion (unlike CE-T1w imaging) nor obscured by the presence of edema (unlike T2w or FLAIR imaging), sMRI techniques may offer a reliable alternative to conventional methods for identifying regions of significant anaplasia (10, 11).
Previous spectroscopy–histology correlation studies have had compelling results; however, the low spatial resolution and limited field-of-view of conventional spectroscopic sequences have limited the clinical translation of these techniques (12–16). To overcome these limitations and streamline clinical implementation, an acquisition and processing pipeline using a state-of-the-art sMRI pulse sequence and sophisticated automated analysis tools was developed for the generation of high-resolution, whole-brain 3D sMRI images that are easily imported into intraoperative neuronavigation systems. With this pipeline, high-resolution sMRI maps describing metabolic changes within the tumor and the surrounding tissue can be easily used for biopsy guidance. Moreover, to overcome the bias associated with manual and semiquantitative histological interpretation, we developed a quantitative image analysis technique for the objective and automated evaluation of microscopic tumor infiltration. Combining these 2 techniques, we show the feasibility of standardized metabolite indexing (AImetab) for comparing metabolic abnormalities across patients and for identifying important regions for biopsy targeting. Using this method, we also describe a Cho/NAA-SOX2 association in 5 cases of grade 3 glioma, suggesting that sMRI may identify normal brain regions that are infiltrated by glioma. The presence of contrast-enhancing tumor at recurrence in regions of Cho/NAA abnormality before biopsy further supports this claim, and suggests that these regions should be considered during target planning for new and recurrent grade 3 glioma. These findings are similar to those recently described in glioblastomas, suggesting that sMRI may have utility in the visualization of infiltration in high-grade astrocytomas (32).
The targeting technique described in this work also has the potential to improve RT targeting in gliomas. As sMRI identifies regions of tumor that may not be seen with conventional MR imaging, the addition of sMRI to RT dosage planning could result in a new, clinically important RT target. In nonenhancing tumors, regions of significant metabolic abnormality, as described by sMRI, could be targeted for RT treatment boosting much like regions of contrast enhancement in patients with glioblastomas (WHO grade 4 glioma) (33). Most importantly, the addition of sMRI to surgical and RT management of nonenhancing gliomas would represent a paradigm shift in the field of image-guided therapy away from targeting surrogate markers using contrast tracer-based imaging techniques.
Similarly, the histological analysis pipeline could be generalized to analyze any number of IHC markers. This pipeline uses the significant contrast of immunostained markers and hematoxylin to derive quantitative imaging features that are used to automatically classify cells using machine-learning techniques. As such, any nuclear or cytoplasmic marker that can be probed with IHC could potentially be evaluated objectively using this method. For example, Popova et al (34) used an array of monoclonal antibodies targeted toward a number of known oncogenic markers, including isocitrate dehydrogenase, Ki67, TP53, and epidermal growth factor receptor, to subtype gliomas of varying grades using IHC (34). Using a semiquantitative scoring system, they showed that IHC-determined protein expression in glioblastomas could be used to subdivide tumors into classical, mesenchymal, and proneural molecular subtypes. The automated histology image analysis method described in this work could enable a more objective and quantitative measure of IHC staining than the scoring system used by Popova et al (34). Moreover, as this process outputs not only the absolute number of positively and negatively stained cells but also the area of each cell type and tissue section as a whole, quantitative measures describing cell density, percentage, and areas can be extracted. The incorporation of these measures may yield more interesting relationships with tumor type than the subjective ordinal scoring system generally used in these studies.
Before the pipeline described herein can be deployed for target delineation, there are limitations that must be overcome. First, additional patients are required to evaluate correlations between sMRI markers and histology and to determine the optimal metabolic threshold for targeting glioma infiltration. Such an analysis was not possible in this study because of the limited sample size. In addition, some spectral artifacts appear in the final volumes delivered to clinicians for tumor targeting (Figure 8C, white arrow). To prevent this in the future, we are developing an automated spectral filter using machine-learning techniques to identify spectral artifacts using waveforms present within the chemical shift spectra. Last, to minimize error from manual thresholding of metabolite volumes in the neuronavigation software, a processing module is currently being developed to automatically normalize sMRI volumes and produce segmentations at increasing thresholds of metabolic abnormality. This module will eventually be integrated into the MIDAS software suite and thus be part of our sMRI processing pipeline.
Conclusions
High-resolution, whole-brain 3D sMRI is clinically feasible and can prove to be an excellent method for obtaining the complementary metabolic information necessary for targeting the most malignant regions in nonenhancing gliomas. In this work, we describe a seamless method for the integration of sMRI into stereotactic biopsy with real-time neuronavigation and an objective, machine learning-based method of IHC analysis for image–histology correlation studies. We also set forth histological and recurrence data suggesting that an sMRI marker, Cho/NAA, may useful in identifying normal brain regions infiltrated by gliomas. The addition of sMRI to the surgical management of nonenhancing gliomas would represent a paradigm shift in the field of image-guided therapy away from targeting surrogate markers using exogenous contrast tracer-based imaging techniques (eg, CE-T1w MRI or PET) to targeting abnormal tissue regions by measuring endogenous biological processes.
Supplemental Materials
Acknowledgments
This work was supported by the National Institute of Health grant U01CA172027 (HKS/JJO/HS) and a predoctoral fellowship F31CA180319 (JSC). The spectroscopic sequence and MIDAS were provided by Andrew Maudsley at the University of Miami, and his group has been crucial to pipeline optimization.
Disclosure: None reported.
Conflict of Interest: None reported.
Footnotes
- MRI
- Magnetic resonance imaging
- sMRI
- spectroscopic MRI
- CE-T1w
- contrast-enhanced T1-weighted imaging
- WHO
- World Health Organization
- T2w
- T2-weighted
- FLAIR
- fluid-attenuated inversion recovery
- sMRI
- spectroscopic magnetic resonance imaging
- IHC
- immunohistochemical
- 3D
- 3-dimensional
- MIDAS
- metabolite imaging and data analysis system
- Cho
- choline
- NAA
- N-acetylaspartate
- Cr
- creatine
- MI
- myo-inositol
- AImetab
- abnormality index maps
- ROI
- region-of-interest
- NAWM
- normal-appearing white matter
- IHC
- immunohistochemistry
- DICOM
- digital imaging communication of medicine
- TE
- echo time
- TR
- repetition time
- FA
- flip angle
References
- 1. Ostrom QT, Gittleman H, Fulop J, Liu M, Blanda R, Kromer C, Wolinsky Y, Kruchko C, Barnholtz-Sloan JS. CBTRUS statistical report: Primary brain and central nervous system tumors diagnosed in the United States in 2008–2012. Neuro Oncol. 2015;17:iv1–iv62. [DOI] [PMC free article] [PubMed] [Google Scholar]
- 2. Scott JN, Brasher PM, Sevick RJ, Rewcastle NB, Forsyth PA. How often are nonenhancing supratentorial gliomas malignant? A population study. Neurology. 2002;59(6):947–949. [DOI] [PubMed] [Google Scholar]
- 3. Holder C, Poisson L, Cooper L, Huang E, Chen J, Hwang S, Mukherjee S, Wolansky L, Griffith B, Yeom K, Iv M, Wintermark M, Kirby J, Freymann J, Rubin D, Jaffe C, Brat D, Flanders A, editors. Radiogenomic analysis of TCGA/TCIA diffuse lower grade gliomas by molecular subtype. Radiological Society of North America Annual Meeting; 2015 November 29 - December 4, 2015; Chicago, IL. [Google Scholar]
- 4. Kondziolka D, Lunsford LD, Martinez AJ. Unreliability of contemporary neurodiagnostic imaging in evaluating suspected adult supratentorial (low-grade) astrocytoma. J Neurosurg. 1993;79(4):533–536. [DOI] [PubMed] [Google Scholar]
- 5. Henson JW, Gaviani P, Gonzalez RG. MRI in treatment of adult gliomas. Lancet Oncol. 2005;6(3):167–175. [DOI] [PubMed] [Google Scholar]
- 6. Jacobs AH, Kracht LW, Gossmann A, Ruger MA, Thomas AV, Thiel A, Herholz K. Imaging in neurooncology. NeuroRx. 2005;2(2):333–347. [DOI] [PMC free article] [PubMed] [Google Scholar]
- 7. Barajas RF Jr., Phillips JJ, Parvataneni R, Molinaro A, Essock-Burns E, Bourne G, Parsa AT, Aghi MK, McDermott MW, Berger MS, Cha S, Chang SM, Nelson SJ. Regional variation in histopathologic features of tumor specimens from treatment-naive glioblastoma correlates with anatomic and physiologic MR Imaging. Neuro Oncol. 2012;14(7):942–954. [DOI] [PMC free article] [PubMed] [Google Scholar]
- 8. Law M. MR spectroscopy of brain tumors. Top Magn Reson Imaging. 2004;15(5):291–313. [DOI] [PubMed] [Google Scholar]
- 9. Maudsley AA, Domenig C, Govind V, Darkazanli A, Studholme C, Arheart K, Bloomer C. Mapping of brain metabolite distributions by volumetric proton MR spectroscopic imaging (MRSI). Magn Reson Med. 2009;61(3):548–559. [DOI] [PMC free article] [PubMed] [Google Scholar]
- 10. Di Costanzo A, Scarabino T, Trojsi F, Giannatempo GM, Popolizio T, Catapano D, Bonavita S, Maggialetti N, Tosetti M, Salvolini U, d'Angelo VA, Tedeschi G. Multiparametric 3T MR approach to the assessment of cerebral gliomas: tumor extent and malignancy. Neuroradiology. 2006;48(9):622–631. [DOI] [PubMed] [Google Scholar]
- 11. Di Costanzo A, Scarabino T, Trojsi F, Popolizio T, Catapano D, Giannatempo GM, Bonavita S, Portaluri M, Tosetti M, d'Angelo VA, Salvolini U, Tedeschi G. Proton MR spectroscopy of cerebral gliomas at 3 T: spatial heterogeneity, and tumour grade and extent. Eur Radiol. 2008;18(8):1727–1735. [DOI] [PubMed] [Google Scholar]
- 12. Matsumura A, Isobe T, Anno I, Takano S, Kawamura H. Correlation between choline and MIB-1 index in human gliomas. A quantitative in proton MR spectroscopy study. J Clin Neurosci. 2005;12(4):416–420. [DOI] [PubMed] [Google Scholar]
- 13. Nafe R, Herminghaus S, Raab P, Wagner S, Pilatus U, Schneider B, Schlote W, Zanella F, Lanfermann H. Preoperative proton-MR spectroscopy of gliomas–correlation with quantitative nuclear morphology in surgical specimen. J Neurooncol. 2003;63(3):233–245. [DOI] [PubMed] [Google Scholar]
- 14. Croteau D, Scarpace L, Hearshen D, Gutierrez J, Fisher JL, Rock JP, Mikkelsen T. Correlation between magnetic resonance spectroscopy imaging and image-guided biopsies: semiquantitative and qualitative histopathological analyses of patients with untreated glioma. Neurosurgery. 2001;49(4):823–829. [DOI] [PubMed] [Google Scholar]
- 15. Stadlbauer A, Nimsky C, Buslei R, Pinker K, Gruber S, Hammen T, Buchfelder M, Ganslandt O. Proton magnetic resonance spectroscopic imaging in the border zone of gliomas: correlation of metabolic and histological changes at low tumor infiltration–initial results. Invest Radiol. 2007;42(4):218–223. [DOI] [PubMed] [Google Scholar]
- 16. Stadlbauer A, Buchfelder M, Doelken MT, Hammen T, Ganslandt O. Magnetic resonance spectroscopic imaging for visualization of the infiltration zone of glioma. Cent Eur Neurosurg. 2011;72(2):63–69. [DOI] [PubMed] [Google Scholar]
- 17. Banerjee S, Ozturk-Isik E, Nelson SJ, Majumdar S. Elliptical magnetic resonance spectroscopic imaging with GRAPPA for imaging brain tumors at 3 T. Magn Reson Imaging. 2009;27(10):1319–1325. [DOI] [PubMed] [Google Scholar]
- 18. Maudsley A, Domenig C. Signal normalization for MR spectroscopic imaging using an interleaved water-reference. Magn Reson Med, Toronto: 2008. [Google Scholar]
- 19. Maudsley AA, Darkazanli A, Alger JR, Hall LO, Schuff N, Studholme C, Yu Y, Ebel A, Frew A, Goldgof D, Gu Y, Pagare R, Rousseau F, Sivasankaran K, Soher BJ, Weber P, Young K, Zhu X. Comprehensive processing, display and analysis for in vivo MR spectroscopic imaging. NMR Biomed. 2006;19(4):492–503. [DOI] [PMC free article] [PubMed] [Google Scholar]
- 20. Barker PB, Lin DDM. In vivo proton MR spectroscopy of the human brain. Prog Nucl Magn Reson Spectrosc. 2006;49(2):99–128. [Google Scholar]
- 21. Yoo TS, Ackerman MJ, Lorensen WE, Schroeder W, Chalana V, Aylward S, Metaxas D, Whitaker R. Engineering and algorithm design for an image processing API: A technical report on ITK–the Insight Toolkit. Stud Health Technol Inform. 2002;85:586–592. [PubMed] [Google Scholar]
- 22. de la Rocha AM, Sampron N, Alonso MM, Matheu A. Role of SOX family of transcription factors in central nervous system tumors. Am J Cancer Res. 2014;4(4):312–324. [PMC free article] [PubMed] [Google Scholar]
- 23. Ruifrok AC, Johnston DA. Quantification of histochemical staining by color deconvolution. Anal Quant Cytol Histol. 2001;23(4):291–299. [PubMed] [Google Scholar]
- 24. Goode A, Gilbert B, Harkes J, Jukic D, Satyanarayanan M. OpenSlide: A vendor-neutral software foundation for digital pathology. J Pathol Inform. 2013;4:27. [DOI] [PMC free article] [PubMed] [Google Scholar]
- 25. Cooper LA, Kong J, Gutman DA, Dunn WD, Nalisnik M, Brat DJ. Novel genotype-phenotype associations in human cancers enabled by advanced molecular platforms and computational analysis of whole slide images. Lab Invest. 2015;95(4):366–376. [DOI] [PMC free article] [PubMed] [Google Scholar]
- 26. Law MYY, Liu B. DICOM-RT and its utilization in radiation therapy. Radiographics. 2009;29(3):655–667. [DOI] [PubMed] [Google Scholar]
- 27. McKnight TR, Noworolski SM, Vigneron DB, Nelson SJ. An automated technique for the quantitative assessment of 3D-MRSI data from patients with glioma. J Magn Reson Imaging. 2001;13(2):167–177. [DOI] [PubMed] [Google Scholar]
- 28. Brandner S, von Deimling A. Diagnostic, prognostic and predictive relevance of molecular markers in gliomas. Neuropathol Appl Neurobiol. 2015;41(6):694–720. [DOI] [PubMed] [Google Scholar]
- 29. Cha S. Update on brain tumor imaging: from anatomy to physiology. AJNR Am J Neuroradiol. 2006;27(3):475–487. [PMC free article] [PubMed] [Google Scholar]
- 30. Young GS. Advanced MRI of adult brain tumors. Neurol Clin. 2007;25(4):947–973. [DOI] [PubMed] [Google Scholar]
- 31. Pope WB, Young JR, Ellingson BM. Advances in MRI assessment of gliomas and response to anti-VEGF therapy. Curr Neurol Neurosci Rep. 2011;11(3):336–344. [DOI] [PMC free article] [PubMed] [Google Scholar]
- 32. Cordova JS, Shu HG, Liang Z, Gurbani SS, Cooper LA, Holder CA, Olson JJ, Kairdolf B, Schreibmann E, Neill SG, Hadjipanayis CG, Shim H. Whole-brain spectroscopic MRI biomarkers identify infiltrating margins in glioblastoma patients. Neuro Oncol. 2016;pii:now036. [Epub ahead of print]. [DOI] [PMC free article] [PubMed] [Google Scholar]
- 33. Weller M, van den Bent M, Hopkins K, Tonn JC, Stupp R, Falini A, Cohen-Jonathan-Moyal E, Frappaz D, Henriksson R, Balana C, Chinot O, Ram Z, Reifenberger G, Soffietti R, Wick W, European Association for Neuro-Oncology (EANO) Task Force on Malignant Glioma. EANO guideline for the diagnosis and treatment of anaplastic gliomas and glioblastoma. Lancet Oncol. 2014;15(9):e395–e403. [DOI] [PubMed] [Google Scholar]
- 34. Popova SN, Bergqvist M, Dimberg A, Edqvist PH, Ekman S, Hesselager G, Ponten F, Smits A, Sooman L, Alafuzoff I. Subtyping of gliomas of various WHO grades by the application of immunohistochemistry. Histopathology. 2014;64(3):365–379. [DOI] [PMC free article] [PubMed] [Google Scholar]
Associated Data
This section collects any data citations, data availability statements, or supplementary materials included in this article.


