Abstract
p49/STRAP (SRFBP1) is a transcriptional regulator that has been implicated in cardiac aging. p49/STRAP has a SRF binding domain and a BUD22 domain (which modulates cellular growth rate and cell size). We have observed that p49/STRAP alters the intracellular NAD/NADH ratio and induces protein deacetylation. Here we report that p49/STRAP overexpression caused the deacetylation of histone H4 on lysine 16 (H4K16) and suppressed the expression of PGC-1α as well as mitofusin-1 and mitofusin-2 at both the mRNA and protein levels. P49/STRAP also reduced mitochondrial size, mitochondrial membrane potential and the mitochondrial oxygen consumption rate. We noted that P49/STRAP expression was increased in the old versus young adult mouse hearts and also increased with advancing population doubling levels in cultured human umbilical vein endothelial cells (HUVECs). It is therefore very plausible that increased expression of p49/STRAP in late life may alter the status of histone acetylation and impact mitochondrial dynamics and thereby reduce mitochondrial function and cardiac performance during mammalian senescence.
Keywords: Histone acetylation, PGC-1α, Mitofusins, mitochondrial oxygen consumption
1. Introduction
Adult aging is a complex biological process that is associated with a progressive decline in the physiological and biochemical performance of individuals, including their tissues and organs, leading to increased susceptibility to age-related disease and to functional senescence (Bak et al., 1998; Ballard and Edelberg, 2008; Vijg and Wei, 1995; Wei, 1992). Impaired mitochondrial function, altered transcriptional regulation and changes in gene and protein expression are among the major factors that contribute to cellular senescence and adult aging (Khrapko et al., 1999; Nekhaeva et al., 2002; Odiet and Wei, 1996; Sun et al., 2016). Mitochondria are mobile intracellular organelles that exist in dynamic networks. They continuously join by the process of fusion and divide by the process of fission; these processes allow them to adjust their size, shape and network in response to various cellular signals and environmental stresses (Westermann, 2010; Youle and van der Bliek, 2012). Mitochondrial dynamics are regulated during embryonic development, maturation and adult aging. Altering mitochondrial dynamics can reduce mitochondrial function and even accelerate cellular senescence (Campello and Scorrano, 2010; Detmer and Chan, 2007; Mai et al., 2010; Seo et al., 2010). In mammalian cells, dynamin 1-like (DNM1L or DRP1) and fission 1 (FIS1) are involved in the fission process, while mitofusin-1 & mitofusin-2 (MFN1 and MFN2) and optic atrophy 1(OPA1) are reported to participate in the fusion process (Cipolat et al., 2004; Song et al., 2015). These nuclear-encoded mitochondrial proteins have major roles in the regulation of mitochondrial dynamics (Dietrich et al., 2013; Ranieri et al., 2013). The mitofusin proteins MFN1 and MFN2 are regulated by peroxisome proliferator-activated receptor gamma coactivator 1-alpha (PGC-1α), which is in turn regulated by histone 4 at lysine site 16 (H4K16), known to control chromatin structure and function (Dion et al., 2005; Millar et al., 2004).
We have observed that p49/STRAP interacts with NDUFAB1, a subunit of mitochondrial complex I, and reduces the NAD/NADH ratio; p49/STRAP was also observed to induce the deacetylation of SRF protein (Zhang et al., 2008). In the present study, we sought to test the hypothesis that p49/STRAP influences mitochondrial function. We found that p49/STRAP overexpression induced the deacetylation of histone H4 and suppressed the expression levels of PGC-1α as well as MFN1 and MFN2 at both the mRNA and protein levels. P49/STRAP also reduced mitochondrial size and the mitochondrial oxygen consumption rate. We noted that P49/STRAP expression was increased in old versus young adult mouse hearts. In addition, p49/STRAP was also increased with advancing population doubling levels in cultured human umbilical vein endothelial cells (HUVECs). The levels of PGC-1a and MFN1 and MFN2 were reduced with p49 overexpression and increased with p49 inhibition. It is therefore very plausible that increased expression of p49/STRAP in late life may alter the status of histone acetylation, inhibit PGC-1α expression and impact mitochondrial dynamics and thereby reduce mitochondrial function and cardiac performance during mammalian aging and senescence.
2. Materials and methods
2.1 Tissue culture
The DMEM media containing 10% newborn bovine serum (Invitrogen) with three different glucose concentrations were used in the present study, the normal glucose (5.5 mM) medium, the high glucose (25 mM) medium, and the low glucose (1.6 mM) medium.
Human umbilical vein endothelial cells (HUVECs) were obtained from Lonza (Clonetics, Walkersville, MD) as pooled primary cell lines and cultured as previously described (Rogers et al., 2013).
Because the HUVECs were more vulnerable, did not grow well in the 96-well XF96 assay plate, and did not survive the glucose stress flux tests or the recombinant adenovirus treatments, we chose to employ the more robust C2C12, myogenic cell line for the subsequent studies.
The muscle cell line C2C12 cells (ATCC CRL-1772) were cultured in six-well plates to 80% confluence in normal glucose medium, after which the cells either remained in normal glucose medium (control) or were subjected to high or low glucose treatment, respectively. The cells were then harvested and the total RNA was isolated using miRNeasy Mini Kit (Qiagen) and RNase free DNase I according to the manufacture’s instruction manual. Individual experiments were carried out in triplicate, and the results were reported as averages (mean ± SD) from representative experiments.
2.2 Plasmid DNA Transfection and Recombinant adenovirus infection
The p49/STRAP recombinant adenovirus was generated using the AdEasy system (a generous gift from Dr. Vogelstein, Johns Hopkins Oncology Center, MD) as was previously reported (Zhang et al., 2008). Cells were grown in 6-well plates and infected with control adenovirus and recombinant p49/STRAP adenovirus for 24 h. Adenovirus treatment groups were performed in triplicate. After fixation, the cells were viewed using a 20× PLAN Fluor 0.5 objective (Nikon, Inc.) at room temperature, and the images were captured and analyzed. Post-treatment cell size was determined using the measurement module in NIS Elements AR software (Nikon, Inc.).
2.3 Immunocytofluorescence
Cells were equally seeded onto six-well plates and grown in DMEM supplemented with 10% FBS at 37°C and 5% CO2 for 24 h. Upon attachment and ~80% confluence, Cells were transfected with control adenovirus and recombinant p49/STRAP adenovirus for 24 h. The cells were then fixed in 3.7% formaldehyde for 10 min at room temperature. The fixative was removed by washing with PBS and cells were permeabilized in 0.2% Triton X-100 for 5 min. Cells were washed with PBS blocked with 3% BSA for 1h at room temperature. Samples were then incubated with primary rabbit p49/STRAP antibody (1:200) for 2 h at room temperature. Fluorescent secondary antibody signal was developed using Alexa Fluor 488 goat anti-rabbit (1:500) for 1 h at room temperature. F-actin was stained using rhodamine-phalloidin (1:200) for 20 min Samples were then counterstained for 5 min with DAPI (1:1000) to label the nuclei. Mitochondrial membrane potential was measured by using MitoTracker (Invitrogen). Images were examined with a 40× PLAN Fluor 1.3 objective (Nikon, Inc.) at room temperature using an Eclipse TI inverted fluorescence microscope (Nikon, Inc.) and captured and analyzed with Photometrics CoolSNAP HQ2 and NIS Elements AR software (v. 4.10.01 Nikon, Inc.). Images were exported as TIFF files.
2.4 Measurement of mitochondrial oxygen consumption
C2C12 cells were seeded at 15,000 cells per well in XF 96 Well plates (Seahorse Bioscience, Billerica, MA) (Rogers et al., 2013).
The cells were treated with either GFP-control virus or p49/STRAP-GFP virus for 24 hours, and then cells were cultured in normal/physiological level of glucose (5.5 mM), or high glucose (25 mM), or low glucose (1.6 mM) medium, respectively. After glucose stress, the cells were subjected to extracellular flux analysis, using the Mito Stress kit and Glycolytic Stress kit, respectively (Seahorse Biosciences Billerica, MA). Rotenone, oligomycin, antimycin A and FCCP were prepared in filtered ultrapure DMSO (Sigma Chemical Co., St. Louis, MO) at 2.5 mM. The XF Assay media (Seahorse Biosciences) was adjusted to pH = 7.4 using NaOH. Oligomycin, FCCP (carbonyl cyanide p-trifluoromethoxyphenylhydrazone), glucose and 2-D-glucose (2-DG) were prepared according to manufacturer's instructions that were supplied in the XF glycolysis test kit (Williams et al., 2015).
2.5 Mouse tissues
C57BL/6 mouse hearts were obtained from Rodent and Tissue Bank from National Institute of Aging (NIA). Three pairs of young (4-month old) and old (24-month old) adult mice were used for comparison in gene expression.
2.6 Quantitative RT-PCR
All RNA samples were first isolated from either cultured cells or the mouse cardiac ventricles using UltraSpec RNA Isolation Reagent as previously described (Zhang et al., 2004). To minimize the genomic DNA contamination, the RNA samples were purified using miRNeasy Mini Kit (Qiagen) and RNase-free DNase I digestion according to the manufacture’s instruction manual. To quantitate the expression of the mRNA, Real-time RT-PCR was performed. To select a proper internal loading control for RT-PCR, we examined the expression of 5S ribosomal RNA (5S RNA) and U6 snRNA in young adult versus old mouse hearts, we found that the expression of 5S RNA remained unchanged in young adult versus old hearts, while U6 snRNA expression changed significantly in young adult versus old hearts. Therefore, 5S RNA was used as an internal loading control.
2.7 Immunoprecipitation and Western blotting
The expression plasmid constructs containing p49/STRAP and empty vector were transfected into C2C12 cells using Lipofectamine 2000 (Invitrogen) as previously described (Zhang et al., 2004). At 24 h after the transfection, cells were harvested, and the whole-cell lysate was isolated. The immunoprecipitation and Western blotting were carried out as previously described (Zhang et al., 2004). Antibodies that were employed included p49/STRAP antibody (Zhang et al., 2004), Histone H4 (Millipore), anti-acetyl-Histone H4 (Lys16) (Millipore), MFN1 and MFN2 (Santa Cruz Biotechnology) antibodies. Secondary antibodies are from LI-COR Inc. The Western bots were imaged and the bands were analyzed using Odyssey Imaging Systems (LI-COR Inc.).
2.8 Statistical Analysis
Data are given as mean values ± SD, with n denoting the number of experiments unless otherwise indicated. The differentially expressed miRNAs with at least a 1.5-fold change were identified using a t-test with a cut-off P value of P < 0.05.
3. Results
3.1. The expression of p49/STRAP was increased during adult aging and cellular senescence
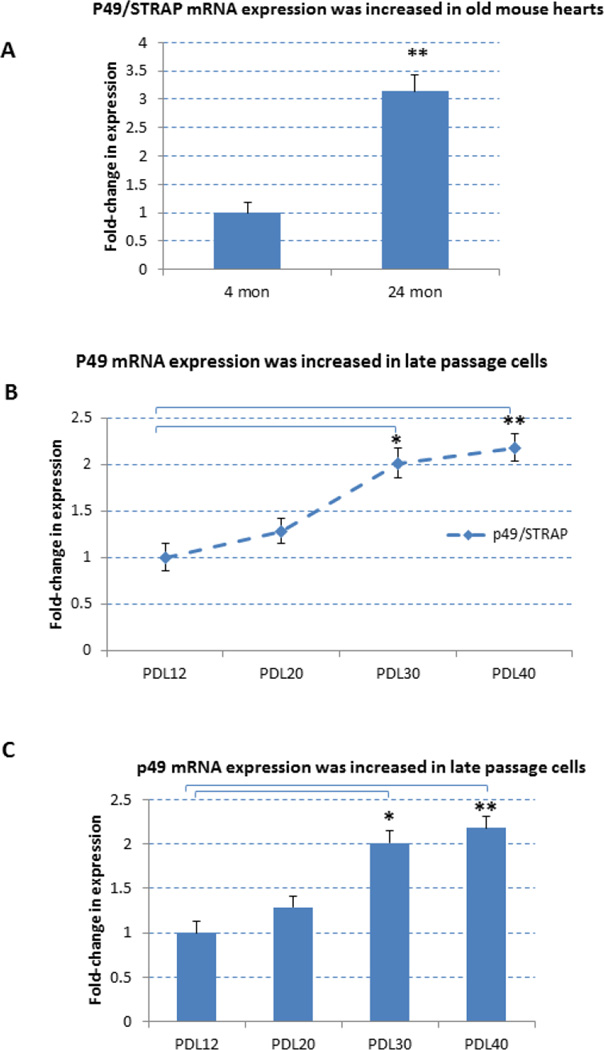
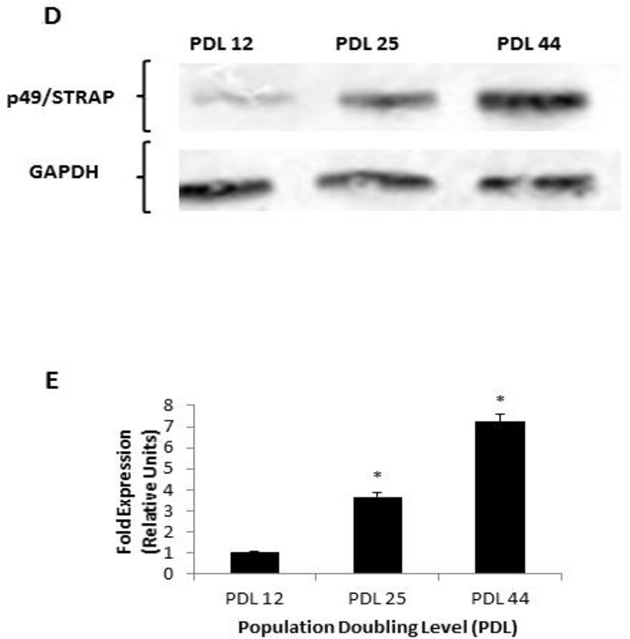
It has been observed that p49/STRAP is increased in hearts of 20 month old mice vs. 3 month old mice (Zhang et al., 2004). In the present study, the cardiac expression of p49/STRAP was compared between 4 month old vs. 24 month old mice. As shown in figure 1A, the expression of p49/STRAP mRNA was increased in 24 month old vs 4 month old mouse hearts (p<0.01, n=3). Since the age-related change in the expression of a specific gene that is observed in the young adult vs. old animal may not always be observed between early versus late passage primary cells in vitro, the p49/STRAP expression was also measured in HUVEC cells at different population doubling levels (PDL). As shown in figure 1B and 1C, 1D and 1E, both the p49/STRAP mRNA expression and protein expression levels were increased in late vs early PDL HUVEC cells, respectively.
Figure 1.
p49/STRAP gene expression was increased with advancing age and with cellular senescence.
1A. p49/STRAP mRNA expression was increased in the hearts of 24 month old versus 4 month old mice. Note that ** refers P<0.01, n=3.
1B. p49/STRAP mRNA expression was increased in late passage HUVEC cells. Note that * refers P<0.05, n=3; ** refers P<0.01, n=3.
1C. p49/STRAP mRNA expression was increased in late passage HUVEC cells. Note that * refers P<0.05, n=3; ** refers P<0.01, n=3.
1D. p49/STRAP protein expression was increased in late vs early passage HUVEC cells.
1E. Quantitation of p49/STRAP protein relative to loading control GAPDH protein. Note that * refers P<0.05, n=3.
3.2. p49/STRAP induced the deacetylation of histone H4 and repressed PGC-1α gene
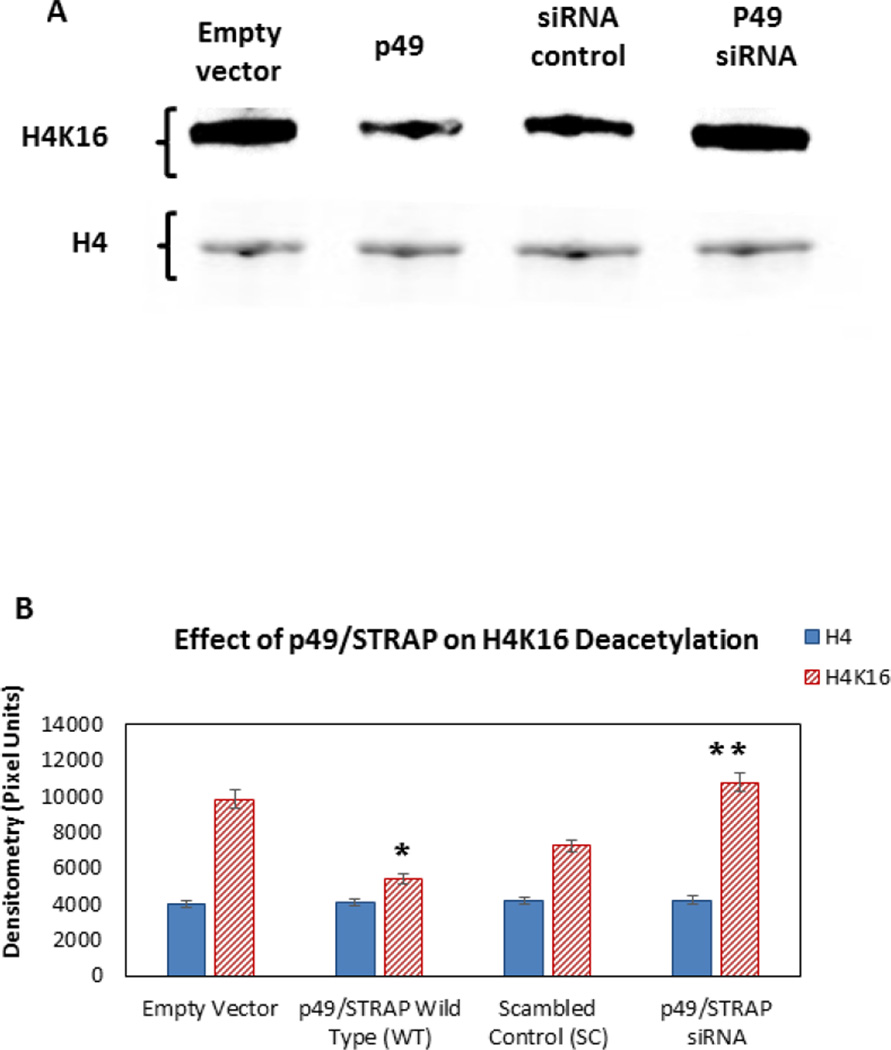
In our previous study, we found that P49/STRAP altered the NAD/NADH ratio and induced the deacetylation of serum response factor protein (Zhang et al., 2008). To test the hypothesis that p49/STRAP may induce the deacetylation of other proteins, including possibly a histone, we measured the acetylation status of histone H4. As shown in figure 2A and 2B, p49/STRAP overexpression resulted in reduced acetylation of histone H4 at lysine 16 (H4K16) protein, while knockdown of p49/STRAP increased acetylation of H4K16 protein in C2C12 cells.
Figure 2.
P49/STRAP reduced histone H4 acetylation and repressed the PGC-1α gene in C2C12 cells.
2A. p49/STRAP reduced the acetylation of histone H4 protein at lysine 16 (H4K16). P49/STRAP siRNA increased the H4K16 protein acetylation. Total histone H4 protein was used as a loading control.
2B. Quantitation of H4K16 protein relative to total histone H4 protein. Note that * refers P<0.05, n=3. ** refers P<0.01, n=3.
2C. P49/STRAP repressed the expression of PGC-1α mRNA (p<0.05, n=3), but did not change the expression of PGC-1β mRNA (NS, n=3).
2D. P49/STRAP siRNA increased the expression of PGC-1α mRNA (p<0.01, n=3), but did not significantly change the expression of PGC-1β mRNA (NS, n=3).
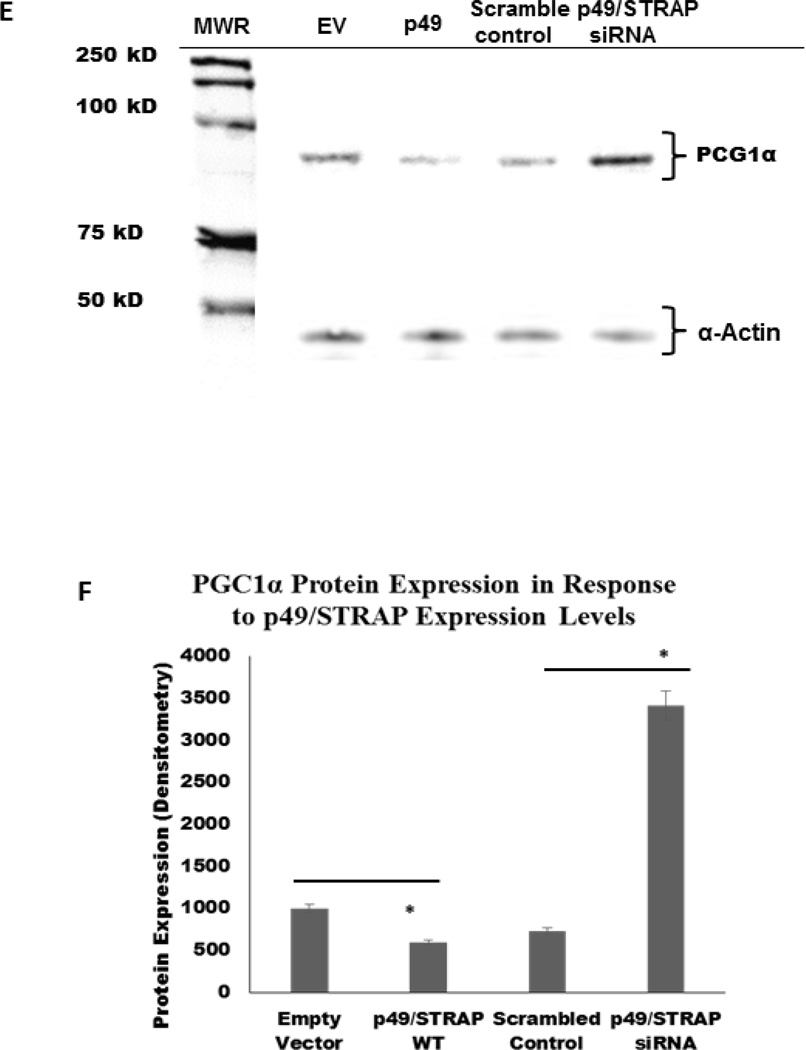
2E. Transfection of p49/STRAP reduced the PGC-1α protein level, while knockdown of p49/STRAP using siRNA increased the PGC-1α protein level in C2C12 cells.
2F. Quantification of PGC-1α protein expression. Note that * refers to p<0.05, n=3.
The effect of p49/STRAP on the expression of peroxisome proliferator-activated receptor gamma coactivator 1-alpha (PPARGC1A or PGC-1α) gene, which is an upstream regulator of mitochondrial genes, was examined. As shown in figure 2C, P49/STRAP repressed the expression of PGC-1α mRNA level (p<0.05, n=3), but did not change the expression of PGC-1β mRNA level (NS, n=3). P49/STRAP siRNA increased the expression of PGC-1α mRNA level (p<0.01, n=3), but did not significantly change the expression of PGC-1β mRNA level (NS, n=3, Figure 2D). P49/STRAP also repressed the PGC-1α protein expression, while P49/STRAP siRNA increased the PGC-1α protein express in C2C12 cells (p<0.05, n=3, Figure 2E and 2F).
3.3. p49/STRAP repressed the expression of mitofusin-1 & mitofusin-2 genes
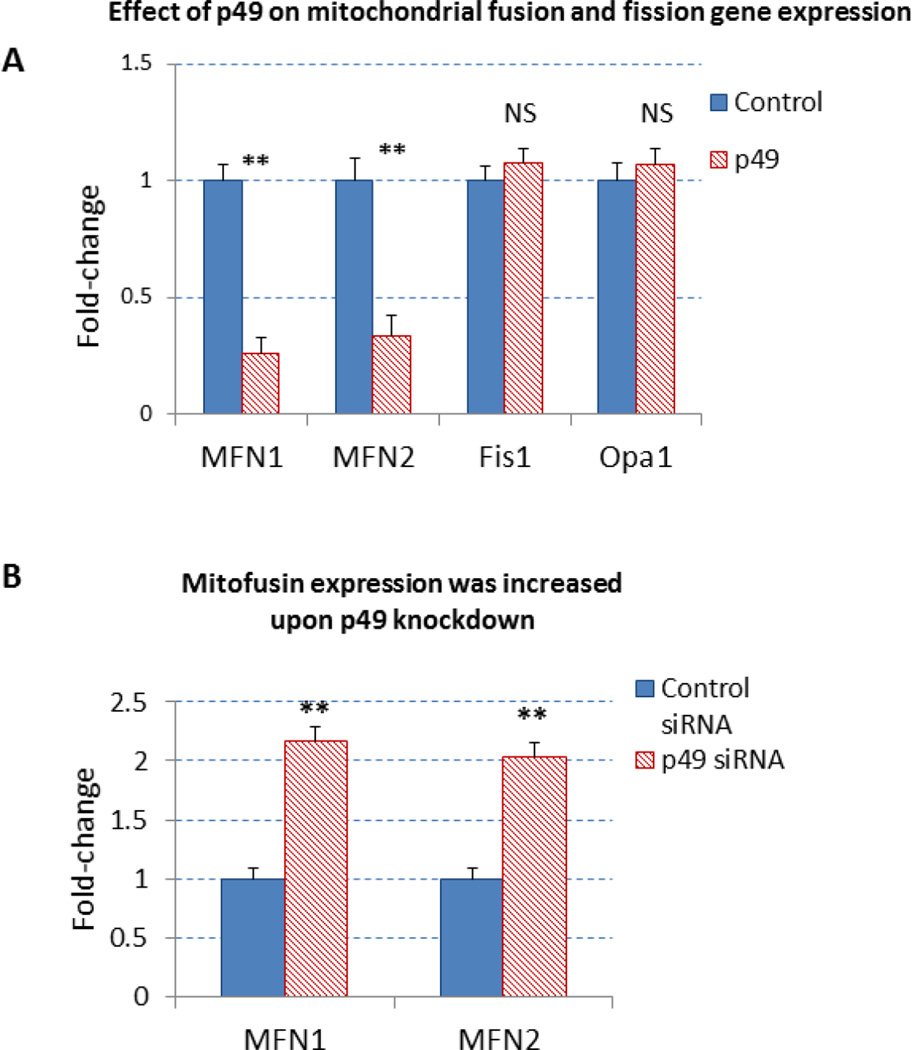
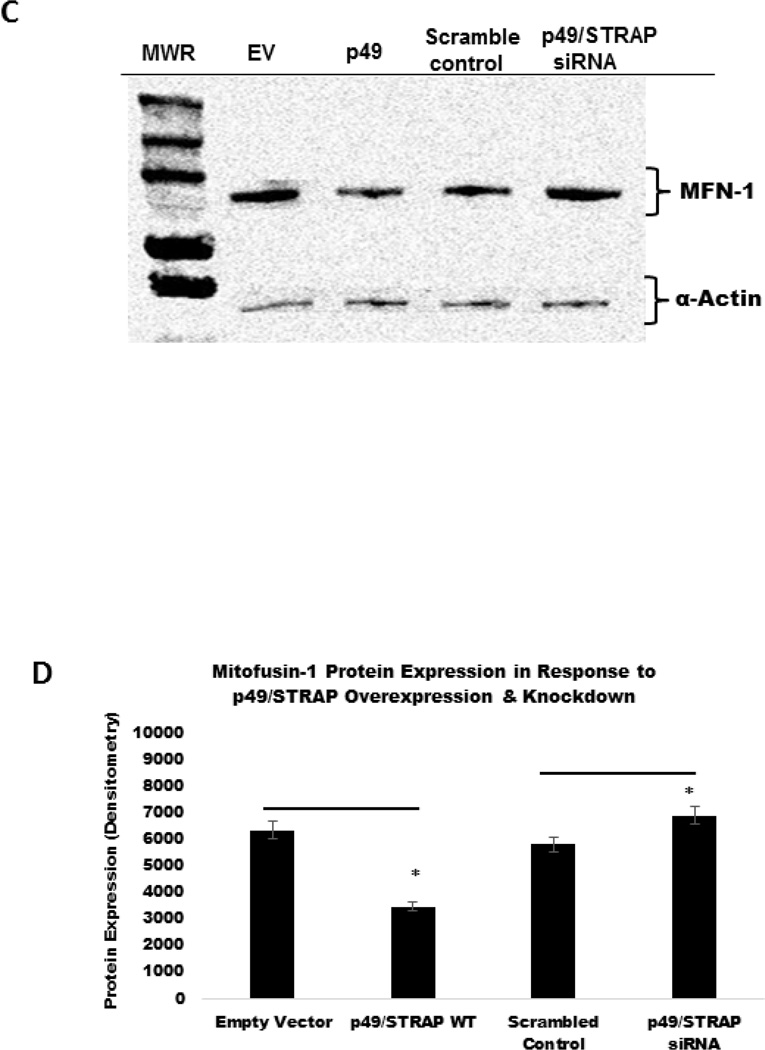
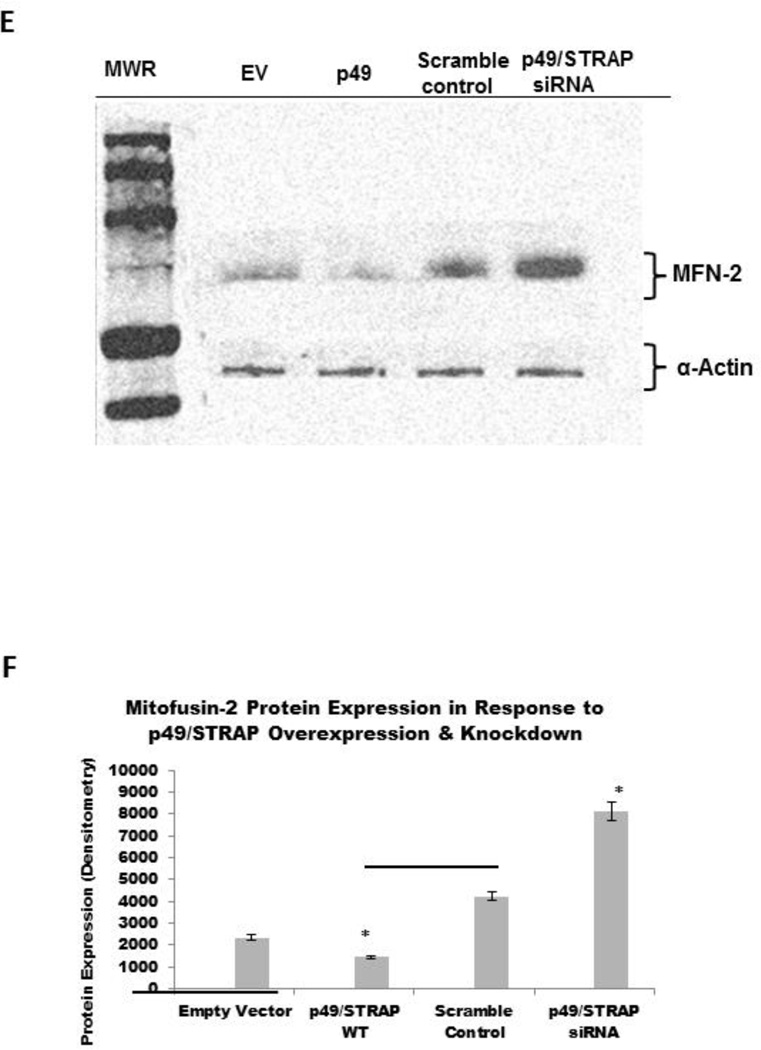
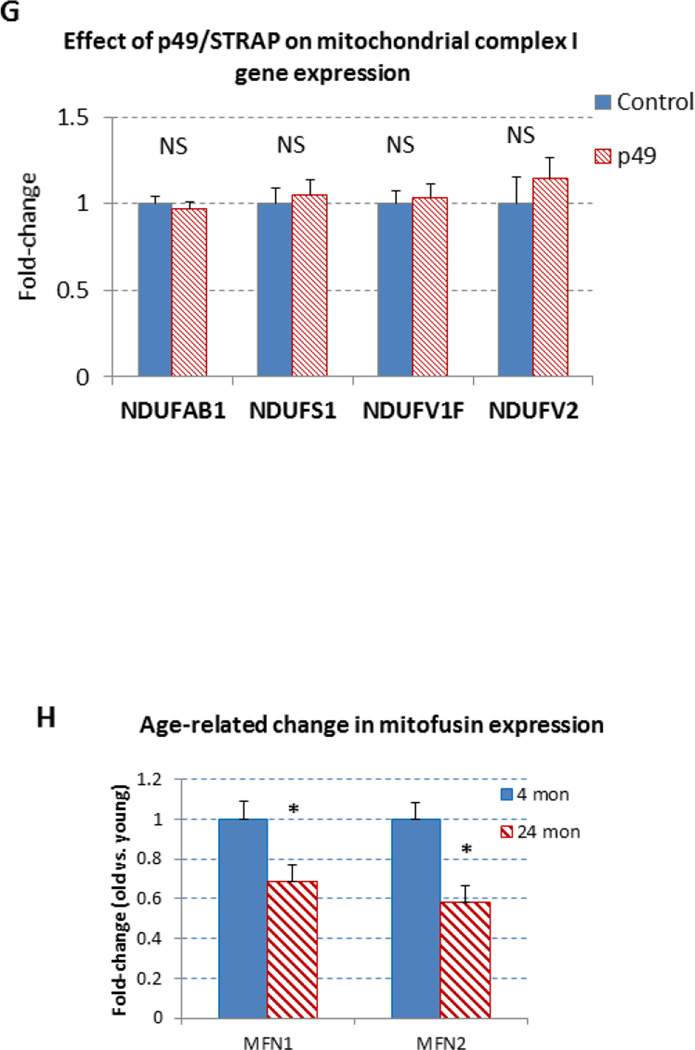
The PGC-1α is upstream regulator of mitochondrial genes, including mitofusin genes. To examine the effect of p49/STRAP on the expression of mitofusin genes, both p49/STRAP overexpression and p49/STRAP siRNA knockdown were employed. As shown in figure 3A, p49/STRAP repressed the gene expression of MFN1 (** p <0.01, n=3), and MFN2 (** p <0.01, n=3) mRNA levels, but did not change the expression of fission 1 (Fis1) (NS, n=3) or optic atrophy 1 (Opa1) mRNA levels (NS, n=3) in C2C12 cells. When p49/STRAP was knocked-down by siRNA, the expression of both MFN1 (** p <0.01, n=3) and MFN2 mRNA levels (** p <0.01, n=3) was increased (Figure 3B). p49/STRAP overexpression also repressed MFN1 and MFN2 protein levels, while knockdown of p49/STRAP gene using p49/STRAP siRNA raised both MFN1 and MFN2 protein levels (figure 3C–3F). However, p49/STRAP did not alter the expression of complex I subunit genes NDUFAB1, NDUFS1, NDUFV1, NDUFV2 mRNA levels in C2C12 cells (figure 3G).
Figure 3.
The effect of p49/STRAP on the expression of mitochondrial genes.
3A. p49/STRAP repressed the gene expression of MFN1 mRNA (** p <0.01, n=3), and MFN2 (** p <0.01, n=3) mRNA, but did not change the expression of fission 1 mRNA (Fis1) (NS, n=3) and optic atrophy 1 mRNA (Opa1) (NS, n=3) in C2C12 cells.
3B. p49/STRAP siRNA knockdown increased the expression of both MFN1 (** p <0.01, n=3) and MFN2 (** p <0.01, n=3) in C2C12 cells.
3C. P49/STRAP repressed the expression of MFN1 protein, while p49/STRAP siRNA increased MFN1 protein expression in C2C12 cells.
3D. Quantification of protein expression. Note that * refers to p<0.05, n=3.
3E. P49/STRAP repressed the expression of MFN2 protein, while p49/STRAP siRNA increased MFN2 protein expression in C2C12 cells.
3F. Quantitation of MFN2 protein expression. Note that * refers to p<0.05, n=3.
3G. p49/STRAP overexpression did not change the expression of NDUFAB1, NDUFS1, NDUFV1, NDUFV2 mRNA (NS, n=3) in C2C12 cells.
3H. Age-related change in the expression of MFN1, MFN2 mRNA levels in mouse hearts. The expression of both MFN1 and MFN2 mRNA levels were decreased in old versus young adult mouse hearts. Note that * refers P<0.05, n=3.
The expression of MFN1, MFN2 and p49/STRAP was also measured in old (24 month old) vs. young adult (4 month old) mouse hearts. As shown in figure 3H, both MFN1 and MFN2 mRNA levels were decreased in old vs. young adult mouse hearts (p<0.05, n=3).
3.4. p49/STRAP changed mitochondrial morphology and reduced mitochondrial membrane potential
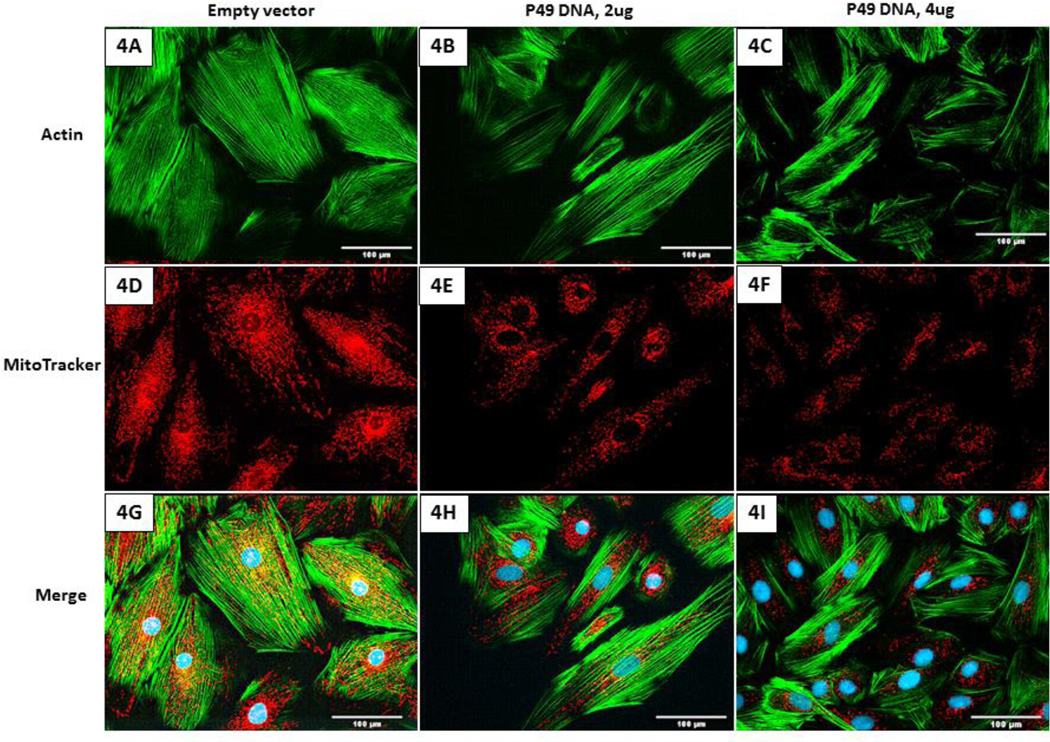
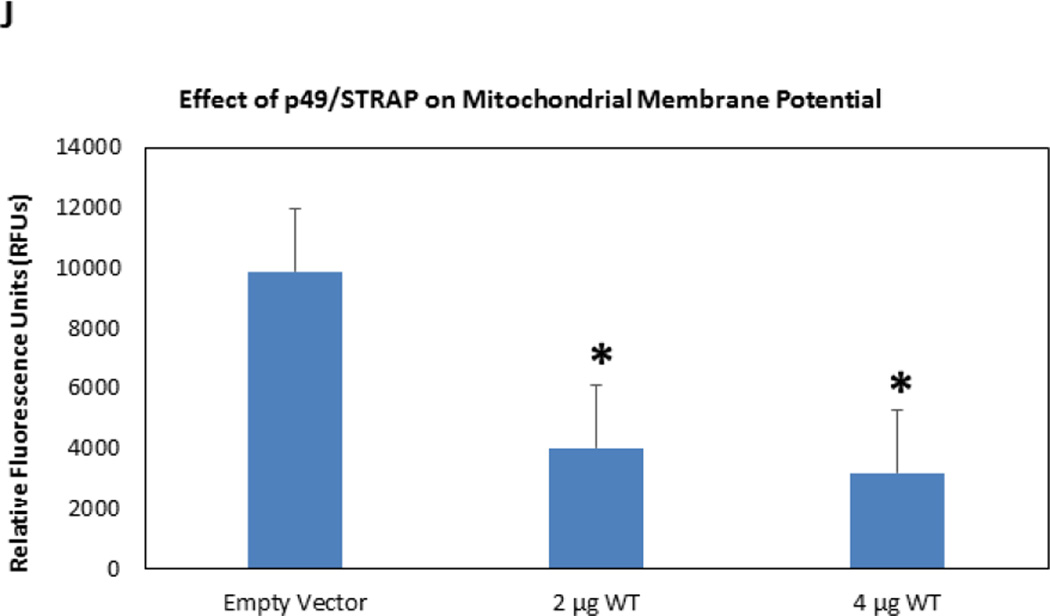
Mitochondrial membrane potential is an important indicator of cellular health under normal and stress conditions. Mitofusins regulate mitochondrial structure and morphology which in turn may affect the mitochondrial membrane potential. To examine the effect of p49/STRAP overexpression on mitochondrial morphology and membrane potential, the fluorescent dye MitoTracker was used to measure the mitochondrial morphology and membrane potential. As shown in figure 4, p49/STRAP reduced the mitochondrial size and the overall distribution. It also lowered the mitochondrial membrane potential in a dose dependent manner compared to control in C2C12 cells.
Figure 4.
P49/STRAP repressed mitochondrial membrane potential and reduced mitochondrial size in C2C12 cells. 4A–4C, actin staining. 4D–4F, MitoTracker staining. 4G–4I, merge of actin staining and MitoTracker staining. The brightness of the MitoTracker staining (red color) progressively declined in 4E and 4F compared to 4D, indicating that p49/STRAP repressed the membrane potential in a dose-dependent manner. The mitochondrial size in 4E and 4F were smaller than those in 4D. 4J, quantitation of the intensity of MitoTracker staining. Note that * refers P<0.05, n=3.
3.5. p49/STRAP repressed the mitochondrial oxygen consumption rate and affected glycolysis stress test under nutrient stress
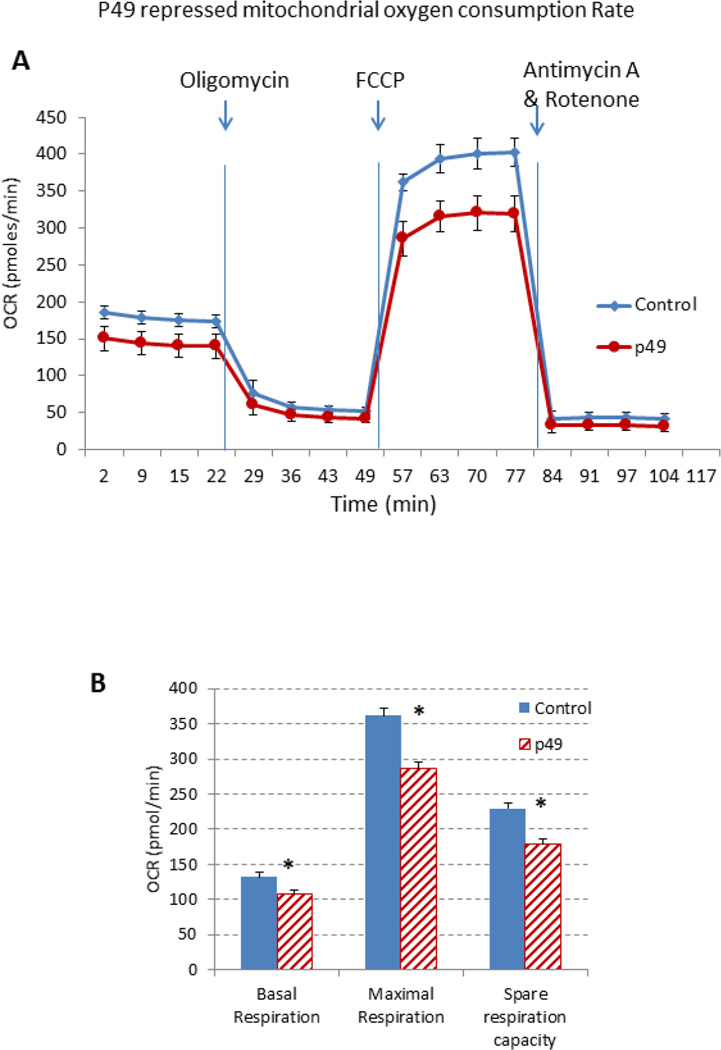
The effect of p49/STRAP on mitochondrial respiration was measured using the Seahorse XF96 Extracellular Flux Analyzer. As shown in figure 5A, p49/STRAP slightly repressed basal respiration of the C2C12 cells at the resting state. When ATPase activity was blocked by oligomycin, ATP production was decreased at a similar level in both empty vector-treated and p49/STRAP-treated C2C12 cells, while p49/STRAP expression seems not to have affected the proton leak. Subsequently, FCCP was injected to stimulate maximal capacity of cells for mitochondrial respiration. P49/STRAP reduced the maximal mitochondrial oxygen consumption rate. Data analysis (figure 5B) revealed that p49/STRAP repressed basal respiration (* p <0.05, n=3), maximal respiration (* p <0.05, n=3) and spare respiration capacity (* p <0.05, n=3) under normal/physiological glucose (5.5 mM) condition (figure 5B).
Figure 5.
Effect of p49/STRAP on oxygen consumption rate and glycolysis stress test.
5A. p49/STRAP repressed oxygen consumption rate (OCR) under normal/physiological glucose (5.5 mM) condition.
5B. Bar graph representation indicates that p49/STRAP repressed basal respiration (* p <0.05, n=3), maximal respiration (* p <0.05, n=3) and spare respiration capacity (* p <0.05, n=3) under normal/physiological glucose (5.5 mM) condition.
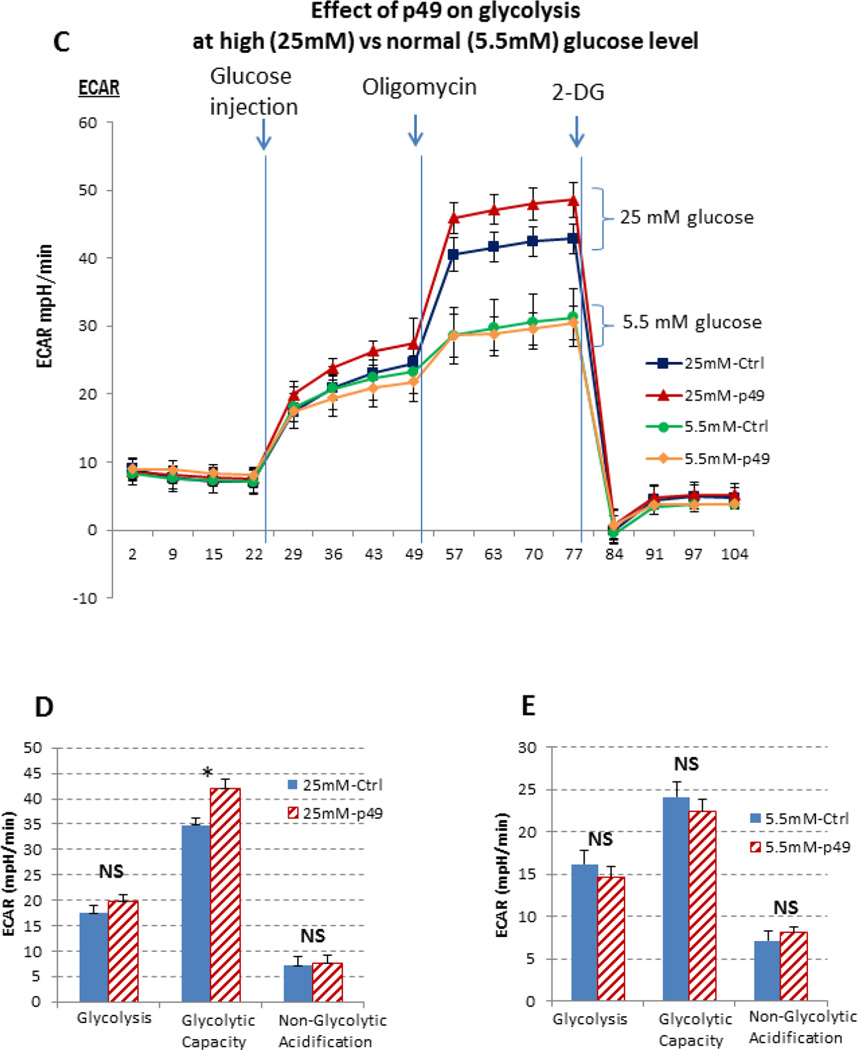
5C. The effect of p49/STRAP on glycolysis stress test under high glucose condition (25 mM) vs. normal glucose (5.5 mM) condition.
5D. Bar graph representation indicates that p49/STRAP repressed glycolytic capacity (* p <0.05, n=3), but did not affect both glycolysis (NS, n=3) and non-glycolytic acidification (NS, n=3) under high glucose (25 mM) condition.
5E. Bar graph representation indicates that p49/STRAP did not affect glycolysis (NS, n=3), glycolytic capacity (NS, n=3), and non-glycolytic acidification (NS, n=3) under normal/physiological glucose (5.5 mM) condition.
The effect of p49/STRAP on glycolysis stress test was also measured in C2C12 cells. As shown in figure 5C, p49/STRAP did not affect the glycolysis stress test at normal glucose levels. However, p49/STRAP affected glycolysis stress test under the nutrient stress condition of high glucose level (25 mM glucose). The glycolysis rate at baseline was similar in both control and p49/STRAP-treated cells. When high glucose was injected, the glycolysis rate was slightly increased, but reached maximal level when oligomycin was added to block the mitochondrial respiration. Data analysis indicate that p49/STRAP did not affect glycolysis (NS, n=3), glycolytic capacity (NS, n=3), nor non-glycolytic acidification (NS, n=3) under normal/physiological glucose (5.5 mM) condition (Figure 5D and 5E).
4. Discussion
The present study has several major findings. P49/STRAP induced the deacetylation of histone H4 and repressed the PGC-1α gene. P49/STRAP significantly repressed MFN1 and MFN2 genes at both the mRNA and protein levels and also reduced the mitochondrial membrane potential. P49/STRAP also repressed the mitochondrial oxygen consumption and modulated glycolysis stress under high glucose condition. We also found that the cardiac expression of p49/STRAP gene was increased, while the cardiac expression of the mitofusin-1 and 2 genes was decreased, in old versus young adult mice. These findings indicate that the age-associated increase in expression of p49/STRAP likely contributed partly to the reduced mitochondrial function and also altered cellular cytoskeletal dynamics and metabolism during adult aging.
Histone acetylation has long been associated with transcriptional regulation of gene expression during development and aging (Shahbazian and Grunstein, 2007; Walsh et al., 2015). Histone acetylation usually neutralizes the positive charge on lysine residue of the histone protein, which interferes with the protein-protein interaction between various histone proteins, and facilitates the association or disassociation of protein complexes containing various histones, transcriptional factors and other regulators (Taylor et al., 2013). Mutagenesis suggests that there is functional redundancy between most of the different acetylatable lysines in the H3 and H4 proteins with the exception that acetylation of H4 on lysine 16 (H4K16), which has a unique role in chromatin structure and function in a variety of eukaryotes (Dion et al., 2005; Millar et al., 2004). Within the N-terminus of the histone H4 protein sequence, H4K16 is the only amino acid residue that can be modified by acetylation or deacetylation (Dorigo et al., 2003). The acetylation status of H4K16 affects the interaction of H4 with other histone proteins, including H2A/H2B and also impacts heterochromatin formation (Millar et al., 2004). It has also been reported that H4K16 acetylation affects cellular lifespan (Dang et al., 2009).
Acetylation of histone H4 on lysine 16 (H4K16) is a prevalent and reversible epigenetic, posttranslational chromatin modification in eukaryotes, which affects various gene expression levels (Shogren-Knaak et al., 2006). The deacetylation of H4K16 that was induced by p49/STRAP overexpression might have also repressed the PGC-1a gene expression, which is an upstream regulator of the mitofusin genes, and further inhibited the expression of mitofusin genes. It is likely that p49/STRAP may also modulate mitochondrial function through its modulation of SRF-regulated cytoskeletal genes. Recent studies indicate that changes in cytoskeleton structure and F-actin may also affect mitochondrial dynamics (Jayashankar and Rafelski, 2014; Li et al., 2015). We have observed that overexpression of p49/STRAP/STR reduces intracellular F-actin levels and alters cellular morphology and structure (Zhang et al., 2014) (E Williams et al. unpublished). The mechanism(s) and signaling pathway(s) underlying those changes are of interest and warrant further investigation.
Peroxisome proliferator-activated receptor γ coactivator-1 (PGC-1) α and β are important positive regulators of mitochondrial activity and biogenesis in skeletal muscle (Liesa et al., 2008). PGC-1α is the upstream regulator of mitofusin genes. It has been shown that PGC-1a stimulates MFN2 gene promoter activity, and increases the expression of MFN2 mRNA and protein expression in both skeletal muscle and brown adipose tissue in conditions associated with enhanced energy expenditure (Hernandez-Alvarez et al., 2010; Martin et al., 2014). It is likely that the repression of PGC-1α gene by p49/STRAP may have negatively affected the expression of MFN2 gene expression.
Mitochondrial fission and fusion play critical roles in regulating mitochondrial morphology and maintaining functional mitochondria when cells experience metabolic or environmental stresses under physiological and/or pathological conditions (Campello and Scorrano, 2010). Fusion helps mitigate stress by mixing the contents of partially damaged mitochondria as a form of complementation. Fission is needed to create new mitochondria, but it also contributes to quality control by enabling the removal of damaged mitochondria and can facilitate apoptosis during high levels of cellular stress. Disruptions in these processes affect normal development, maturation and adult aging (Youle and van der Bliek, 2012).
Three GTPase dynamin-like proteins, Mfn1, Mfn2 and OPA1, are the major players in regulating the fusion process. MFN1 and MFN2 are located in the outer mitochondrial membrane, which bind and hydrolyze guanosine 5'-triphosphate to facilitate the merging of adjacent mitochondrial membranes. The optic atrophy protein 1 (OPA1) is on the inner membrane, which induces mitochondrial fusion, but cannot execute the tabulation (which drives mitochondrial network formation), without the assistance of MFN1 (Cipolat et al., 2004).
Animal studies have demonstrated that Mfn1 and Mfn2 are essential to mitochondrial remodeling during postnatal cardiac development and that targeted mutation of both MFN1 and MFN2 resulted in cardiomyopathy and early postnatal death (Papanicolaou et al., 2012). Mutations in the genes that regulate fusion and fission are associated with a number of human diseases, which include Optic atrophy, axonal neuropathy, spasticity, progressive external ophthalmoplegia and limb girdle weakness (Wallace, 2005). Recent studies also indicate that defective mitochondrial dynamics may play a role in the development of age-related diseases, including Alzheimer’s and Parkinson’s diseases (Dupuis, 2014).
The mitochondrial membrane potential is a useful indicator for monitoring changes in the cell’s capacity to generate ATP through oxidative phosphorylation (Perry et al., 2011). It has been reported that repression of mitofusin causes changes in mitochondrial morphology and reduces the mitochondrial membrane potential, while it also causes other functional changes, including reduction in cellular respiration, glucose oxidation and proton leak (Eisner et al., 2014; Legros et al., 2002). For instance, inhibition of MFN1 reduces mitochondrial fusion, causes dysregulation of calcium oscillations and reduces cellular metabolic capacity (Eisner et al., 2014). Mfn2 loss-of-function reduces mitochondrial membrane potential, oxygen consumption and the oxidation of glucose, pyruvate and fatty acids (Zorzano and Pich, 2006).
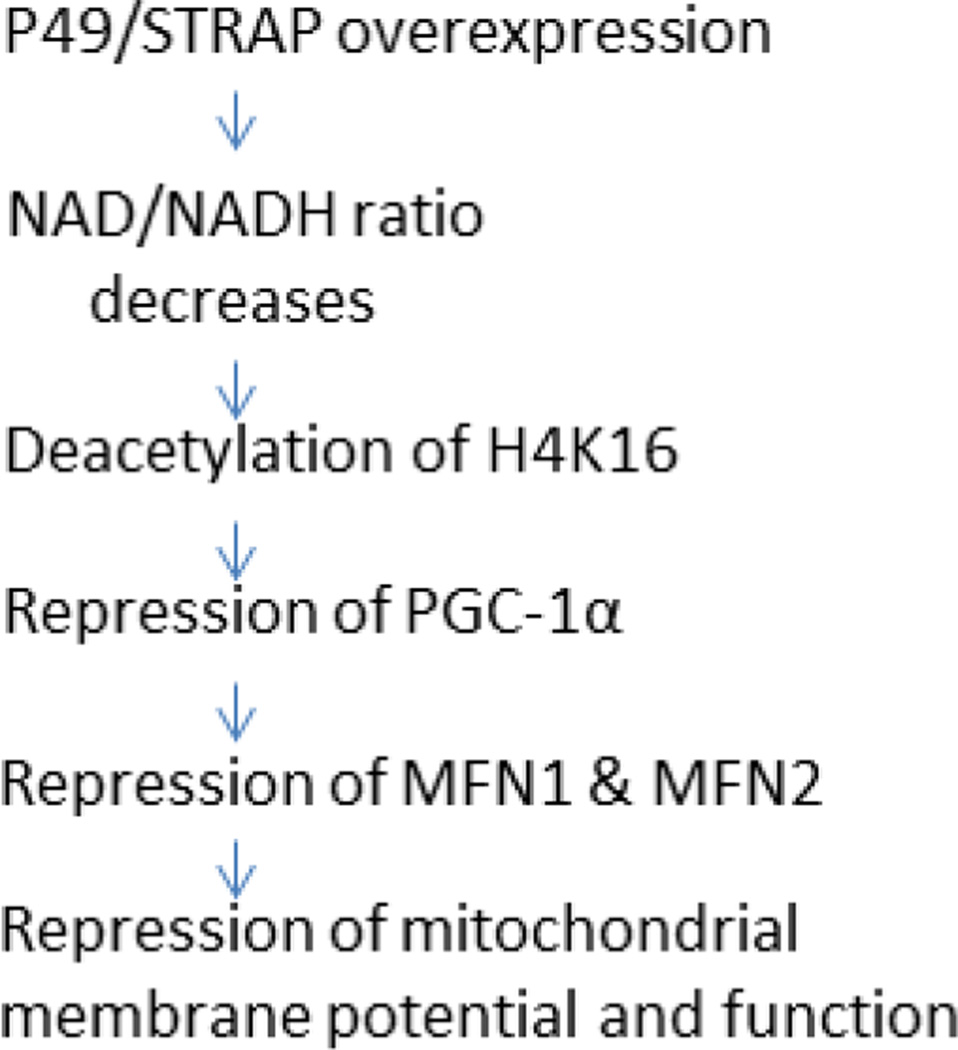
Taken together, p49/STRAP overexpression alters the NAD/NADH ratio and induced the deacetylation of histone H4 and repressed the expression of PGC-1α as well as MFN1 and MFN2 genes, and likely thereby altered the mitochondrial membrane potential and reduced mitochondrial function (figure 6). The age-associated increased cardiac expression of p49/STRAP gene in old versus young adult mice likely also contributed to the age-associated decline in mitochondrial function in the mammalian heart during adult aging and senescence.
Figure 6.
A proposed pathway via which p49/STRAP overexpression could induce repression of mitochondrial membrane potential and function.
Highlights.
p49/STRAP (SRFBP1) is a transcriptional regulator that has been implicated in cardiac aging. p49/STRAP has a SRF binding domain and a BUD22 domain (which modulates cellular growth rate and cell size). We have observed that p49/STRAP alters the intracellular NAD/NADH ratio and induces protein deacetylation. Here we report that p49/STRAP overexpression caused the deacetylation of histone H4 on lysine 16 (H4K16) and suppressed the expression of PGC-1α as well as mitofusin-1 and mitofusin-2 at both the mRNA and protein levels. P49/STRAP also reduced mitochondrial size, mitochondrial membrane potential and the mitochondrial oxygen consumption rate. We noted that P49/STRAP expression was increased in the old versus young adult mouse hearts and also increased with advancing population doubling levels in cultured human umbilical vein endothelial cells (HUVECs). It is therefore very plausible that increased expression of p49/STRAP in late life may alter the status of histone acetylation and impact mitochondrial dynamics and thereby reduce mitochondrial function and cardiac performance during mammalian senescence.
Acknowledgments
Supported in part by the Claude D. Pepper Older American Independence Center grant (1P30AG28718). We thank Laura Gocio for the assistance with the manuscript preparation.
Footnotes
Publisher's Disclaimer: This is a PDF file of an unedited manuscript that has been accepted for publication. As a service to our customers we are providing this early version of the manuscript. The manuscript will undergo copyediting, typesetting, and review of the resulting proof before it is published in its final citable form. Please note that during the production process errors may be discovered which could affect the content, and all legal disclaimers that apply to the journal pertain.
Author’s contributions
Conceived and designed the experiments: XMZ, JYW. Performed the experiments: XMZ. EDW, SCR. Analyzed the data: XMZ, GA, SCR, JYW. Wrote the paper: XMZ, JYW. Participated in the coordination of the study: GA. Overall interpretation of results: JYW. All authors read and approved the final manuscript.
References
- Bak MI, Wei JY, Ingwall JS. Interaction of hypoxia and aging in the heart: analysis of high energy phosphate content. Journal of molecular and cellular cardiology. 1998;30:661–672. doi: 10.1006/jmcc.1997.0633. [DOI] [PubMed] [Google Scholar]
- Ballard VL, Edelberg JM. Stem cells for cardiovascular repair - the challenges of the aging heart. Journal of molecular and cellular cardiology. 2008;45:582–592. doi: 10.1016/j.yjmcc.2008.02.277. [DOI] [PubMed] [Google Scholar]
- Campello S, Scorrano L. Mitochondrial shape changes: orchestrating cell pathophysiology. EMBO Rep. 2010;11:678–684. doi: 10.1038/embor.2010.115. [DOI] [PMC free article] [PubMed] [Google Scholar]
- Cipolat S, Martins de Brito O, Dal Zilio B, Scorrano L. OPA1 requires mitofusin 1 to promote mitochondrial fusion. Proceedings of the National Academy of Sciences of the United States of America. 2004;101:15927–15932. doi: 10.1073/pnas.0407043101. [DOI] [PMC free article] [PubMed] [Google Scholar]
- Dang W, Steffen KK, Perry R, Dorsey JA, Johnson FB, Shilatifard A, Kaeberlein M, Kennedy BK, Berger SL. Histone H4 lysine 16 acetylation regulates cellular lifespan. Nature. 2009;459:802–807. doi: 10.1038/nature08085. [DOI] [PMC free article] [PubMed] [Google Scholar]
- Detmer SA, Chan DC. Functions and dysfunctions of mitochondrial dynamics. Nature reviews Molecular cell biology. 2007;8:870–879. doi: 10.1038/nrm2275. [DOI] [PubMed] [Google Scholar]
- Dietrich MO, Liu ZW, Horvath TL. Mitochondrial dynamics controlled by mitofusins regulate Agrp neuronal activity and diet-induced obesity. Cell. 2013;155:188–199. doi: 10.1016/j.cell.2013.09.004. [DOI] [PMC free article] [PubMed] [Google Scholar]
- Dion MF, Altschuler SJ, Wu LF, Rando OJ. Genomic characterization reveals a simple histone H4 acetylation code. Proceedings of the National Academy of Sciences of the United States of America. 2005;102:5501–5506. doi: 10.1073/pnas.0500136102. [DOI] [PMC free article] [PubMed] [Google Scholar]
- Dorigo B, Schalch T, Bystricky K, Richmond TJ. Chromatin fiber folding: requirement for the histone H4 N-terminal tail. J Mol Biol. 2003;327:85–96. doi: 10.1016/s0022-2836(03)00025-1. [DOI] [PubMed] [Google Scholar]
- Dupuis L. Mitochondrial quality control in neurodegenerative diseases. Biochimie. 2014;100:177–183. doi: 10.1016/j.biochi.2013.07.033. [DOI] [PubMed] [Google Scholar]
- Eisner V, Lenaers G, Hajnoczky G. Mitochondrial fusion is frequent in skeletal muscle and supports excitation-contraction coupling. The Journal of cell biology. 2014;205:179–195. doi: 10.1083/jcb.201312066. [DOI] [PMC free article] [PubMed] [Google Scholar]
- Hernandez-Alvarez MI, Thabit H, Burns N, Shah S, Brema I, Hatunic M, Finucane F, Liesa M, Chiellini C, Naon D, Zorzano A, Nolan JJ. Subjects with early-onset type 2 diabetes show defective activation of the skeletal muscle PGC-1{alpha}/Mitofusin-2 regulatory pathway in response to physical activity. Diabetes care. 2010;33:645–651. doi: 10.2337/dc09-1305. [DOI] [PMC free article] [PubMed] [Google Scholar]
- Jayashankar V, Rafelski SM. Integrating mitochondrial organization and dynamics with cellular architecture. Current opinion in cell biology. 2014;26:34–40. doi: 10.1016/j.ceb.2013.09.002. [DOI] [PubMed] [Google Scholar]
- Khrapko K, Bodyak N, Thilly WG, van Orsouw NJ, Zhang X, Coller HA, Perls TT, Upton M, Vijg J, Wei JY. Cell-by-cell scanning of whole mitochondrial genomes in aged human heart reveals a significant fraction of myocytes with clonally expanded deletions. Nucleic Acids Res. 1999;27:2434–2441. doi: 10.1093/nar/27.11.2434. [DOI] [PMC free article] [PubMed] [Google Scholar]
- Legros F, Lombes A, Frachon P, Rojo M. Mitochondrial fusion in human cells is efficient, requires the inner membrane potential, and is mediated by mitofusins. Molecular biology of the cell. 2002;13:4343–4354. doi: 10.1091/mbc.E02-06-0330. [DOI] [PMC free article] [PubMed] [Google Scholar]
- Li S, Xu S, Roelofs BA, Boyman L, Lederer WJ, Sesaki H, Karbowski M. Transient assembly of F-actin on the outer mitochondrial membrane contributes to mitochondrial fission. The Journal of cell biology. 2015;208:109–123. doi: 10.1083/jcb.201404050. [DOI] [PMC free article] [PubMed] [Google Scholar]
- Liesa M, Borda-d'Agua B, Medina-Gomez G, Lelliott CJ, Paz JC, Rojo M, Palacin M, Vidal-Puig A, Zorzano A. Mitochondrial fusion is increased by the nuclear coactivator PGC-1beta. PloS one. 2008;3:e3613. doi: 10.1371/journal.pone.0003613. [DOI] [PMC free article] [PubMed] [Google Scholar]
- Mai S, Klinkenberg M, Auburger G, Bereiter-Hahn J, Jendrach M. Decreased expression of Drp1 and Fis1 mediates mitochondrial elongation in senescent cells and enhances resistance to oxidative stress through PINK1. Journal of cell science. 2010;123:917–926. doi: 10.1242/jcs.059246. [DOI] [PubMed] [Google Scholar]
- Martin OJ, Lai L, Soundarapandian MM, Leone TC, Zorzano A, Keller MP, Attie AD, Muoio DM, Kelly DP. A role for peroxisome proliferator-activated receptor gamma coactivator-1 in the control of mitochondrial dynamics during postnatal cardiac growth. Circulation research. 2014;114:626–636. doi: 10.1161/CIRCRESAHA.114.302562. [DOI] [PMC free article] [PubMed] [Google Scholar]
- Millar CB, Kurdistani SK, Grunstein M. Acetylation of yeast histone H4 lysine 16: a switch for protein interactions in heterochromatin and euchromatin. Cold Spring Harbor symposia on quantitative biology. 2004;69:193–200. doi: 10.1101/sqb.2004.69.193. [DOI] [PubMed] [Google Scholar]
- Nekhaeva E, Bodyak ND, Kraytsberg Y, McGrath SB, Van Orsouw NJ, Pluzhnikov A, Wei JY, Vijg J, Khrapko K. Clonally expanded mtDNA point mutations are abundant in individual cells of human tissues. Proceedings of the National Academy of Sciences of the United States of America. 2002;99:5521–5526. doi: 10.1073/pnas.072670199. [DOI] [PMC free article] [PubMed] [Google Scholar]
- Odiet JA, Wei JY. Heart failure and the aging myocardium: Possible role of cardiac mitochondria. Heart failure reviews. 1996;1:139–149. [Google Scholar]
- Papanicolaou KN, Kikuchi R, Ngoh GA, Coughlan KA, Dominguez I, Stanley WC, Walsh K. Mitofusins 1 and 2 are essential for postnatal metabolic remodeling in heart. Circulation research. 2012;111:1012–1026. doi: 10.1161/CIRCRESAHA.112.274142. [DOI] [PMC free article] [PubMed] [Google Scholar]
- Perry SW, Norman JP, Barbieri J, Brown EB, Gelbard HA. Mitochondrial membrane potential probes and the proton gradient: a practical usage guide. BioTechniques. 2011;50:98–115. doi: 10.2144/000113610. [DOI] [PMC free article] [PubMed] [Google Scholar]
- Ranieri M, Brajkovic S, Riboldi G, Ronchi D, Rizzo F, Bresolin N, Corti S, Comi GP. Mitochondrial fusion proteins and human diseases. Neurology research international. 2013;2013:293893. doi: 10.1155/2013/293893. [DOI] [PMC free article] [PubMed] [Google Scholar]
- Rogers SC, Zhang X, Azhar G, Luo S, Wei JY. Exposure to high or low glucose levels accelerates the appearance of markers of endothelial cell senescence and induces dysregulation of nitric oxide synthase. The journals of gerontology Series A, Biological sciences and medical sciences. 2013;68:1469–1481. doi: 10.1093/gerona/glt033. [DOI] [PMC free article] [PubMed] [Google Scholar]
- Seo AY, Joseph AM, Dutta D, Hwang JC, Aris JP, Leeuwenburgh C. New insights into the role of mitochondria in aging: mitochondrial dynamics and more. Journal of cell science. 2010;123:2533–2542. doi: 10.1242/jcs.070490. [DOI] [PMC free article] [PubMed] [Google Scholar]
- Shahbazian MD, Grunstein M. Functions of site-specific histone acetylation and deacetylation. Annual review of biochemistry. 2007;76:75–100. doi: 10.1146/annurev.biochem.76.052705.162114. [DOI] [PubMed] [Google Scholar]
- Shogren-Knaak M, Ishii H, Sun JM, Pazin MJ, Davie JR, Peterson CL. Histone H4-K16 acetylation controls chromatin structure and protein interactions. Science. 2006;311:844–847. doi: 10.1126/science.1124000. [DOI] [PubMed] [Google Scholar]
- Song M, Mihara K, Chen Y, Scorrano L, Dorn GW., 2nd Mitochondrial fission and fusion factors reciprocally orchestrate mitophagic culling in mouse hearts and cultured fibroblasts. Cell metabolism. 2015;21:273–285. doi: 10.1016/j.cmet.2014.12.011. [DOI] [PMC free article] [PubMed] [Google Scholar]
- Sun N, Youle RJ, Finkel T. The Mitochondrial Basis of Aging. Molecular cell. 2016;61:654–666. doi: 10.1016/j.molcel.2016.01.028. [DOI] [PMC free article] [PubMed] [Google Scholar]
- Taylor GC, Eskeland R, Hekimoglu-Balkan B, Pradeepa MM, Bickmore WA. H4K16 acetylation marks active genes and enhancers of embryonic stem cells, but does not alter chromatin compaction. Genome Res. 2013;23:2053–2065. doi: 10.1101/gr.155028.113. [DOI] [PMC free article] [PubMed] [Google Scholar]
- Vijg J, Wei JY. Understanding the biology of aging: the key to prevention and therapy. Journal of the American Geriatrics Society. 1995;43:426–434. doi: 10.1111/j.1532-5415.1995.tb05819.x. [DOI] [PubMed] [Google Scholar]
- Wallace DC. A mitochondrial paradigm of metabolic and degenerative diseases, aging, and cancer: a dawn for evolutionary medicine. Annual review of genetics. 2005;39:359–407. doi: 10.1146/annurev.genet.39.110304.095751. [DOI] [PMC free article] [PubMed] [Google Scholar]
- Walsh ME, Bhattacharya A, Sataranatarajan K, Qaisar R, Sloane L, Rahman MM, Kinter M, Van Remmen H. The histone deacetylase inhibitor butyrate improves metabolism and reduces muscle atrophy during aging. Aging cell. 2015;14:957–970. doi: 10.1111/acel.12387. [DOI] [PMC free article] [PubMed] [Google Scholar]
- Wei JY. Age and the cardiovascular system. The New England journal of medicine. 1992;327:1735–1739. doi: 10.1056/NEJM199212103272408. [DOI] [PubMed] [Google Scholar]
- Westermann B. Mitochondrial fusion and fission in cell life and death. Nature reviews Molecular cell biology. 2010;11:872–884. doi: 10.1038/nrm3013. [DOI] [PubMed] [Google Scholar]
- Williams ED, Rogers SC, Zhang X, Azhar G, Wei JY. Elevated oxygen consumption rate in response to acute low-glucose stress: Metformin restores rate to normal level. Experimental gerontology. 2015;70:157–162. doi: 10.1016/j.exger.2015.08.002. [DOI] [PMC free article] [PubMed] [Google Scholar]
- Youle RJ, van der Bliek AM. Mitochondrial fission, fusion, and stress. Science. 2012;337:1062–1065. doi: 10.1126/science.1219855. [DOI] [PMC free article] [PubMed] [Google Scholar]
- Zhang X, Azhar G, Helms S, Zhong Y, Wei JY. Identification of a subunit of NADH-dehydrogenase as a p49/STRAP-binding protein. BMC cell biology. 2008;9:8. doi: 10.1186/1471-2121-9-8. [DOI] [PMC free article] [PubMed] [Google Scholar]
- Zhang X, Azhar G, Rogers SC, Foster SR, Luo S, Wei JY. Overexpression of p49/STRAP alters cellular cytoskeletal structure and gross anatomy in mice. BMC cell biology. 2014;15:32. doi: 10.1186/1471-2121-15-32. [DOI] [PMC free article] [PubMed] [Google Scholar]
- Zhang X, Azhar G, Zhong Y, Wei JY. Identification of a novel serum response factor cofactor in cardiac gene regulation. The Journal of biological chemistry. 2004;279:55626–55632. doi: 10.1074/jbc.M405945200. [DOI] [PubMed] [Google Scholar]
- Zorzano A, Pich S. What is the biological significance of the two mitofusin proteins present in the outer mitochondrial membrane of mammalian cells? IUBMB life. 2006;58:441–443. doi: 10.1080/15216540600644838. [DOI] [PubMed] [Google Scholar]


