Abstract
Purpose
To report outer retinal structural changes associated with macular capillary non-perfusion at the level of deep capillary plexus (DCP) in diabetic patients.
Design
Prospective observational cross-sectional study.
Methods
The study included 14 eyes of 10 patients who were diagnosed as having diabetic retinopathy. To study the outer retina and localize areas of capillary non-perfusion at the superficial (SCP) or DCP, we used the spectral domain optical coherence tomography (SD-OCT) device (RTVue-XR Avanti, Optovue Inc, Fremont, California) with split-spectrum amplitude-decorrelation angiography (SSADA) software for optical coherence tomography angiography (OCTA). Two independent masked graders (F.S. and A.A.F.) qualitatively evaluated SD-OCT scans as either normal or having outer retina disruption. The angiographic images were examined to define the presence and location of capillary non-perfusion.
Results
Eight eyes showed outer retinal disruption on SD-OCT that co-localized to areas of enlarged foveal avascular zone, enlarged areas of no flow between capillaries and capillary non-perfusion of the DCP. Six eyes without outer retinal changes on SD-OCT showed robust perfusion of the DCP.
Conclusions
Using OCTA, this study shows that macular photoreceptor disruption on SD-OCT in patients with diabetic retinopathy corresponds to areas of capillary non-perfusion at the level of DCP. This is important in highlighting the contribution of the DCP to the oxygen requirements of the photoreceptors as well as the outer retina in diabetic macular ischemia.
Introduction
The human macular vascular supply is a complex system comprised of three inter-connected capillary plexuses; the superficial capillary plexus (SCP), which lies in the retinal nerve fiber layer, while the middle (MCP) and deep capillary plexus (DCP) are located at the inner and outer borders of the inner nuclear layer, respectively.1, 2 This complex vascular arrangement leaves the fovea (foveal avascular zone; FAZ) and the outer retina avascular, with their oxygen demand primarily dependent on diffusion from the choroidal circulation.3, 4 Interestingly, experimental studies have shown that the DCP contributes to photoreceptor inner segment oxygen requirements (10–15%), particularly during dark adaptation.5 More importantly, recent experimental evidence from our group suggests that during systemic hypoxia, the inner retinal vascular contribution to the metabolic needs of the outer retina become even more significant, as the choroidal vasculature fails to auto-regulate its blood supply in the setting of hypoxia.6
Thus, extrapolating from this finding, it is intriguing to question whether the choroidal circulation is able to compensate for retinal capillary ischemia in the setting of diabetic retinopathy (DR). In addition, given the potential for underlying diabetic choroidopathy and the generalized failure of auto-regulation, it is likely that the photoreceptors are in a state of chronic, unmitigated hypoxia during diabetes.7 Supporting this hypothesis, we have recently shown that diabetic capillary non-perfusion can be associated with outer retinal disruption on Spectral Domain-Optical Coherence Tomography (SD-OCT), and proposed that non-perfusion of the DCP in these patients could explain these outer retinal structural changes.8 Innovative software enhancements in SD-OCT have introduced OCT angiography (OCTA)9, which allows non-invasive visualization of the three-dimensional blood flow within retinal capillaries including the SCP, DCP, as well as the choriocapillaris. A recent study has shown that OCTA allows depth resolved visualization of abnormal vascular changes in DR, including neovascularization, microaneurysms as well as areas of retinal capillary non-perfusion, with the added advantage of detailed information regarding the individual layers of the retinal capillaries.10
In the current prospective study, using OCTA, we sought to further confirm our hypothesis that photoreceptor and outer retinal disruption on SD-OCT in diabetic macular ischemia corresponds to areas of capillary non-perfusion at the level of DCP.8 To confirm our hypothesis, we examined 15 eyes of 11 diabetic patients, focusing on 9 eyes with outer retinal changes on SD-OCT and diabetic macular capillary non-perfusion on OCTA at the level of the DCP.
Methods
This study was a prospective consecutive case series of patients examined at the Department of Ophthalmology, Northwestern University, Chicago, Illinois between June 12, 2015 and October 15, 2015. This study was approved by the Institutional Review Board of Northwestern University, followed the tenets of the Declaration of Helsinki and was performed in accordance with HIPAA regulations. Written informed consent was obtained from all participants.
Study Sample
Inclusion criteria for this study included diabetic patients diagnosed with different stages of DR, ranging from minimal non-proliferative DR (NPDR) to high-risk and treated quiescent proliferative DR (PDR). We also included one eye from a healthy, age-matched individual with normal DCP perfusion for comparison with our study sample.
Exclusion criteria included patients with significant diabetic macular edema (DME), diagnosed either clinically or with SD-OCT, that disrupted the contour of the segmentation on OCTA, or if the edema was diffuse and obscured the entire outer retinal changes in areas of non-perfusion. We defined DME as central subfield thickening of at least 250 microns (2 standard deviations above average normal thickness).11 Other exclusion criteria included eyes that had undergone surgical retinal repair or laser treatment within the past 5 years and/or any laser treatment in the area with outer retinal disruption as revealed on SD-OCT, as well as eyes that had received intravitreal anti-vascular endothelial growth factor or intravitreal corticosteroids. We also excluded patients with evidence of significant cataracts, graded above nuclear opalescence grade three or nuclear color grade three in order to avoid optical artifacts that may potentially compromise SD-OCT image quality. We excluded eyes with other retinal disease that may contribute to retinal non-perfusion, including arterial branch occlusion of the retina. After image acquisition, we excluded eyes where the OCTA images had movement or shadow artifacts in the area of interest, OCTA signal strength score lower than 50, and eyes with previously undetected cystic changes and macular edema. The original study population included 28 eyes of 14 patients and, after applying the exclusion criteria, only 14 eyes of 10 patients from the original study population were found eligible and are included in the study as well as one healthy (non-diabetic) control eye.
Study Procedures
To localize the level of capillary non-perfusion at the SCP or DCP, we used the XR Avanti Optical Coherence Tomography OCTA instrument (Optovue Inc., Fremont, California, USA) with split-spectrum amplitude-decorrelation angiography (SSADA) software.9 SD-OCT images from the same OCTA device, in the same OCT volume were used to study outer retinal disruption. This instrument has an A-scan rate of 70,000 scans per second and uses a light source centered on 840 nm and a bandwidth of 45 nm. A 3 X 3-mm scanning area, centered on the fovea and/or area corresponding to the outer retinal disruption on SD-OCT was obtained. Two consecutive B-scans (M-B frames), each containing 304 A-scans were captured at each sampling location and SSADA was used to extract OCTA information. The OCT signal strength score is considered “unacceptable” of the score is less than 40, “acceptable” if the score is between 40 and 50, and “good” if the score is greater than 50. We only analyzed images with a score greater than 50. En face OCT angiograms were segmented to define the SCP, DCP and choriocapillaris, using the segmentation algorithm by the builtin software.
Two independent masked graders (F.S. and A.A.F.), masked to any associated information, analyzed SD-OCT and angiographic images from the OCTA device. The SD-OCT scans for each patient were qualitatively evaluated as normal or as having thinning of the inner retina and/or outer retina. Outer retinal changes were defined as focal thinning of the outer nuclear layer (ONL), disruption of the external limiting membrane, disruption of the inner segment-outer segment (IS/OS) junction, or thinning/absence of the OS-retinal pigment epithelium (RPE) junction. Scans, where the presence of macular edema was noted, were not considered for the analysis. The OCTA images were examined to define the presence and location of capillary non-perfusion areas and/or reduced capillary density either in the SCP or DCP, which appeared as areas of capillary non-perfusion (non-flow areas wider than 100 microns) on the OCTA.
Incidents of disagreement between graders (three cases in SD-OCT and one case in OCTA) were resolved by an open discussion and review of the data to reach consensus. Medical records were reviewed to gather information about systemic renal and hypertension status, visual acuity, data regarding slit lamp biomicroscopy, and any history of retinal laser treatment or intravitreal injection or surgery.
Results
This study included a total of 14 eyes of 10 patients aged 34 to 58 years with mean duration of diabetes mellitus (DM) of 12.6 years. A healthy control eye from a 42-year-old subject (non-diabetic) was included for comparison. Eight eyes with DR showed evidence of capillary non-perfusion (non-flow) at the level of the DCP (with or without SCP involvement) in the macula. Six additional eyes with DR and normal DCP, with or without evidence of SCP changes on OCTA served as controls and did not show any outer retinal abnormalities on SD-OCT. The demographic characteristics and ocular findings are summarized in the Table.
Table.
DEMOGRAPHIC CHARACTERISTICS OF STUDY PARTICIPANTS WITH DIABETIC RETINOPATHY
| Case Number | Sex/Age, y | DM Type | Duration of DM, y | HbA1c | HTN | HLD | KD | Study Eye | BCVA | DR Stage | Laser Treatment | Diabetes Medication |
|---|---|---|---|---|---|---|---|---|---|---|---|---|
| Healthy Control | M/42 | - | - | - | No | No | No | Left | 20/20 (OU) | - | None | - |
| 1 | M/41 | 2 | 10 | 11.3 | No | No | No | Both | 20/20 (OU) | Moderate NPDR | None | Metformin |
| 2 | F/33 | 1 | 26 | 9 | No | No | No | Both | 20/20 (OU) | PDR | PRP (OS) | Insulin |
| 3 | M/39 | 1 | 34 | 7.3 | No | No | Yes | Left | 20/30 | PDR | None | Insulin |
| 4 | F/74 | 2 | 28 | 8 | Yes | No | No | Left | 20/20 | PDR | PRP (OU) | Metformin |
| 5 | M/55 | 2 | 12 | 7 | Yes | Yes | No | Left | 20/40 | PDR | PRP (OU) | Metformin |
| 6 | M/42 | 2 | 5 | 7.9 | Yes | No | No | Right | 20/20 | PDR | PRP + Focal (OU) | Insulin, liraglutide |
| 7 | M/53 | 2 | 4 | 7.4 | No | No | No | Right (Control) | 20/20 | NPDR | None | Metformin |
| 8 | F/52 | 2 | 1 | 7.0 | Yes | Yes | No | Both (Control) | 20/30 (OD), 20/20 (OS) | NPDR | None | Metformin |
| 9 | F/53 | 2 | 0.25 | 7.2 | Yes | Yes | No | Both (Control) | 20/30 (OD), 20/40 (OS) | NPDR | None | Metformin |
| 10 | F/46 | 2 | 4 | 6.3 | No | No | No | Left (Control) | 20/20 (OU) | NPDR | None | glipizide, plioglitazone |
Abbreviations: DM = Diabetes mellitus, HbA1c = Glycated hemoglobin, percent of total hemoglobin, HTN = Hypertension, HLD = Hyperlipidemia, KD = Kidney disease, BCVA = Best corrected visual acuity, DR = Diabetic retinopathy, PDR = Proliferative diabetic retinopathy, NPDR = Non-proliferative diabetic retinopathy, PRP = Panretinal photocoagulation, OU = Oculus uterque (both eyes), OD = Oculus dexter (right eye), OS = Oculus sinister (left eye), y = Years
Imaging Findings
OCTA in eight eyes showed capillary derangements including an irregular and enlarged contour of FAZ along with reduced capillary density, appearing as areas of capillary non-perfusion (non-flow) of either SCP or DCP or both. Point-by-point correlation between areas of capillary non-perfusion on OCTA showed exact correspondence to outer retinal disruption on B-scan SD-OCT.
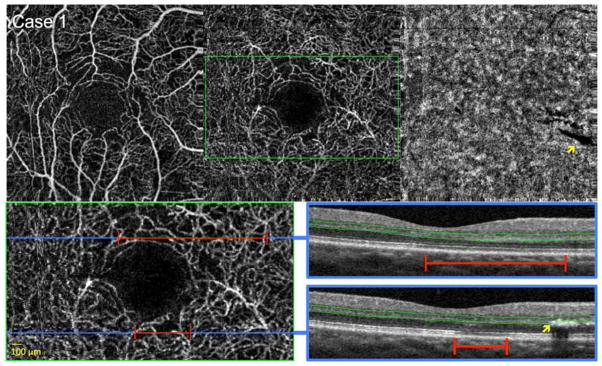
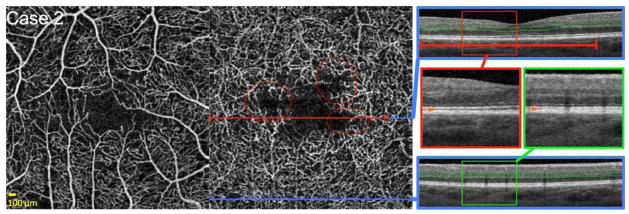
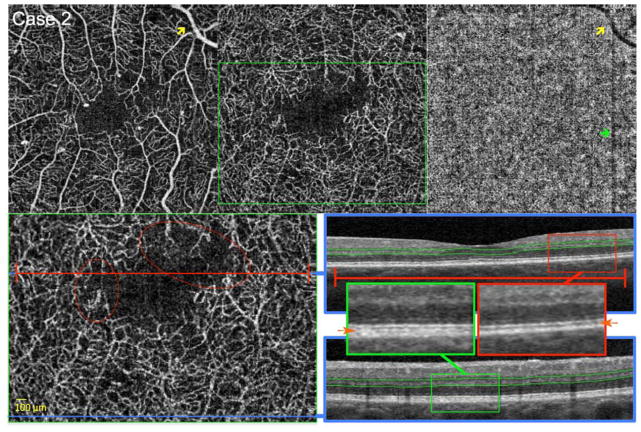
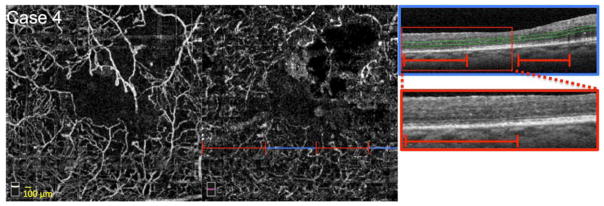
Based on OCTA images analysis, the eight eyes were divided in two groups. In the first group, four eyes of three patients (Figures 2, 3 and 4) had mild reduced capillary density or areas of reduced flow intensity suggestive of low flow within the DCP.12 Group two comprised the remaining four eyes (Figures 5 and 6, Supplemental Figure), which had larger zones of complete capillary non-flow, at the level of the DCP.
FIGURE 2. Diabetic Macular Ischemia with Flow Abnormalities and Mild Decreased Deep Capillary Density Around the Foveal Avascular Zone.
Case 1, Right eye. Optical coherence tomography angiography (OCTA) of the superficial capillary plexus (SCP) (top left), deep capillary plexus (DCP) (top middle), and choriocapillaris (top right). A shadow artifact from an overlying retinal exudate is seen in the choriocapillaris (yellow arrow). Bottom left: enlarged inset of DCP from top middle (green box). Blue lines indicate location of B-scans, and red lines highlight abnormalities in flow. OCTA reveals a slightly irregular contour of the FAZ with surrounding areas of deceased capillary density in both SCP and DCP, appearing as areas of non-flow significantly larger than 100 microns. Bottom right: OCT B-scans showing DCP segmentation boundaries (green lines). Top and bottom OCT B-scans show focally reduced reflectivity of the inner segment-outer segment and outer segment-retinal pigment epithelium junctions in areas corresponding to decreased capillary density (red lines). Bottom B-scan shows the retinal exudate causing a shadow artifact on the choriocapillaris (top right) (yellow arrows), but note that no artifacts are seen in the DCP angiogram, since this exudate is casting a shadow below the DCP segmentation boundaries (green lines).
FIGURE 3. Reduced Flow Signal at the Level of the Deep Capillary Plexus (DCP) Around the Foveal Avascular Zone (FAZ).
Case 2, Right eye. Optical coherence tomography angiography (OCTA) of the superficial capillary plexus (SCP) (left) and DCP (middle). Blue lines indicate locations of B-scans, and red line highlights abnormalities in flow. OCTA of the DCP reveals an irregular contour of the FAZ with non-flow areas around the FAZ, with a relatively intact overlying SCP. Furthermore, low pixel intensity of capillaries compared to surround indicate reduced capillary flow signal at the level of the DCP (red circles). Right: OCT B-scans (blue boxes) showing DCP segmentation boundaries (green lines). Red and green boxes indicate location of enlarged insets for top and bottom B-scan, respectively. Top B-scan shows lower reflectivity of the inner segment-outer segment and outer segment-retinal pigment epithelium junctions (OS/RPE) corresponding to zones of reduced capillary flow signal on OCTA (red lines). The bottom B-scan shows healthy photoreceptor lines corresponding to an area of normal DCP capillary perfusion on OCTA (bottom blue line). Inset B-scans: Orange arrows in enlarged insets point to location of OS/RPE. The top scan (red box) shows indistinct (hypo-reflective) OS/RPE junction in an area of reduced capillary flow signal. Bottom scan (green box) shows the normally hyper-reflective OS/RPE junction in an area of normal DCP perfusion.
FIGURE 4. Reduced Flow Signal Around the Foveal Avascular Zone (FAZ).
Case 2, Left eye. Optical coherence tomography angiography (OCTA) of the superficial capillary plexus (SCP) (top left), deep capillary plexus (DCP) (top middle), and choriocapillaris (top right). A large retinal vessel in the SCP produces a shadow artifact in the choriocapillaris (yellow arrows). A gap defect artifact related to eye movement produces a dark vertical line on the choriocapillaris (green arrow). Bottom left: enlarged inset of DCP from top middle (green box). Blue lines indicate location of B-scans, and red line highlights abnormalities in flow. Red circles highlight areas of decreased capillary flow signal. OCTA reveals an irregular contour of the FAZ, more pronounced in the DCP, with non-flow areas around the FAZ. Low pixel intensity of capillaries compared to surround indicate reduced capillary flow signal at the level of the DCP (red circles). Bottom right: OCT B-scans showing DCP segmentation boundaries (green lines). Red and green boxes indicate location of enlarged insets for top and bottom B-scan, respectively. B-scans: Orange arrows in enlarged insets point to location of OS/RPE. The top scan (inset in red box) shows hypo-reflectivity and shortening of the OS/RPE junction, as well as decreased reflectivity of the IS/OS in an area of reduced capillary flow signal. Bottom scan (green box) shows the normal hyper-reflectivity of the IS/OS and OS/RPE junctions in an area of normal DCP perfusion. In addition, comparing the insets, side by-side, shows decreased distance between IS/OS and RPE lines, which suggests shortening of the photoreceptors in area of DCP non-perfusion (red inset box)
FIGURE 5. Large Zones of Closure of the Capillaries at the Level of the Deep Capillary Plexus (DCP).
Case 4, Left eye. Optical coherence tomography angiography (OCTA) of the superficial capillary plexus (SCP) (left) and DCP (middle). Blue line indicates location of OCT B-scan, and red lines highlight abnormalities in flow. OCTA reveals enlargement of the foveal avascular zone (FAZ), more pronounced at the level of the DCP. OCTA also shows reduced capillary density in both SCP and DCP, appearing as large areas of non-flow. Right: OCT B-scan (blue box) showing DCP segmentation boundaries (green lines). Red box indicates location of enlarged inset below. B-scan shows reduced reflectivity of the inner segment-outer segment and outer segment-retinal pigment epithelium junctions in areas of decreased capillary density (red lines), with intervening areas of more distinct photoreceptor lines, overlying zones with relatively higher capillary density.
FIGURE 6. Large Zones of Closure of the Capillaries at the Level of the Deep Capillary Plexus (DCP).
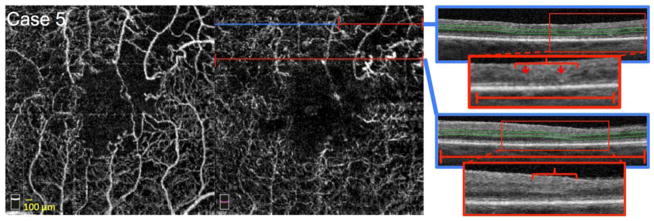
Case 5, Left eye. Optical coherence tomography angiography (OCTA) of the superficial capillary plexus (SCP) (left) and DCP (middle). Blue lines indicate location of B-scans, and red lines highlight abnormalities in flow. OCTA reveals enlargement of the FAZ and large confluent areas of non-flow nasal, temporal and superotemporal to the fovea. Capillary non-perfusion is more apparent at the level of the DCP. Right: OCT B-scans showing DCP segmentation boundaries (green lines). Red boxes indicate locations of enlarged insets seen below. Top scan shows thinning of the outer nuclear layer (ONL) (red bracket), discontinuity of the external limiting membrane (red arrows), and decreased reflectivity of the inner segment-outer segment (IS/OS) (red arrows) and outer segment-retinal pigment epithelium (OS/RPE) junctions in the area of capillary non-flow (red line). Bottom scan shows thinning of the ONL (red bracket), with decreased reflectivity of the IS/OS and OS/RPE junctions throughout the scan in an area of capillary non-flow (red line).
These areas of DCP non-perfusion or reduced flow co-localized tightly with outer retinal changes on SD-OCT in all the eyes (Figures 2–6, Supplemental Figure). In these DCP ischemia zones, the SD-OCT scans revealed a spectrum of thinning of ONL, decreased intensity as well as disruption of IS/OS and hyporeflectivity/loss of the OS/RPE junctions in all eight eyes.
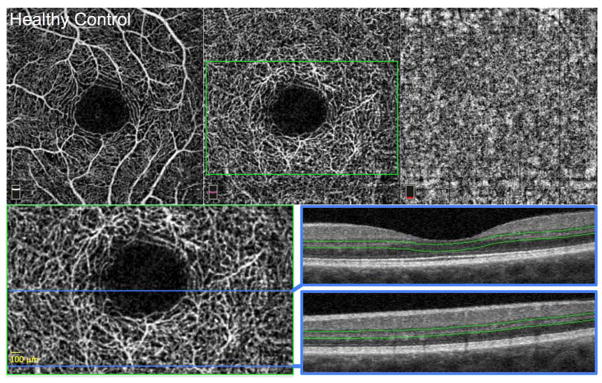
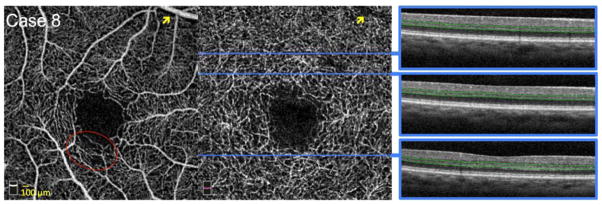
Six eyes with diabetic retinopathy and one healthy eye had normal macular DCP on OCTA (with or without capillary non-perfusion in the SCP). These eyes served as controls and did not show any outer retinal abnormalities on SD-OCT (Figures 1 and 7).
FIGURE 1. Control Healthy Eye.
Left eye. Optical coherence tomography angiography (OCTA) of the superficial capillary plexus (SCP) (top left), deep capillary plexus (DCP) (top middle), and choriocapillaris (top right). The SCP and DCP show normal contour of the foveal avascular zone (FAZ) with dense, homogenous capillary networks surrounding the FAZ, without visible non-flow areas that are larger than 100 microns. Bottom left: enlarged inset of DCP from top middle (green box) with location of OCT B-scans (blue lines). Bottom right: OCT B-scans showing DCP segmentation boundaries (green lines). Both scans show normal outer retinal layers with distinct and continuous inner segment-outer segment and outer segment-retinal pigment epithelium junctions.
FIGURE 7. Normal Perfusion and Flow Signal of the Deep Capillary Plexus (DCP) around a Normal Foveal Avascular Zone (FAZ).
Case 8, Right eye. Optical coherence tomography angiography (OCTA) of the superficial capillary plexus (SCP) (left) and DCP (middle). A large retinal vessel in the SCP produces a shadow artifact in the DCP (yellow arrows). Blue lines indicate location of B-scans on DCP. OCTA reveals a regular contour of the superficial and deep FAZ, with dense, homogenous DCP with strong flow signal around the FAZ. SCP shows a small area of reduced capillary density (red circle) with normal capillary perfusion of the underlying DCP. Right: OCT B-scans showing DCP segmentation boundaries (green lines). All OCT B-scans show normal homogenous hyper-reflective inner segment-outer segment and outer segment-retinal pigment epithelium junctions. All outer retinal layers appear normal. OCT shows no evidence of outer retinal disruption in the area corresponding to SCP non-flow.
Discussion
In this study we confirm our hypothesis that diabetic macular ischemia at the level of DCP, seen as either focally absent or low intensity flow within the DCP on OCTA, is associated with outer retinal disruption on OCT.8 The spectrum of outer retinal changes include different degrees of thinning of the ONL, disruption of the photoreceptor lines as well as focal photoreceptor layer thinning in this series of eight eyes of six patients diagnosed with various stages of DR and diabetic macular ischemia.
In a recent study, using OCT scans co-registered to the corresponding regions on fluorescein angiography (FA), our group showed that outer retinal changes on OCT correlated tightly to zones of capillary non-perfusion in eyes with DR without DME.8 However, since FA only shows the SCP,13 we could not confirm the status of the DCP network. In comparison, using OCTA in this series, we confirm that regions of outer retinal changes seen on OCT correlated tightly with overlying DCP flow abnormalities. Hence, we have confirmed our hypothesis that DCP ischemia contributes to disruption of the outer retina including thinning of the outer nuclear layer and photoreceptors in the setting of diabetic macular ischemia. Moreover, by confining our analysis to areas without DME, we excluded the possibility that either the OCT or OCTA changes could be related to optical artifact from overlying retinal cystic changes.
Previous studies have demonstrated the ability of OCTA to visualize retinal capillary non-perfusion corresponding to those seen on FA, with the added benefit of localizing these abnormalities to either the SCP or DCP in DR.10, 14 Furthermore, OCTA was also used to evaluate the FAZ in patients with DR.15, 16 Indeed, recent studies demonstrated that FAZ diameter is larger in diabetic patients than in healthy eyes, especially in the presence of more severe retinopathy.15, 16 Whereas healthy subjects showed a well-defined regular contour of the FAZ, patients with different stages of non-proliferative diabetic retinopathy had a larger perivascular space as well as an unclear and irregular contour of the FAZ.15 Interestingly, vascular abnormalities were more pronounced at the level of the DCP, and areas of capillary non-perfusion on FA corresponded to areas of reduced capillary density on OCTA images. This finding was observed with a higher prevalence in the DCP layer.15
The OCTA software (SSADA) calculates decorrelation by analyzing the difference in OCT signal amplitude between two sequential B-scans taken at the same location to yield a decorrelation value between zero and one. The en face projection angiograms are based on these decorrelation measurements, whereby decorrelation values and blood flow velocity are linearly related within a limited range.17 A study using flow in phantom tubes found that this relationship saturates rapidly for higher flow making flow velocity measurements in larger vessels impossible. These authors found that SSADA is particularly sensitive to the normal capillary flow speeds (between 0.4 and 3 mm/s). At lower and higher speeds the relationship reaches a plateau, becoming more sigmoid in appearance.12 Figures 3 and 4 show capillaries with flow that we believe is only slightly above the SSADA threshold, appearing as very faint grey pixels (red circles). These areas correspond to hypo-reflectivity and/or focal loss of the OS/RPE band (Figures 3 and 4).
Evaluating the OCTA images of our patients, it is important to note that in some of the eyes in this series, DCP non-perfusion occurred in regions with relatively intact overlying SCP (Left eye of Case 1, data not shown; both eyes of Case 2, figure 3 and 4; Case 3, not shown and Case 7, Supplemental Figure), while in others there was co-localization of non-perfusion in both networks (Right eye of Case 1, figure 1; Case 4, figure 5 and Case 5, figure 6). Further quantitative studies would be helpful to evaluate the relative consequences of these types of interactions, and whether overlapping non-perfusion in both networks could lead to more severe derangements in the outer retina. However, our study was not designed to measure the areas of capillaries non-perfusion so we cannot provide any data regarding the relative size of SCP non-perfusion compared to DCP.
Using intraretinal electrodes to map out the retinal oxygen distribution in primates, Birol et al. estimated that under normal conditions, the retinal circulation provides 15% of the oxygen needs of the inner segments during dark adaptation and only a little less during light adaptation.5 Further, the DCP is critical for supplying the metabolic needs of the highly specialized photoreceptor synapses in the outer plexiform layer (OPL).5,18 However, in the setting of diabetic retinopathy or other ischemic retinal disease, these estimations may not be directly applicable. Furthermore, while the retinal circulation under normal conditions contributes to outer retinal metabolism, during DR, failure of retinal autoregulation may further compromise this contribution and jeopardize outer retinal metabolic needs.19 The photoreceptors and the OPL residing in the watershed zone, where both the choroidal and retinal circulations might provide oxygen support, will be most susceptible to ischemic insults affecting the retinal circulation, particularly the DCP, with further decreased oxygen tension in this watershed zone, followed by outer retinal disruption. We extrapolate from these findings to propose that in diabetic retinopathy, with macular capillary closure and decreased perfusion in the DCP, the focal photoreceptor compromise we have demonstrated is a result of chronic failure of this compensatory retinal vascular mechanism in the setting of DCP ischemia. We will be able to explore these questions in diabetic patients in greater detail, with the recent development of visible-OCT for human retinal metabolic imaging.20
We have ruled out a significant contribution of the choriocapillaris to this ischemic mechanism, since our cases do not show any focal flow voids in the choriocapillaris (Figures 2 and 4). While OCTA does not allow for quantitative measurements, the lack of focally absent choriocapillaris flow in the areas of outer retinal disruption balanced by the co-localization of DCP derangements further support our conclusion. Furthermore, the current OCTA images of the choriocapillaris are highly subject to artifacts from inner retinal changes, including retinal vascular shadows (Case 2, figure 4 and Case 8, figure 7) or shadows cast by retinal exudates and hemorrhages (Case 1, figure 2), making it difficult to completely evaluate the choriocapillaris in this population. It is plausible that in patients with DR and other concomitant diseases including hypertension, hyperlipidemia and kidney dysfunction, ischemia of both the SCP and DCP may be further complicated by choriocapillaris ischemia, related to diabetic and/or hypertensive choroidopathy21–25, and cause more pronounced outer retinal disruption.
We have previously proposed that acute ischemia of the DCP may play a role in acute macular neuroretinopathy, resulting in a cascade of outer retinal changes, which start at the outer plexiform/Henle fiber layer and progress over the following days to involve the photoreceptors, as visualized on SD-OCT.26, 27 In a recent study we proposed similar involvement of the DCP in diabetic patients with chronic macular ischemia, which we have further confirmed in this study. 8, 26 Based on the relatively normal appearance of the choriocapillaris on OCTA underlying areas of outer retinal OCT changes in this population, we believe that the role of choroidal involvement in acute macular neuroretinopathy and ischemic diabetic maculopathy remains to be confirmed.
We acknowledge the inherent limitations of our series, including the relatively small numbers of eyes, as well as the lack of quantitative data. Excluding eyes with macular edema significantly reduced the sample size. In a recent study that included 54 eyes with diabetic macular ischemia, only 24 (44.4%) presented with ischemia but without DME, which reflects the difficult task of recruiting similar eyes for our current study.28 However, by restricting inclusion criteria to limit this study to eyes without significant DME, concomitant macular laser or antiVEGF therapy, we were able to recruit a uniform study sample and confirm our hypothesis. We also acknowledge that the OCT data from this study does not reveal the exact photoreceptor components that are adversely affected due to DCP non-perfusion. Future studies using adaptive optics scanning laser ophthalmology and quantitative OCT measurements are needed to assess the precise subcellular compartments of photoreceptor compromise.
In conclusion, using OCTA, this study confirms that photoreceptor disruption on SD-OCT in eyes with DMI corresponds to areas of capillary non-flow at the level of DCP. This observation is important in understanding the mechanism of visual compromise in the setting of DR, as well as adding further evidence to the previously under-appreciated contribution of the DCP to the metabolic oxygen requirements of the outer retina. We believe that OCTA provides a novel, non-invasive tool that will contribute to an improved understanding of the pathophysiology of diabetic macular ischemia at the microvascular level. Future studies to investigate the photoreceptors in greater detail, including psychophysical and adaptive optics imaging studies, will be important to further delineate the functional and anatomic consequences of DCP compromise in this population. Further, recent developments in OCTA, including visible-light OCT6, 20, 29, will greatly improve our understanding of the complex metabolic derangements related to decreased blood flow and oxygen that ultimately contribute to inner and outer retinal neuronal dysfunction in DR.
Supplementary Material
Acknowledgments
Funding/Support: This work was funded in part by National Institutes of Health study 1DP3DK108248 (AAF), and research instrument support by Optovue, Inc., Fremont, California, USA. The funders had no role in study design, data collection and analysis, data interpretation, decision to publish, or preparation of the manuscript.
The authors wish to acknowledge Dr. Robert Linsenmeier of Northwestern University who provided important scientific feedback and insightful discussions about this manuscript.
Footnotes
Financial Disclosures: No financial disclosures.
Publisher's Disclaimer: This is a PDF file of an unedited manuscript that has been accepted for publication. As a service to our customers we are providing this early version of the manuscript. The manuscript will undergo copyediting, typesetting, and review of the resulting proof before it is published in its final citable form. Please note that during the production process errors may be discovered which could affect the content, and all legal disclaimers that apply to the journal pertain.
References
- 1.Snodderly DM, Weinhaus RS. Retinal vasculature of the fovea of the squirrel monkey, Saimiri sciureus: three-dimensional architecture, visual screening, and relationships to the neuronal layers. J Comp Neurol. 1990;297(1):145–63. doi: 10.1002/cne.902970111. [DOI] [PubMed] [Google Scholar]
- 2.Henkind P. Radial peripapillary capillaries of the retina. I. Anatomy: human and comparative. Br J Ophthalmol. 1967;51(2):115–23. doi: 10.1136/bjo.51.2.115. [DOI] [PMC free article] [PubMed] [Google Scholar]
- 3.Haugh LM, Linsenmeier RA, Goldstick TK. Mathematical models of the spatial distribution of retinal oxygen tension and consumption, including changes upon illumination. Ann Biomed Eng. 1990;18(1):19–36. doi: 10.1007/BF02368415. [DOI] [PubMed] [Google Scholar]
- 4.Linsenmeier RA, Braun RD. Oxygen distribution and consumption in the cat retina during normoxia and hypoxemia. J Gen Physiol. 1992;99(2):177–97. doi: 10.1085/jgp.99.2.177. [DOI] [PMC free article] [PubMed] [Google Scholar]
- 5.Birol G, Wang S, Budzynski E, Wangsa-Wirawan ND, Linsenmeier RA. Oxygen distribution and consumption in the macaque retina. Am J Physiol Heart Circ Physiol. 2007;293(3):H1696–704. doi: 10.1152/ajpheart.00221.2007. [DOI] [PubMed] [Google Scholar]
- 6.Yi J, Liu W, Chen S, et al. Visible light optical coherence tomography measures retinal oxygen metabolic response to systemic oxygenation. Light Sci Appl. doi: 10.1038/lsa.2015.107.2015.09.25. [DOI] [PMC free article] [PubMed] [Google Scholar]
- 7.Arend O, Wolf S, Jung F, et al. Retinal microcirculation in patients with diabetes mellitus: dynamic and morphological analysis of perifoveal capillary network. Br J Ophthalmol. 1991;75(9):514–8. doi: 10.1136/bjo.75.9.514. [DOI] [PMC free article] [PubMed] [Google Scholar]
- 8.Scarinci F, Jampol LM, Linsenmeier RA, Fawzi AA. Association of Diabetic Macular Nonperfusion With Outer Retinal Disruption on Optical Coherence Tomography. JAMA Ophthalmol. 2015;133(9):1036–44. doi: 10.1001/jamaophthalmol.2015.2183. [DOI] [PMC free article] [PubMed] [Google Scholar]
- 9.Jia Y, Tan O, Tokayer J, et al. Split-spectrum amplitude-decorrelation angiography with optical coherence tomography. Opt Express. 2012;20(4):4710–25. doi: 10.1364/OE.20.004710. [DOI] [PMC free article] [PubMed] [Google Scholar]
- 10.Ishibazawa A, Nagaoka T, Takahashi A, et al. Optical Coherence Tomography Angiography in Diabetic Retinopathy: A Prospective Pilot Study. Am J Ophthalmol. 2015;160(1):35–44. doi: 10.1016/j.ajo.2015.04.021. [DOI] [PubMed] [Google Scholar]
- 11.Aiello LP, Beck RW, Bressler NM, et al. Rationale for the diabetic retinopathy clinical research network treatment protocol for center-involved diabetic macular edema. Ophthalmology. 2011;118(12):e5–e14. doi: 10.1016/j.ophtha.2011.09.058. [DOI] [PMC free article] [PubMed] [Google Scholar]
- 12.Tokayer J, Jia Y, Dhalla A-H, Huang D. Blood flow velocity quantification using split-spectrum amplitude-decorrelation angiography with optical coherence tomography. Biomed Opt Express. 2013;4(10):1909–1924. doi: 10.1364/BOE.4.001909. [DOI] [PMC free article] [PubMed] [Google Scholar]
- 13.Pinhas A, Razeen M, Dubow M, et al. Assessment of perfused foveal microvascular density and identification of nonperfused capillaries in healthy and vasculopathic eyes. Invest Ophthalmol Vis Sci. 2014;55(12):8056–66. doi: 10.1167/iovs.14-15136. [DOI] [PMC free article] [PubMed] [Google Scholar]
- 14.Hwang TS, Jia Y, Gao SS, et al. Optical coherence tomography angiography features of diabetic retinopathy. Retina. 2015;35(11):2371–6. doi: 10.1097/IAE.0000000000000716. [DOI] [PMC free article] [PubMed] [Google Scholar]
- 15.Freiberg FJ, Pfau M, Wons J, Wirth MA, Becker MD, Michels S. Optical coherence tomography angiography of the foveal avascular zone in diabetic retinopathy. Graefes Arch Clin Exp Ophthalmol. 2015:1–8. doi: 10.1007/s00417-015-3148-2. [DOI] [PMC free article] [PubMed] [Google Scholar]
- 16.Di G, Weihong Y, Xiao Z, et al. A morphological study of the foveal avascular zone in patients with diabetes mellitus using optical coherence tomography angiography. Graefes Arch Clin Exp Ophthalmol. 2015:1–7. doi: 10.1007/s00417-015-3143-7. [DOI] [PubMed] [Google Scholar]
- 17.Jia Y, Tan O, Tokayer J, et al. Split-spectrum amplitude-decorrelation angiography with optical coherence tomography. Opt Express. 2012;20(4):4710–4725. doi: 10.1364/OE.20.004710. [DOI] [PMC free article] [PubMed] [Google Scholar]
- 18.Usui Y, Westenskow PD, Kurihara T, et al. Neurovascular crosstalk between interneurons and capillaries is required for vision. J Clin Invest. 2015;125(6):2335–46. doi: 10.1172/JCI80297. [DOI] [PMC free article] [PubMed] [Google Scholar]
- 19.Grunwald JE, Riva CE, Brucker AJ, Sinclair SH, Petrig BL. Altered retinal vascular response to 100% oxygen breathing in diabetes mellitus. Ophthalmology. 1984;91(12):1447–52. doi: 10.1016/s0161-6420(84)34124-0. [DOI] [PubMed] [Google Scholar]
- 20.Yi J, Chen S, Shu X, Fawzi AA, Zhang HF. Human retinal imaging using visible-light optical coherence tomography guided by scanning laser ophthalmoscopy. Biomed Opt Express. 2015;6(10):3701–13. doi: 10.1364/BOE.6.003701. [DOI] [PMC free article] [PubMed] [Google Scholar]
- 21.Hidayat AA, Fine BS. Diabetic choroidopathy. Light and electron microscopic observations of seven cases. Ophthalmology. 1985;92(4):512–22. [PubMed] [Google Scholar]
- 22.Nagaoka T, Kitaya N, Sugawara R, et al. Alteration of choroidal circulation in the foveal region in patients with type 2 diabetes. Br J Ophthalmol. 2004;88(8):1060–3. doi: 10.1136/bjo.2003.035345. [DOI] [PMC free article] [PubMed] [Google Scholar]
- 23.Schocket LS, Brucker AJ, Niknam RM, Grunwald JE, DuPont J, Brucker AJ. Foveolar choroidal hemodynamics in proliferative diabetic retinopathy. Int Ophthalmol. 2004;25(2):89–94. doi: 10.1023/b:inte.0000031744.93778.60. [DOI] [PubMed] [Google Scholar]
- 24.Adhi M, Brewer E, Waheed NK, Duker JS. Analysis of morphological features and vascular layers of choroid in diabetic retinopathy using spectral-domain optical coherence tomography. JAMA Ophthalmol. 2013;131(10):1267–74. doi: 10.1001/jamaophthalmol.2013.4321. [DOI] [PMC free article] [PubMed] [Google Scholar]
- 25.Hua R, Liu L, Wang X, Chen L. Imaging evidence of diabetic choroidopathy in vivo: angiographic pathoanatomy and choroidal-enhanced depth imaging. PloS One. 2013;8(12):e83494. doi: 10.1371/journal.pone.0083494. [DOI] [PMC free article] [PubMed] [Google Scholar]
- 26.Fawzi AA, Pappuru RR, Sarraf D, et al. Acute macular neuroretinopathy: long-term insights revealed by multimodal imaging. Retina. 2012;32(8):1500–13. doi: 10.1097/IAE.0b013e318263d0c3. [DOI] [PubMed] [Google Scholar]
- 27.Munk MR, Jampol LM, Souza EC, et al. New associations of classic acute macular neuroretinopathy. Br J Ophthalmol. 2016;100(3):389–94. doi: 10.1136/bjophthalmol-2015-306845. [DOI] [PubMed] [Google Scholar]
- 28.Sim DA, Keane PA, Fung S, et al. Quantitative analysis of diabetic macular ischemia using optical coherence tomographyOCT features of diabetic macular ischemia. Invest Ophthalmol Vis Sci. 2014;55(1):417–423. doi: 10.1167/iovs.13-12677. [DOI] [PubMed] [Google Scholar]
- 29.Soetikno B, Yi J, Shah R, et al. Oxygen Metabolism of the Inner Retina in a 50/10 Rat Model of Oxygen-Induced Retinopathy. Sci Rep. doi: 10.1038/srep16752.2015.11.18. [DOI] [PMC free article] [PubMed] [Google Scholar]
Associated Data
This section collects any data citations, data availability statements, or supplementary materials included in this article.


