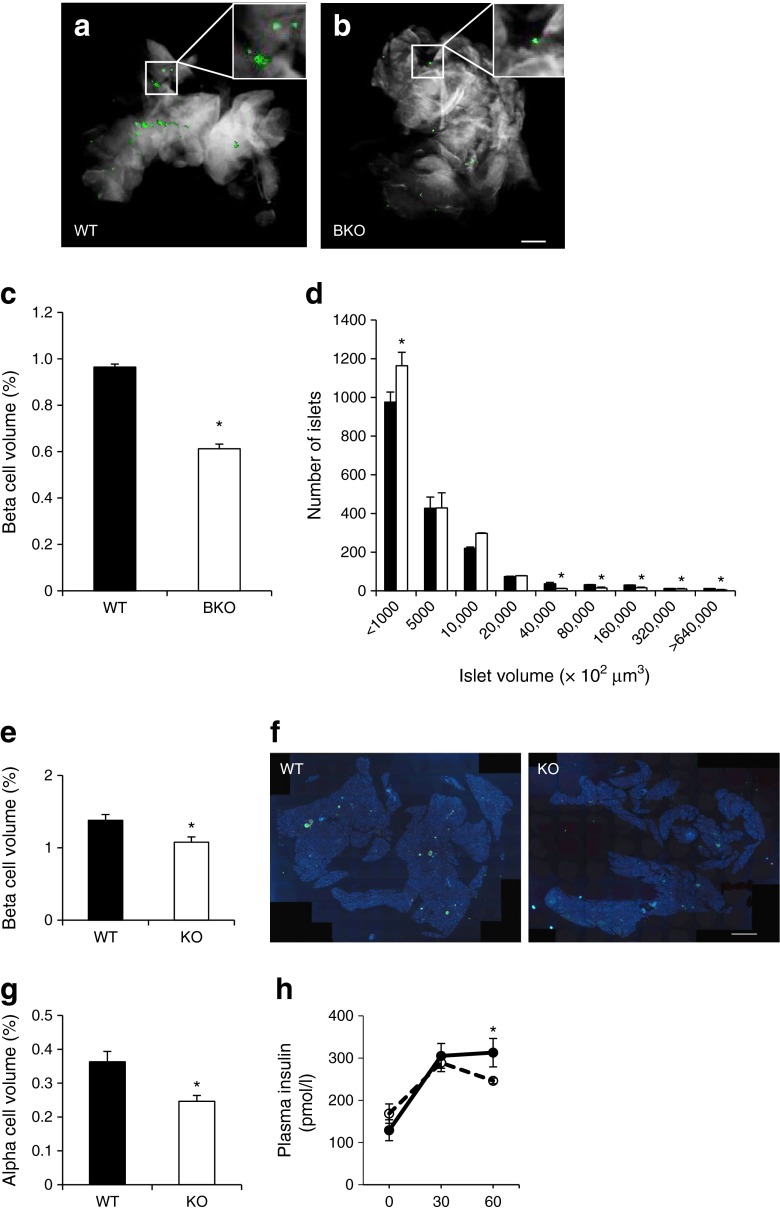
Fig. 4.
Beta and alpha cell volume and plasma insulin levels in PaskBKO and global Pask-null mice. Beta cell volume was measured by optical projection tomography, as described in the Methods section. Representative images of pancreases from WT (a) and PaskBKO (b) mice are shown, with insulin staining in green; scale bar, 500 μm. Quantification of beta cell relative to total pancreas volume (c) and size distribution of islets (d); PaskBKO in white, WT in black. (e, g) Beta and alpha cell mass and (h) plasma insulin levels after an IPGTT in global Pask-null mice (KO, white columns or dotted line; WT in black columns or solid line) were assessed by wide-field microscopy and following immunohistochemistry, respectively. (f) Representative images of pancreatic sections from WT and global Pask-null mice; scale bar, 1000 μm. Data were from at least four mice per genotype, aged 20 weeks; *p ≤ 0.05 by Student’s t test with Bonferroni correction for multiple tests

