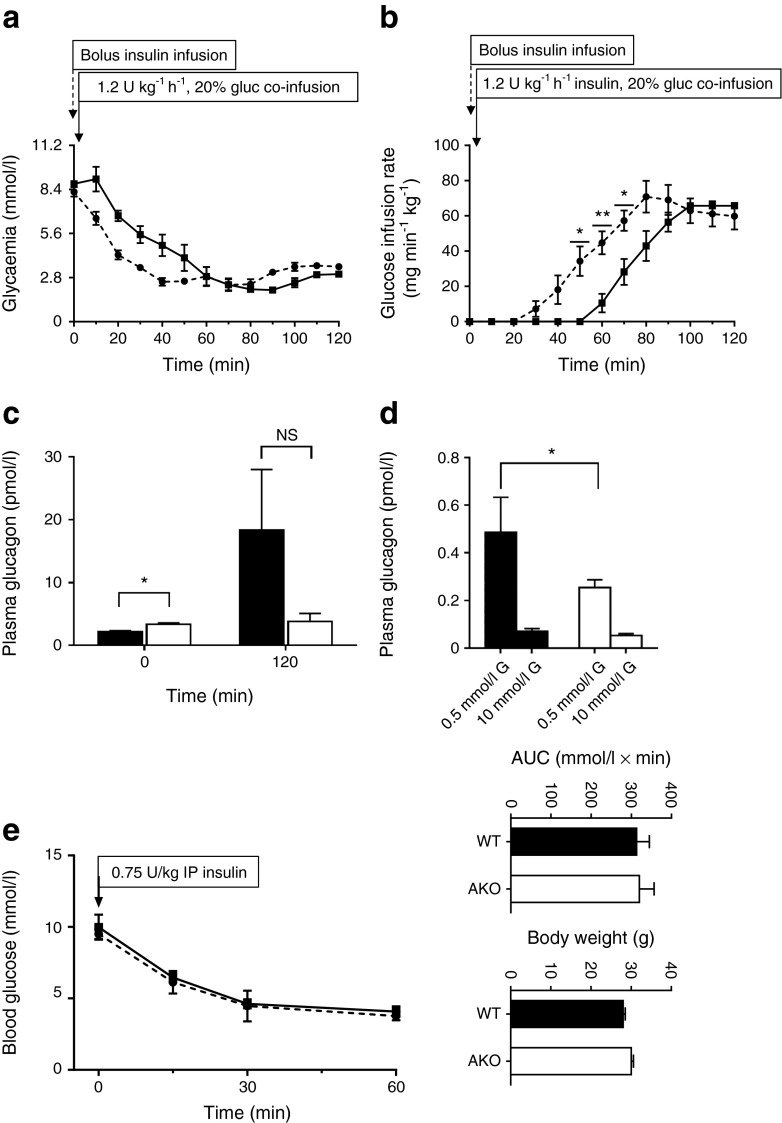
Fig. 7.
Hyperinsulinaemic–hypoglycaemic clamps in PaskAKO and WT mice, and release of glucagon from isolated islets. Blood glucose levels (a) and glucose infusion rate (b) measured in PaskAKO (dotted line) and WT littermates (solid line) during insulin (1.2 U kg−1 h−1) and glucose (gluc, 20%) co-infusion 5 min after bolus insulin infusion (0 min). The glucose infusion rate is indicated in (b). (c) Blood glucagon measurement before (0 min) and at the end (120 min) of the clamp. Data are expressed as means ± SEM; n = 3–5 mice per genotype. (d) Glucagon release from PaskAKO mouse and control islets in response to low (0.5 mmol/l) or high (10 mmol/l) glucose (G). (e) Insulin (0.75 U/kg, 0 min) tolerance test on 24-week-old male PaskAKO (n = 3; dotted line) or WT (n = 5; solid line) mice. *p < 0.05, **p < 0.01 by Student’s t test with Bonferroni correction

